
Key takeaways
- Houston and Dallas-Fort Worth added more residents than any other U.S. metro areas in the year to July 2025, ~127,000 and ~124,000, roughly twice the gain of third-place Atlanta.
- Since 2021, most of that growth has come from people moving in, from other states and from abroad, and the movers skew toward young adults, the age group most likely to rent.
- Each metro added ~94,000 to ~96,000 renter households from 2021 to 2025, and both have added jobs much faster than the nation since early 2020.
- Growth slowed in 2025, as international migration fell and domestic moves cooled, and job growth has eased, so the case for rental demand rests on a steady base rather than on the surge of 2022 to 2024.
The setup in one paragraph
Apartment demand comes down to households: each new renter household needs a unit, and each one that buys a house frees one up. Households form when people move into a metro, when young adults leave roommates or family to live on their own, and when jobs give them the income to do so. Houston and Dallas-Fort Worth have led on all three measures, which is why they absorbed record apartment supply in 2024 and 2025. This guide follows the chain from people to households to jobs, using the Census Bureau's population estimates and American Community Survey (ACS), the IRS's migration data, the Bureau of Labor Statistics (BLS), the Federal Reserve Bank of Dallas and the Texas Demographic Center. Our companion Deep Dive, Higher Rates, More Renters: How Housing Costs and a Thinner Pipeline Shape Rental Demand, covers interest rates, supply and absorption, and the Houston Multifamily Development Outlook and Grand Prairie & DFW Multifamily Development Outlook cover each market in more depth; this one focuses on the demand side.
The two fastest-growing metros in the country
In the Census Bureau's Vintage 2025 estimates, the Houston metro grew by 126,720 residents from July 2024 to July 2025 (+1.6%), and Dallas-Fort Worth by 123,557 (+1.5%), the two largest numeric gains of any U.S. metro area.1 Atlanta was third at 61,953, followed by Phoenix, Charlotte and Austin. The two Texas metros also led over the longer run: from 2020 to 2025, Dallas-Fort Worth added ~810,000 residents to reach ~8.48 million, and Houston ~735,000 to reach ~7.90 million.
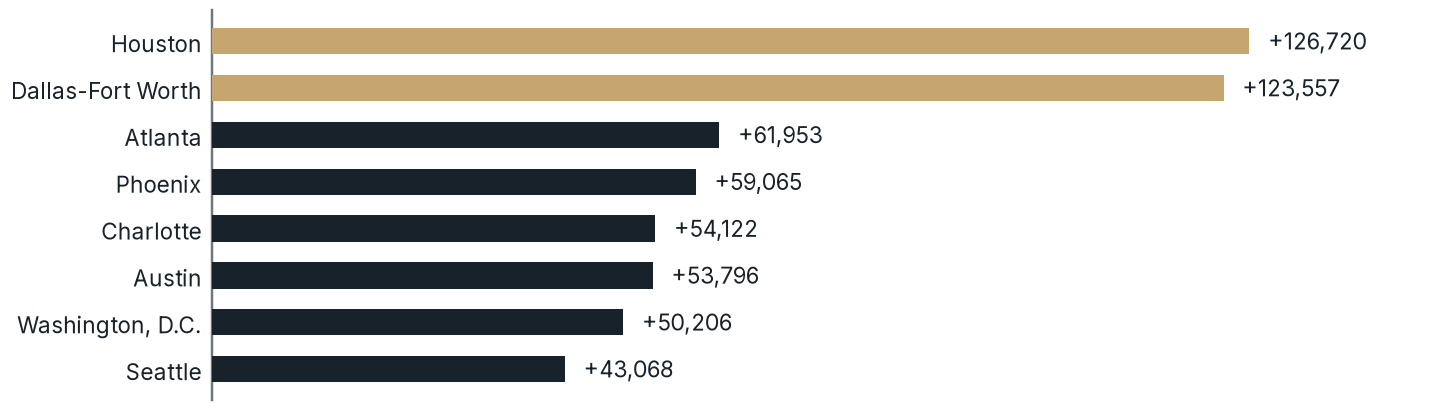
Chart Summary and Key Values
Bar chart of the largest metro population gains in 2025
Source: U.S. Census Bureau, Vintage 2025 Population Estimates.
Together, the two metros accounted for ~14% of U.S. population growth in the year to July 2025, while holding ~4.8% of the nation's residents.
Where the new residents come from
Population change has three parts: natural increase (births minus deaths), domestic migration (moves from elsewhere in the U.S.) and international migration. The mix in Houston and Dallas-Fort Worth has shifted over the past five years.
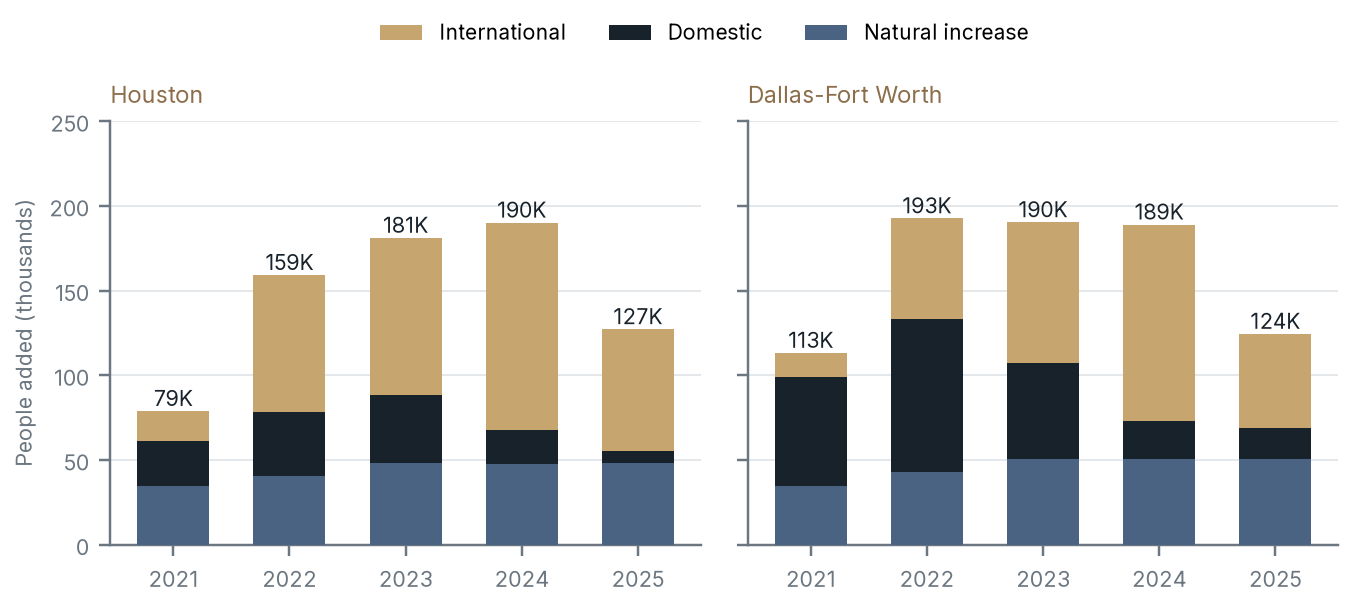
Chart Summary and Key Values
Stacked bar charts of the components of population change by year
Source: U.S. Census Bureau, Vintage 2025 Population Estimates.
In 2021 and 2022, domestic migration was the larger draw, especially in Dallas-Fort Worth, which gained ~90,000 residents from the rest of the country in the year to July 2022.2 From 2023 to 2024, international migration took the lead, reaching ~122,000 in Houston and ~116,000 in Dallas-Fort Worth in 2024. Natural increase has been steady at roughly 48,000 to 51,000 a year in each metro, a reflection of their relatively young populations.

The 2025 slowdown
Growth slowed in 2025. Net international migration fell by more than 40% in each metro, to ~72,000 in Houston and ~55,000 in Dallas-Fort Worth, in line with a national decline from ~2.73 million in 2024 to ~1.26 million in 2025.3 The Census Bureau projects that, if current trends continue, national net international migration could fall to ~321,000 in the year to July 2026, which would remove the largest source of recent growth in both metros.4 Net domestic migration also cooled, to ~7,000 in Houston and ~18,000 in Dallas-Fort Worth, well below the 2022 levels. Even so, the two metros still led the nation in total growth, because their natural increase alone is comparable to the total growth of many large metros.
For apartment demand, the slowdown matters. Population growth of ~1.5% a year is still strong by national standards (the U.S. grew ~0.5%), but it is below the ~2% to 2.5% pace of 2023 and 2024. We treat the 2025 numbers as the more realistic base for planning, rather than the peak years.
Which states new residents come from
IRS data on tax returns filed in consecutive years show where movers lived the year before. Between the 2022 and 2023 filing years, the Houston metro gained ~31,800 more people from other states than it lost to them, and Dallas-Fort Worth gained ~46,400.5 Both metros lost a few thousand residents on net to the rest of Texas, as some households moved to smaller nearby counties and to Austin and San Antonio.
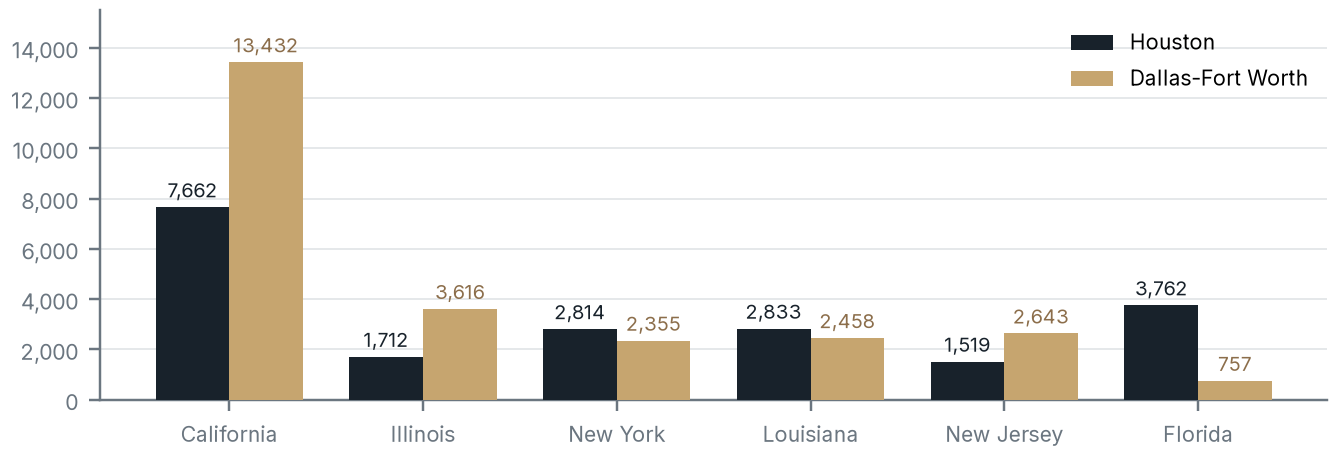
Chart Summary and Key Values
Grouped bar chart of net in-migration by origin state
Source: IRS Statistics of Income, County-to-County Migration Data, 2022 to 2023.
California is by far the largest source for both metros, adding ~13,400 people on net to Dallas-Fort Worth and ~7,700 to Houston, with Los Angeles County alone the top origin county for each. Dallas-Fort Worth also draws heavily from Illinois, New Jersey and New York, while Houston's next-largest sources are Florida, Louisiana and New York. The movers bring income: in Dallas-Fort Worth, households moving in from other states reported average adjusted gross income of ~$91,600 per return, compared with ~$87,600 for those leaving, while Houston's in-movers averaged ~$83,500.
The largest single sources are big metro counties on the coasts and in the Midwest and Southwest:
| Rank | Houston: top origin counties (people moving in) | Dallas-Fort Worth: top origin counties (people moving in) |
|---|---|---|
| 1 | Los Angeles County, CA: 4,252 | Los Angeles County, CA: 6,310 |
| 2 | Cook County, IL (Chicago): 2,558 | Maricopa County, AZ (Phoenix): 3,738 |
| 3 | Miami-Dade County, FL: 2,489 | Cook County, IL (Chicago): 3,661 |
| 4 | San Diego County, CA: 2,075 | San Diego County, CA: 3,172 |
| 5 | Maricopa County, AZ (Phoenix): 1,898 | Orange County, CA: 3,039 |
Table Summary and Key Values
Column headings: Rank, Houston: top origin counties (people moving in), Dallas-Fort Worth: top origin counties (people moving in).
These are gross inflows of people on tax returns from outside Texas, 2022 to 2023 filing years, not net of moves in the other direction.

Where in the metros people are moving
The county figures show two different patterns inside each metro. The core counties, Harris in Houston and Dallas in Dallas-Fort Worth, lost residents to domestic migration from 2021 to 2025 as households moved to the suburbs and beyond, but they gained even more from international migration. The fast-growing suburban counties gained mostly from domestic movers.6 The IRS data look different because they count only moves across state lines: Harris County gained 8,955 more tax filers from other states than it lost to them, the third-largest net interstate gain of any U.S. county after New York County (Manhattan) and Maricopa County, according to a Tax Foundation analysis.7 The Census domestic figure also counts moves within Texas, including the many households that leave Harris for suburban Texas counties.
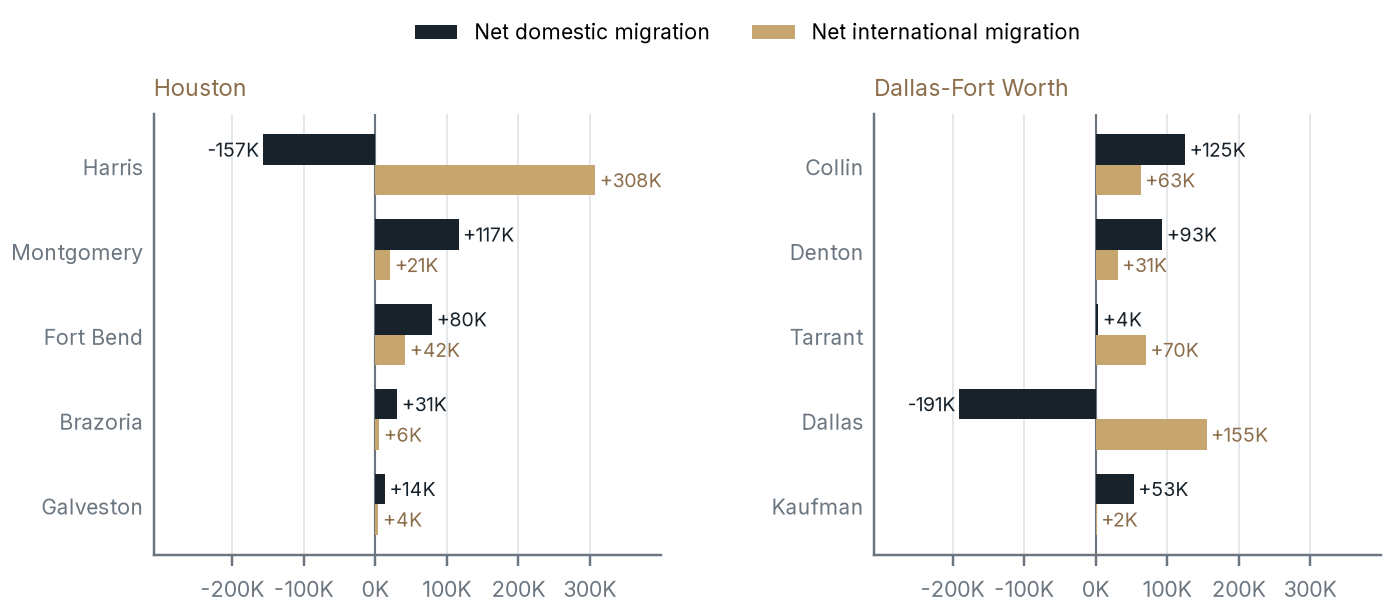
Chart Summary and Key Values
Bar charts of net domestic and international migration by county
Source: U.S. Census Bureau, Vintage 2025 Population Estimates, county components of change.
Measured from the Census Bureau's April 2020 estimates base to July 2025, Montgomery County grew by 25.9%, to ~781,000 residents, and Fort Bend County by ~18%, to ~975,000. In Dallas-Fort Worth, Collin County added ~231,000 residents (+22%) and Denton County ~163,000 (+18%), while smaller counties on the edge of the metro, such as Kaufman (+44%) and Rockwall (+30%), grew fastest in percentage terms. Harris County still added the most residents of any county in either metro, ~315,000, almost entirely through international migration and natural increase.
For apartment demand, both patterns count. International arrivals tend to rent at first and often settle in the core counties. Domestic movers to the suburbs include many families who buy, but also young professionals and households who rent near suburban job centers in areas such as The Woodlands, the Energy Corridor, Frisco and Plano.
Young adults: the renter-age cohort
Migration matters for apartments because movers are disproportionately young. In the 2025 ACS, people aged 20 to 34 made up 42.7% of those who moved to the Houston metro from another state in the past year and 40.3% in Dallas-Fort Worth, about twice their 21% to 22% share of the population.8

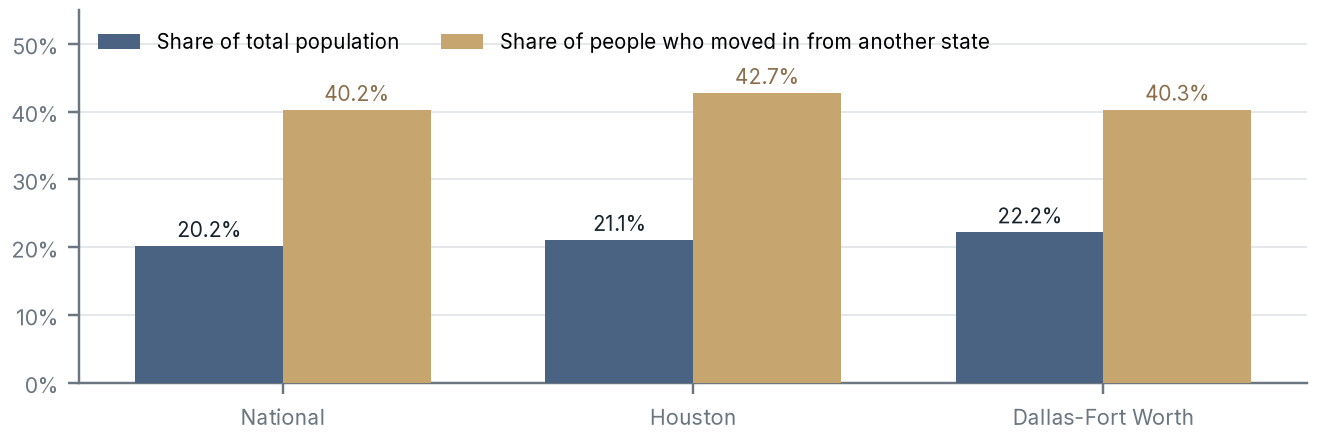
Chart Summary and Key Values
Bar chart comparing the 20 to 34 share of population and of movers from other states
Source: U.S. Census Bureau, American Community Survey 1-year estimates, Tables B01001 and B07001.
That inflow has grown the 20-to-34 population far faster than the nation's. From 2021 to 2025, the population aged 20 to 34 grew by 11.0% in Houston (~165,000 people) and 14.3% in Dallas-Fort Worth (~235,000), compared with 3.7% nationally.9
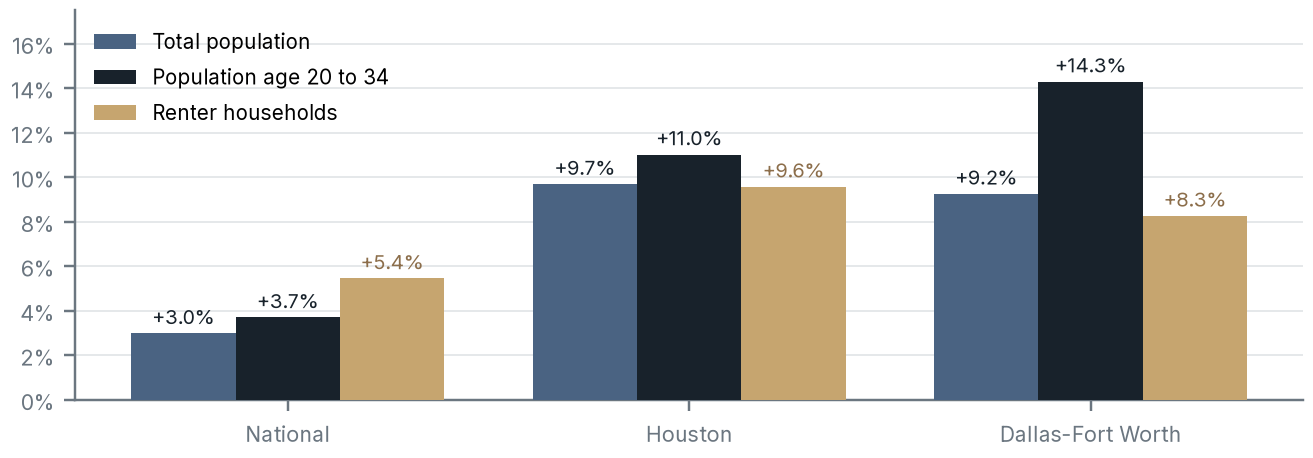
Chart Summary and Key Values
Grouped bar chart of growth in population, young adults and renter households
Source: U.S. Census Bureau, American Community Survey 1-year estimates, Tables B01001 and B25003.
Renter household growth
Young adults are the most likely to rent, and in both metros more than 70% of householders under 35 rent, compared with 65.5% nationally. Overall, 38.9% of Houston households and 40.3% of Dallas-Fort Worth households rent, compared with 34.7% nationally.10
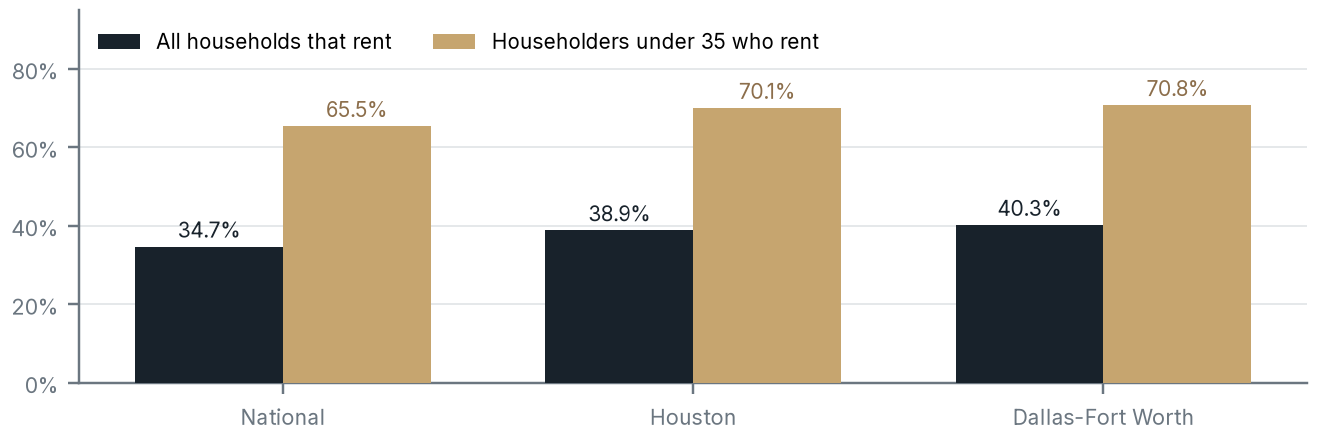
Chart Summary and Key Values
Bar chart of renter shares: national, Houston and Dallas-Fort Worth
Source: U.S. Census Bureau, American Community Survey 1-year estimates, Tables B25003 and B25007.
The combination of more people, a younger mix and higher renter shares produced strong renter household growth. From 2021 to 2025, renter households rose by ~95,900 in Houston (+9.6%) and ~94,100 in Dallas-Fort Worth (+8.3%), compared with +5.4% nationally, an average of roughly 24,000 a year in each metro.11 Renters accounted for ~43% of Houston's household growth and ~41% of Dallas-Fort Worth's, more than their share of existing households.
Nationally, the Census Bureau's Housing Vacancy Survey counted ~46.3 million renter-occupied units in the third quarter of 2026, ~3.0 million more than at the end of 2019, with the homeownership rate at 65.5%.12 Quarterly figures move around, and the count was ~46.8 million in the second quarter, but the trend since 2021 has been up.


Demand drivers at a glance
| Measure | National | Houston | Dallas-Fort Worth |
|---|---|---|---|
| Population change, July 2024 to July 2025 (Census) | +0.5% | +1.6% | +1.5% |
| Age 20 to 34 population, change 2021 to 2025 (ACS) | +3.7% | +11.0% | +14.3% |
| Share of out-of-state movers aged 20 to 34, 2025 (ACS) | 40.2% | 42.7% | 40.3% |
| Renter households, change 2021 to 2025 (ACS) | +5.4% | +9.6% | +8.3% |
| Householders under 35 who rent, 2025 (ACS) | 65.5% | 70.1% | 70.8% |
| Nonfarm jobs, change February 2020 to September 2026 (BLS, seasonally adjusted) | +4.5% | +9.2% | +13.5% |
| New residents per housing unit permitted, 2025 (Census) | 1.24 | 1.94 | 1.90 |
Table Summary and Key Values
Column headings: Measure, National, Houston, Dallas-Fort Worth.
Jobs: the engine behind the moves
People follow jobs. Measured from February 2020, just before the pandemic, Dallas-Fort Worth had added ~519,000 nonfarm jobs by September 2026 (seasonally adjusted), up 13.5%, and Houston ~294,000, up 9.2%, compared with 4.5% nationally.13 These figures differ slightly from our Houston Multifamily Development Outlook, which used the August release from Workforce Solutions and showed Houston up 9.7%.
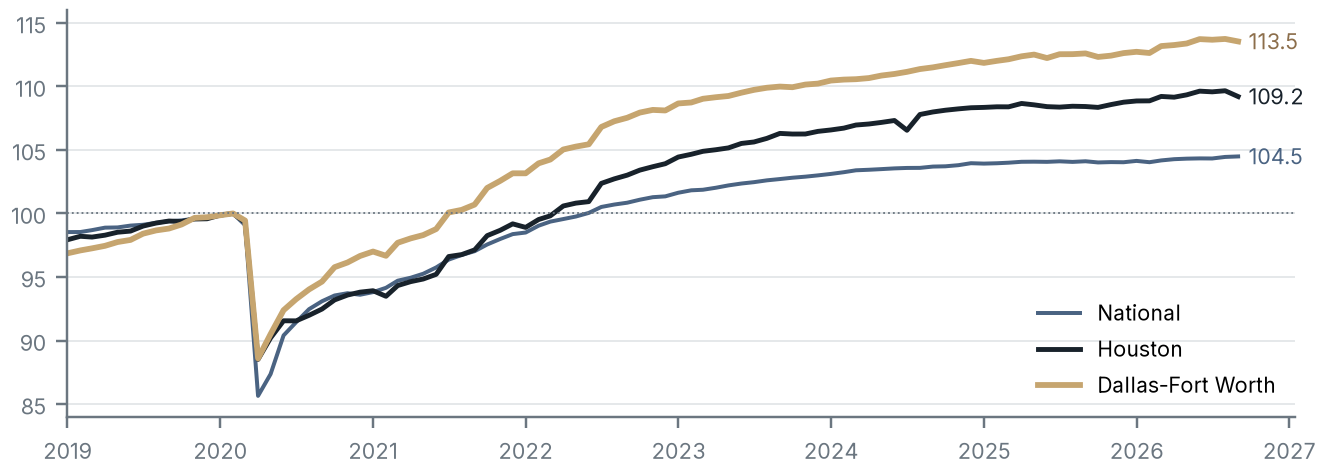
Chart Summary and Key Values
Line chart of job growth indexed to February 2020
Sources: U.S. Bureau of Labor Statistics, Current Employment Statistics (state and area, and national).
Job growth has slowed. In September 2026, Dallas-Fort Worth had ~43,900 more jobs than a year earlier (+1.0%, not seasonally adjusted) and Houston ~33,600 more (+1.0%).14 Not seasonally adjusted, unemployment rates were 4.1% in Dallas-Fort Worth, 4.6% in Houston and 4.0% nationally.15
What forecasters expect
Forecasts point to continued, if slower, job growth:
- The Federal Reserve Bank of Dallas expects Texas employment to grow 0.9% in 2026 (with a range of 0.6% to 1.2%), or ~134,000 jobs, below the state's long-run average of ~2%.16
- The Greater Houston Partnership forecast in December 2025 that the Houston region would add ~30,900 jobs in 2026.17
Taken together with the BLS data, these suggest job gains of ~1% a year in both metros in the near term: enough to keep adding renter households, but at a slower pace than in 2022 and 2023.
Jobs, people and permits
A common way to gauge whether a market is adding housing faster than demand is to compare new jobs with new housing permits. There is no fixed benchmark for a balanced market, but the 2015 to 2019 averages, before the pandemic distorted both series, provide a useful baseline.
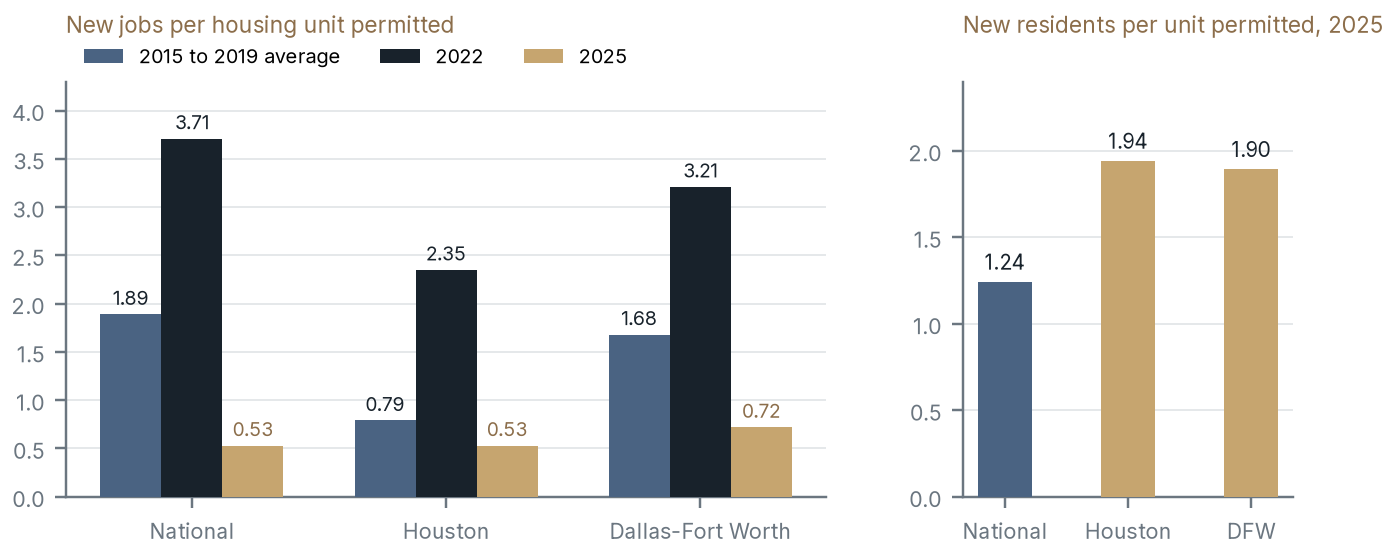
Chart Summary and Key Values
Bar charts of jobs and new residents per housing unit permitted
Sources: U.S. Bureau of Labor Statistics, Current Employment Statistics; U.S. Census Bureau, Building Permits Survey and Vintage 2025 Population Estimates; Ascendant Development calculations.
The ratios tell a mixed story, and we think it is worth reading closely. In 2022, job growth far outpaced permitting, with 2.35 new jobs per permitted unit in Houston and 3.21 in Dallas-Fort Worth. By 2025, job growth had slowed while permits stayed relatively high, and the ratios fell to 0.53 in Houston and 0.72 in Dallas-Fort Worth, below their 2015 to 2019 averages of 0.79 and 1.68.18 On that measure alone, the two metros were permitting more housing than job growth required in 2025.
Population growth points the same way, but less sharply. Each metro added ~1.9 residents per permitted unit in 2025, versus ~1.2 nationally. At ~2.8 people per household, that is about two-thirds of a household per permitted unit, compared with roughly half nationally. Some permitted units also replace older housing that is demolished or becomes obsolete. Permits have also continued to fall: total permits in the 12 months through August 2026 were ~60,200 in Houston and ~62,100 in Dallas-Fort Worth, down ~21% and ~20% from 2022, and permits for buildings with five or more units were ~13,800 and ~22,500.19
We read this as a watch item rather than a warning. The jobs-to-permits ratios argue against assuming the rapid rent growth of 2021 and 2022 will come back soon, and they favor sites with a clear edge in location and product. At the same time, falling permits and steady population growth point toward a tighter balance once the current wave of completions is absorbed.
Demand is showing up in leasing
Leasing data from apartment-market trackers show demand absorbing the record supply of 2024 and 2025. Cushman & Wakefield reported Houston net absorption for the first three quarters of 2026 up 68.4% from a year earlier, Matthews reported Dallas-Fort Worth absorbing 6,736 units in the third quarter, nearly double the 3,447 a year earlier, and RealPage reported national apartment occupancy of 95.4% in the third quarter of 2026.20 The Census Bureau's national rental vacancy rate rose to 7.6% in the same quarter, from 7.1% a year earlier, but the two measures cover different stock: the Census figure includes all rental units, including single-family houses and small buildings, while RealPage tracks professionally managed apartments.12 Rents have not yet followed: Matthews reported effective rents down 1.0% year over year in the second quarter of 2026 in both Dallas-Fort Worth ($1,480 a unit) and Houston ($1,327), while Northmarq reported Class A asking rents up 2.2% in Dallas-Fort Worth and 1.4% in Houston.21

Looking ahead: the long-run base
The Texas Demographic Center's 2024 projections, using its mid-range migration scenario, show the 10-county Houston area, the same counties the Census Bureau uses for the Houston-Pasadena-The Woodlands metro, reaching ~8.47 million residents by 2030 and ~9.58 million by 2040, and the 11-county Dallas-Fort Worth area reaching ~9.06 million and ~10.19 million.22 That implies average growth of roughly 110,000 to 115,000 residents a year in each area through 2040, somewhat below the 2025 pace.
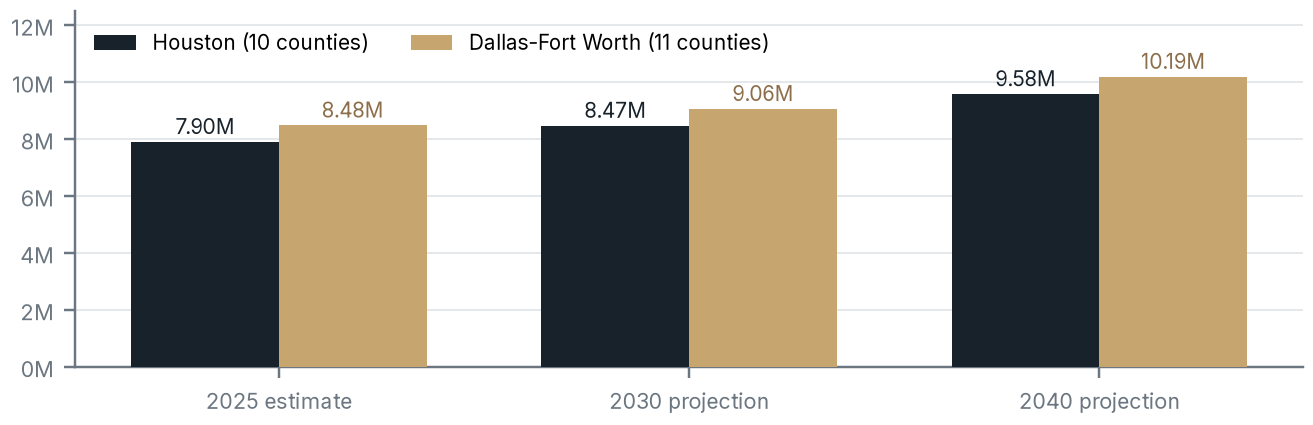
Chart Summary and Key Values
Grouped bar chart of population estimates and projections
Sources: U.S. Census Bureau, Vintage 2025 Population Estimates; Texas Demographic Center.
Projections are not forecasts of any single year, and they depend on migration assumptions that can change quickly, as 2025 showed. But they suggest that the two metros will keep adding residents at a scale few other U.S. metros can match.
What this means for development
Four points follow from the data.
First, the demand base is broad. Houston and Dallas-Fort Worth draw residents from across the country and from abroad, and they grow by ~48,000 to ~51,000 a year through natural increase alone. A slowdown in any one source reduces growth but does not end it.
Second, the renter pool is young and growing. Movers skew toward ages 20 to 34, and more than 70% of householders under 35 in both metros rent. Communities near job centers, with the amenities and unit sizes young professionals want, are best placed to capture that demand. The pool is also growing at the other end, as families who might once have bought rent longer and look for more space, a segment served by garden-style and Build-to-Rent communities, covered in What Is Build-to-Rent? A Guide for Multifamily Investors.
Third, plan on today's pace, not the peak. Population growth in 2025 and job growth in 2026 are both slower than in 2022 to 2024, and the jobs-to-permits ratios have fallen below pre-pandemic norms. Underwriting should assume current rents and absorption rather than a quick rebound to the earlier surge.
Fourth, timing still matters. Permits continue to fall while the population keeps growing, so a project that starts in the next 12 to 18 months would typically deliver into a market with fewer new completions than today.
The bottom line
Houston and Dallas-Fort Worth have led the nation in population growth, drawing young adults from other states and abroad who are more likely than average to rent. Each metro added ~24,000 renter households a year from 2021 to 2025, supported by job growth well above the national pace since 2020. The surge has cooled: international migration fell sharply in 2025 and may fall further in 2026, domestic moves slowed, and job growth is running ~1% a year. But steady natural increase, continued in-migration and falling permits suggest that demand for new apartments in both metros rests on a durable base.
Sources
- U.S. Census Bureau, Vintage 2025 Population Estimates, Metropolitan and Micropolitan Statistical Areas: Population and Components of Change, https://www2.census.gov/programs-surveys/popest/datasets/2020-2025/metro/totals/cbsa-est2025-alldata.csv ↩
- U.S. Census Bureau, Vintage 2025 Population Estimates, components of change (see note 1). ↩
- U.S. Census Bureau, Vintage 2025 Population Estimates, metro areas (see note 1) and national and state totals, https://www2.census.gov/programs-surveys/popest/datasets/2020-2025/state/totals/NST-EST2025-ALLDATA.csv ↩
- U.S. Census Bureau, "U.S. Population Growth Slows Due to Historic Decline in Net International Migration", January 27, 2026, https://www.census.gov/newsroom/press-releases/2026/population-growth-slows.html ↩
- Internal Revenue Service, Statistics of Income, U.S. Population Migration Data, 2022 to 2023, county-to-county inflow and outflow files (number of individuals), https://www.irs.gov/statistics/soi-tax-stats-migration-data-2022-2023 ↩
- U.S. Census Bureau, Vintage 2025 Population Estimates, county population and components of change for the Houston and Dallas-Fort Worth metros (see note 1). ↩
- Tax Foundation, "State Migration Trends: Taxes & State Population: IRS Data", April 2026, analysis of IRS Statistics of Income migration data for 2022 to 2023, https://taxfoundation.org/data/all/state/state-migration-trends-map-americans-moving-population-changes/ ↩
- U.S. Census Bureau, American Community Survey 2025 1-year estimates, Table B07001, Geographical Mobility in the Past Year by Age, https://www2.census.gov/programs-surveys/acs/summary_file/2025/table-based-SF/data/1YRData/acsdt1y2025-b07001.dat ↩
- U.S. Census Bureau, American Community Survey 1-year estimates, 2021 and 2025, Table B01001, Sex by Age, https://www2.census.gov/programs-surveys/acs/summary_file/2025/table-based-SF/data/1YRData/acsdt1y2025-b01001.dat ↩
- U.S. Census Bureau, American Community Survey 2025 1-year estimates, Tables B25003, Tenure, and B25007, Tenure by Age of Householder, https://www2.census.gov/programs-surveys/acs/summary_file/2025/table-based-SF/data/1YRData/acsdt1y2025-b25007.dat ↩
- U.S. Census Bureau, American Community Survey 1-year estimates, 2021 and 2025, Table B25003, Tenure, https://www2.census.gov/programs-surveys/acs/summary_file/2025/table-based-SF/data/1YRData/acsdt1y2025-b25003.dat ↩
- U.S. Census Bureau, Quarterly Residential Vacancies and Homeownership, Third Quarter 2026, October 28, 2026, https://www.census.gov/housing/hvs/current/index.html ↩
- U.S. Bureau of Labor Statistics, Current Employment Statistics, total nonfarm employment, seasonally adjusted: Houston-Pasadena-The Woodlands (SMS48264200000000001), Dallas-Fort Worth-Arlington (SMS48191000000000001) and United States (CES0000000001), https://data.bls.gov/timeseries/SMS48264200000000001; https://data.bls.gov/timeseries/SMS48191000000000001;, https://data.bls.gov/timeseries/CES0000000001 ↩
- U.S. Bureau of Labor Statistics, Current Employment Statistics, total nonfarm employment, not seasonally adjusted (SMU48264200000000001 and SMU48191000000000001), https://data.bls.gov/timeseries/SMU48264200000000001;, https://data.bls.gov/timeseries/SMU48191000000000001 ↩
- U.S. Bureau of Labor Statistics, Local Area Unemployment Statistics, unemployment rates, not seasonally adjusted, September 2026: Houston-Pasadena-The Woodlands (LAUMT482642000000003) and Dallas-Fort Worth-Arlington (LAUMT481910000000003), https://data.bls.gov/timeseries/LAUMT482642000000003; https://data.bls.gov/timeseries/LAUMT481910000000003; national rate (LNU04000000), https://data.bls.gov/timeseries/LNU04000000 ↩
- Federal Reserve Bank of Dallas, Texas Employment Forecast, October 19, 2026, https://www.dallasfed.org/research/forecast/2026/emp261019 ↩
- Greater Houston Partnership, Houston Region Economic Outlook, December 2025, https://wpb.houston.org/app/uploads/2025/12/2025-Houston-Region-Economic-Outlook.pdf ↩
- U.S. Bureau of Labor Statistics, Current Employment Statistics (see notes 13 and 14), annual averages; U.S. Census Bureau, Building Permits Survey, annual metropolitan and national totals, 2015 to 2025, https://www2.census.gov/econ/bps/; Ascendant Development calculations. ↩
- U.S. Census Bureau, Building Permits Survey, metropolitan area year-to-date files for August 2025 and August 2026 and annual files for 2022 and 2025, https://www2.census.gov/econ/bps/CBSA%20(beginning%20Jan%202024)/ ↩
- Cushman & Wakefield, MarketBeat Houston Multifamily Q3 2026, https://www.cushmanwakefield.com/en/united-states/insights/us-marketbeats/houston-marketbeats/multifamily; Matthews, "Dallas-Fort Worth, TX Multifamily Market Report Q3 2026", October 26, 2026, https://www.matthews.com/insights/dallas-fort-worth-multifamily-market-report-q3-2026; RealPage, "3Q 2026 U.S. Apartment Demand Update", https://www.realpage.com/analytics/3q-2026-us-data-update/ ↩
- Matthews, "Dallas-Fort Worth, TX Multifamily Market Report Q2 2026", August 13, 2026, https://www.matthews.com/insights/dallas-fort-worth-multifamily-market-report-q2-2026; Matthews, "Houston, TX Multifamily Market Report Q2 2026", August 12, 2026, https://www.matthews.com/insights/houston-multifamily-q2-2026; Northmarq, Dallas-Fort Worth and Houston Multifamily Market Insights, Q2 2026, https://www.northmarq.com/sites/default/files/docs/NMMarketInsights-Q22026-Dallas.pdf;, https://www.northmarq.com/sites/default/files/docs/NMMarketInsights-Q22026-Houston.pdf ↩
- Texas Demographic Center, Texas Population Projections Program, Vintage 2024, county projections, mid-range migration scenario, https://www.demographics.texas.gov/Projections/ ↩
Important disclosures
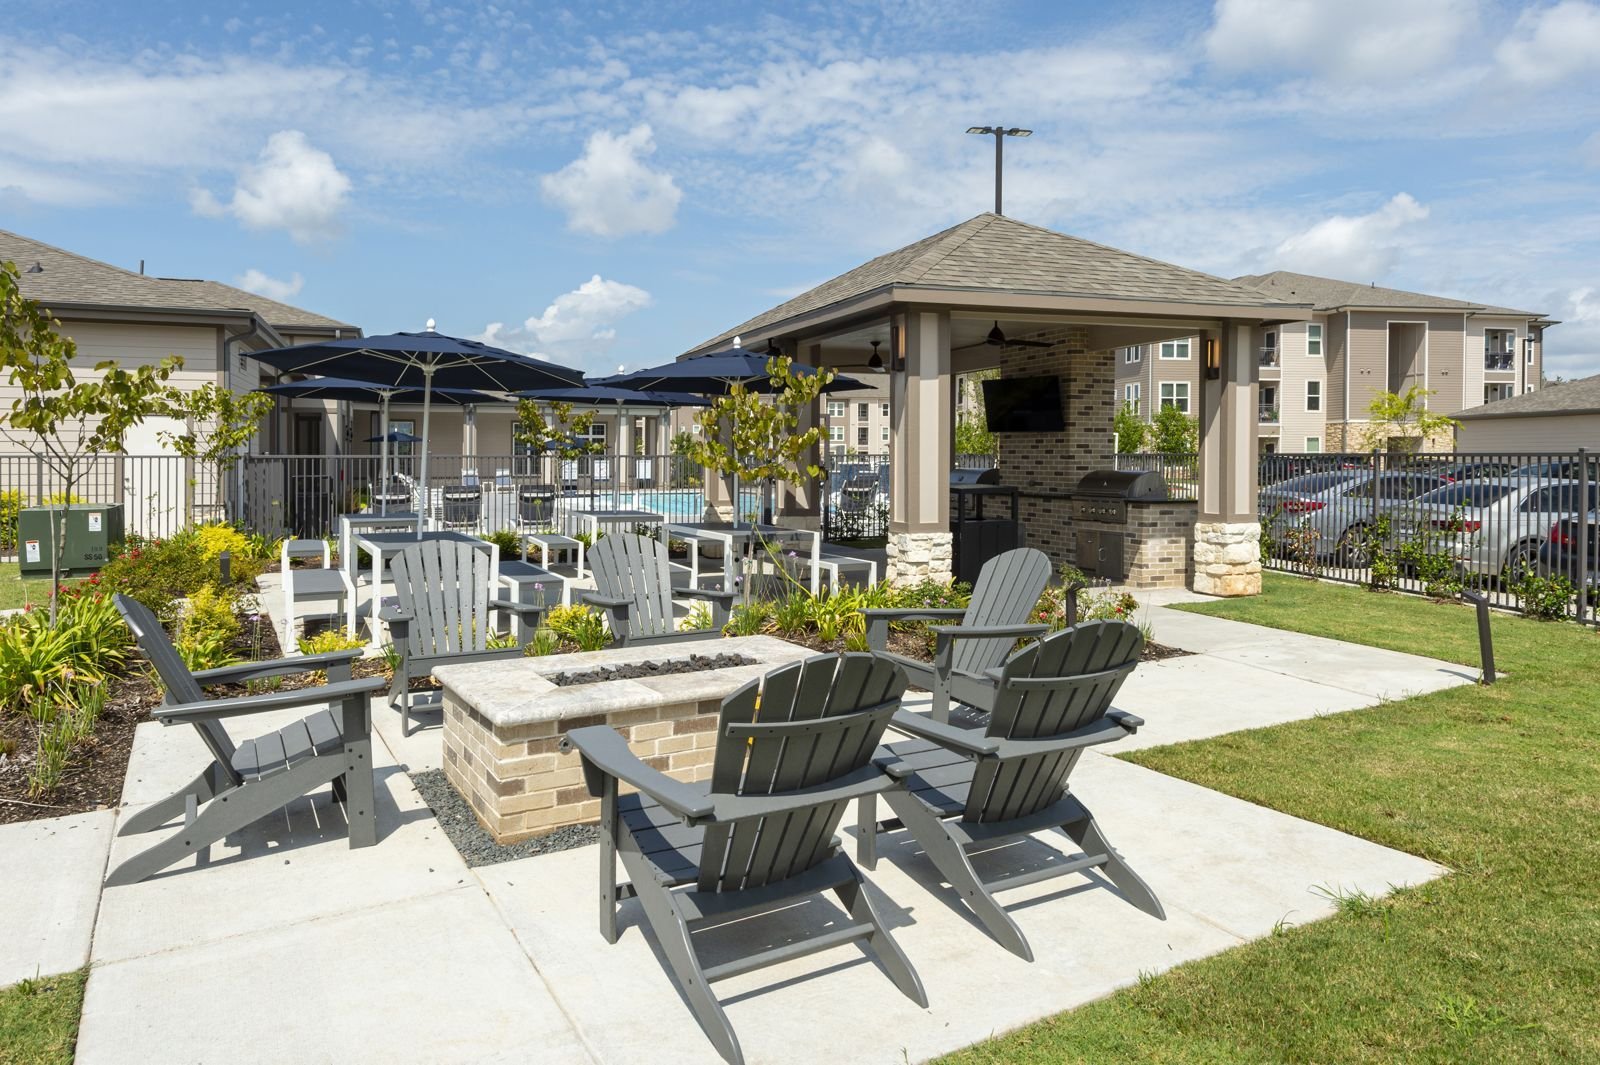
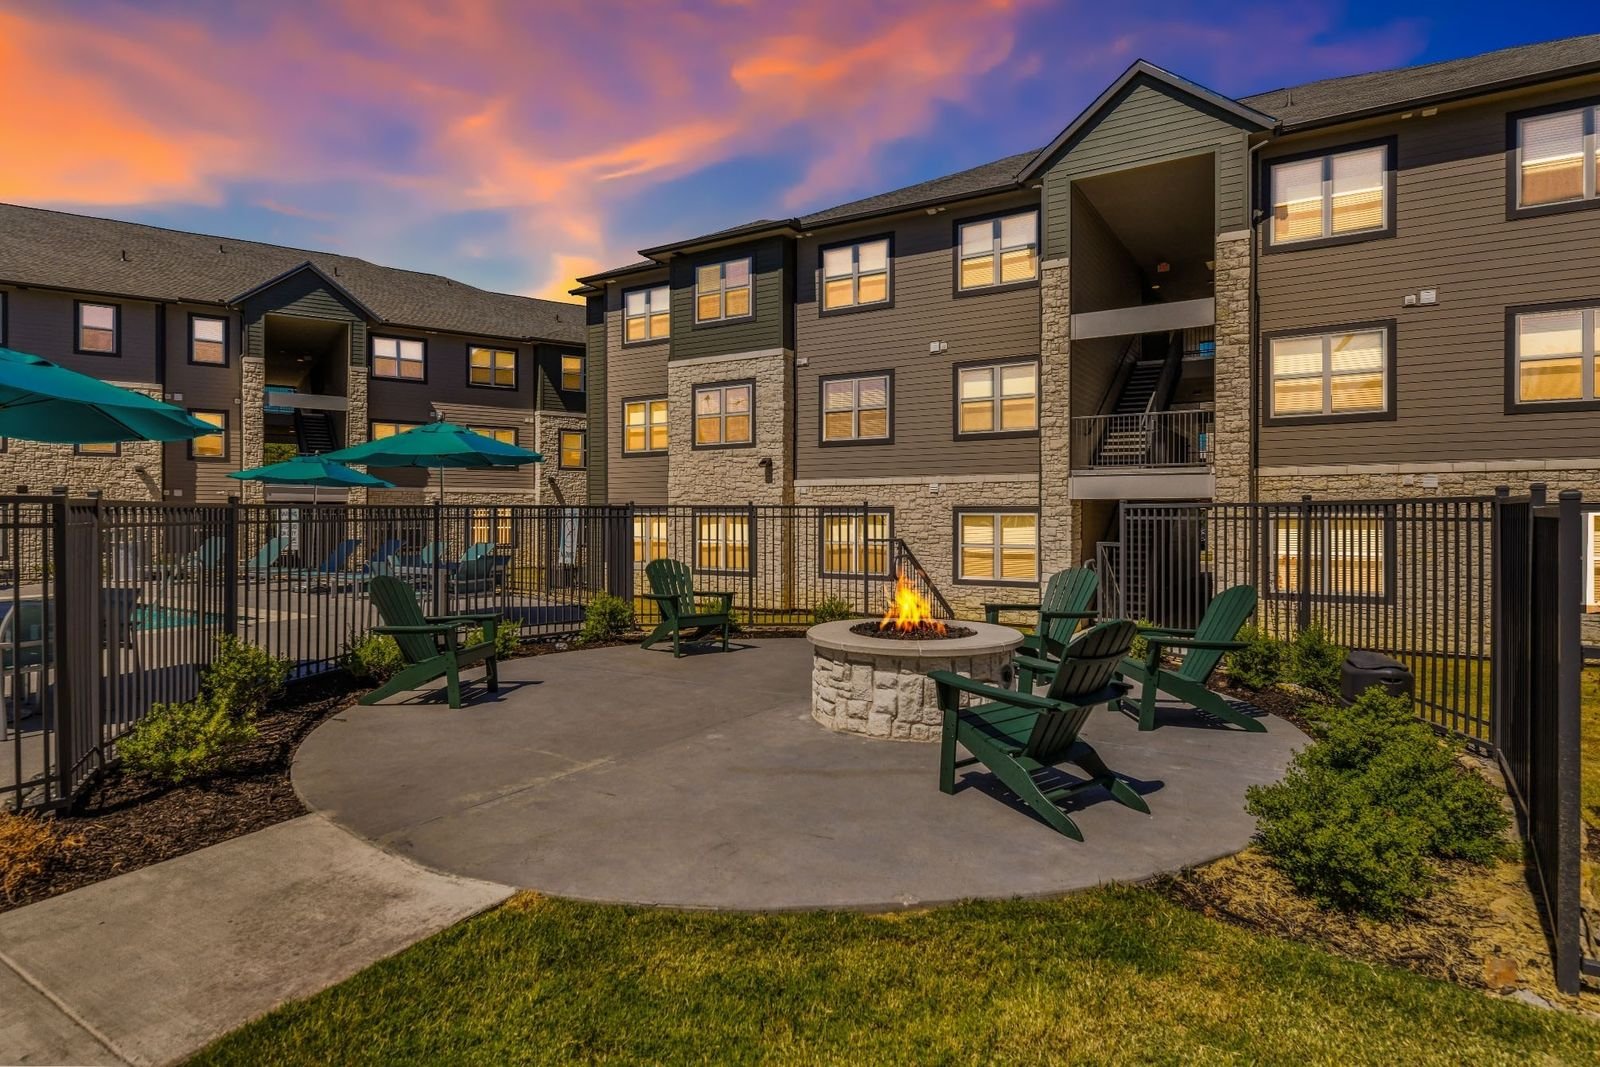
This article is for educational purposes only and is not an offer to sell or a solicitation of an offer to buy any security. Any offering by Ascendant Development or its affiliates is made only to verified accredited investors under Rule 506(c) of Regulation D through definitive offering documents, which should be read in full, including the risk factors. Real estate development involves risk, including the possible loss of principal, and is illiquid. Nothing here is tax, legal or investment advice; consult your own advisors. Forward-looking statements are not guarantees. Hypothetical examples are for illustration only and are not projections or the terms of any offering. Photographs show completed or existing Ascendant projects. They are shown to illustrate the firm's work and do not represent any specific current offering.