

Key takeaways from the report
Houston added more residents than any other U.S. metro last year, and it is coming out of one of the largest apartment construction waves in its history.
For a development sponsor, what matters is less today's rents than the market a project will deliver into.
It is not an offer to sell, or a solicitation of an offer to buy, any security, and it contains no deal terms or return projections.
Executive summary
Houston added more residents than any other U.S. metro last year, and it is coming out of one of the largest apartment construction waves in its history. Houston delivered an average of roughly 17,800 units a year from 2019 to 2025, according to Newmark. Newmark projects 2026 construction starts about 60% below their 2022 peak, and it expects deliveries to fall to 7,927 units in 2027, 54% below the 10-year average.1 Renter demand has held up, led by Class A: Northmarq reports more than 6,500 units absorbed in Q2 2026 and the steepest quarterly drop in vacancy since 2021, with Class A vacancy falling to 8.1%, its first year-over-year decline since early 2023.2 Transwestern counts 4,604 of the quarter's 7,008 absorbed units in Class A properties.3
For a development sponsor, what matters is less today's rents than the market a project will deliver into. A community that breaks ground in late 2026 or 2027 would typically open in 2028 or later, after much of today's pipeline has leased up and when few competing projects are scheduled to open. This report covers the data behind that view: population and job growth, the major employment hubs, the suburban growth corridors (including Kingwood, Humble and the Lake Houston area northeast of Bush Intercontinental Airport), the construction pipeline, Houston's own history of rent rebounds after supply waves, and the rise of build-to- rent (BTR) communities. It also covers the real risks that can upend the thesis and how disciplined sponsors manage them.
What this report is and isn't. This is an educational market overview. It is not an offer to sell, or a solicitation of an offer to buy, any security, and it contains no deal terms or return projections. See the full disclosures at the end.
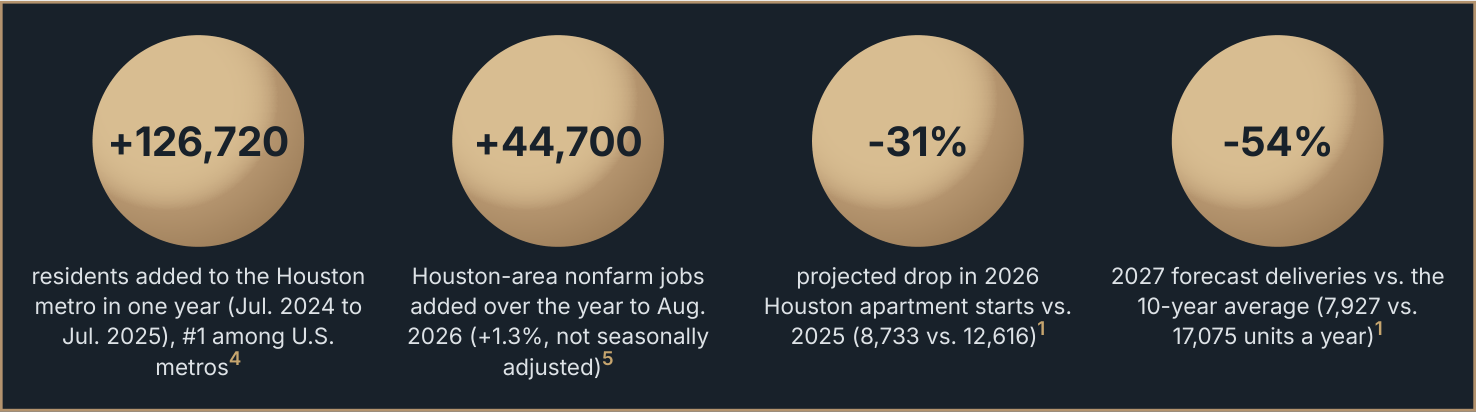
Chart Summary and Key Values
Houston added 126,720 metro residents from July 2024 to July 2025, first among U.S. metros (source 4). Houston-area nonfarm employment added 44,700 jobs over the year to August 2026, or 1.3%, not seasonally adjusted (source 5). The report projects a 31% drop in Houston apartment starts in 2026 versus 2025: 8,733 versus 12,616. Forecast deliveries in 2027 are 54% below the ten-year annual average: 7,927 versus 17,075 units (source 1).

1. Houston growth: people and paychecks
BOTTOM LINE Houston led every U.S. metro in population growth last year, and its job base keeps expanding, though at a slower pace than in recent years.
Population: the nation's #1 growth engine
The Houston metro added 126,720 residents between July 2024 and
126,720
July 2025 to reach 7,904,627, the largest numeric gain of any U.S. metro. Dallas-Fort Worth was second (+123,557).4 Most of that growth is
residents added to the Houston metro in one year, the most of any U.S. metro4
happening outside the urban core. Harris County added 48,695 residents in the year. Montgomery County, which borders Kingwood to the north, added 30,011, including 22,690 from net domestic migration, and Fort Bend County added 24,163.6
Jobs: still growing, at a more measured pace
Houston-area nonfarm employment reached 3,495,300 in August 2026, up 44,700 jobs (+1.3%) from a year earlier on a not-seasonally-adjusted basis (BLS/Texas Workforce Commission data). Seasonally adjusted employment is now about 9.7% above its February 2020 pre-pandemic level.5 After revisions, the Dallas Fed describes Houston's net job growth as "anemic," at 0.5% (17,500 jobs) year over year through July 2026, though payrolls grew at a 2.1% annualized pace from April to July, led by construction.7 The area's unemployment rate was 5.0% in August, above the Texas (4.6%) and U.S. (4.3%) rates.5
Looking ahead, the Greater Houston Partnership forecasts 30,900 new
3.5M
jobs in 2026, below the region's recent average of about 50,000 a year, with the region reaching a record 3.5 million jobs. Health care and social
jobs the Greater Houston Partnership expects the region to reach in 2026, a record8
assistance are expected to drive nearly half of the gain (about 14,000 jobs), while sectors tied to upstream oil production are expected to contract.8 Northmarq forecasts 35,000 jobs in 2026.2
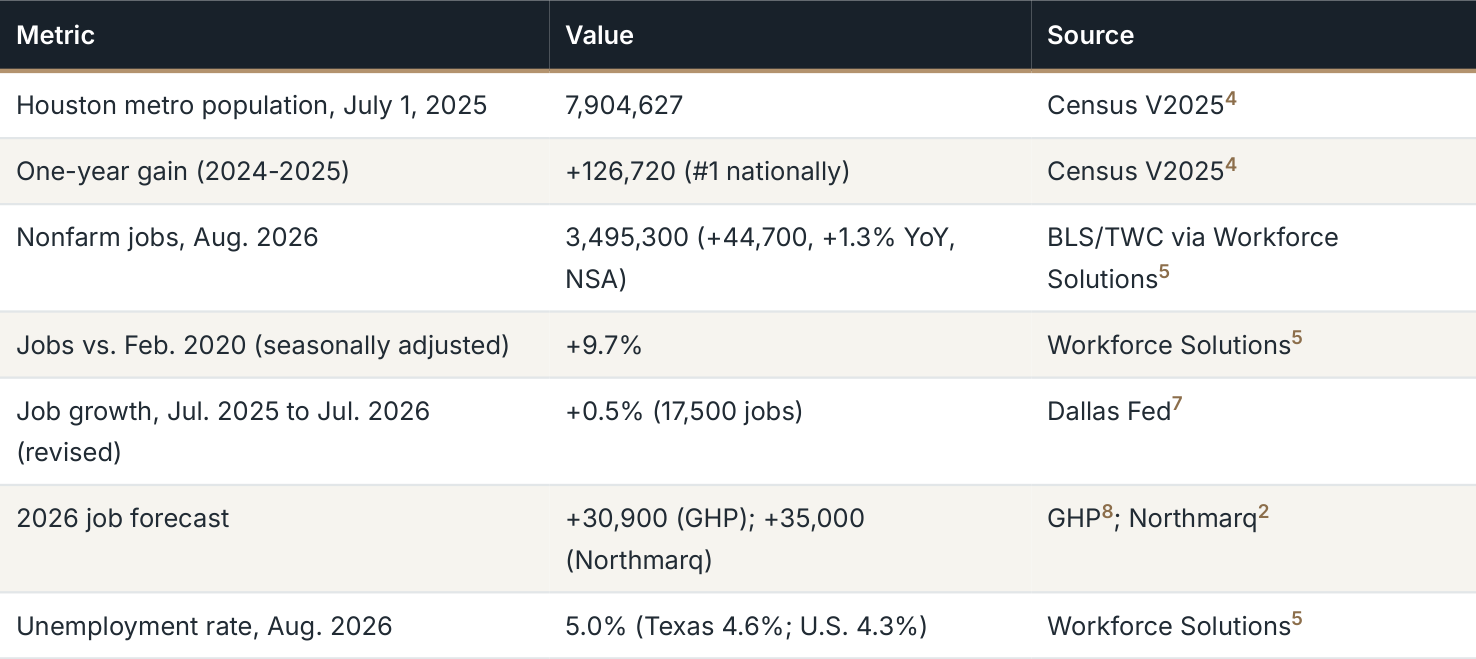
Table Summary and Key Values
| Metric | Value | Source |
|---|---|---|
| Houston metro population, July 1, 2025 | 7,904,627 | Census V20254 |
| One-year gain (2024-2025) | +126,720 (#1 nationally) | Census V20254 |
| Nonfarm jobs, Aug. 2026 | 3,495,300 (+44,700, +1.3% YoY, NSA) | BLS/TWC via Workforce Solutions5 |
| Jobs vs. Feb. 2020 (seasonally adjusted) | +9.7% | Workforce Solutions5 |
| Job growth, Jul. 2025 to Jul. 2026 (revised) | +0.5% (17,500 jobs) | Dallas Fed7 |
| 2026 job forecast | +30,900 (GHP); +35,000 (Northmarq) | GHP8; Northmarq2 |
| Unemployment rate, Aug. 2026 | 5.0% (Texas 4.6%; U.S. 4.3%) | Workforce Solutions5 |
2. The demand drivers: medicine, energy, trade and travel
BOTTOM LINE Houston's renter demand rests on a few world-scale anchors: the Texas Medical Center, the energy industry, Port Houston and Bush Intercontinental Airport.
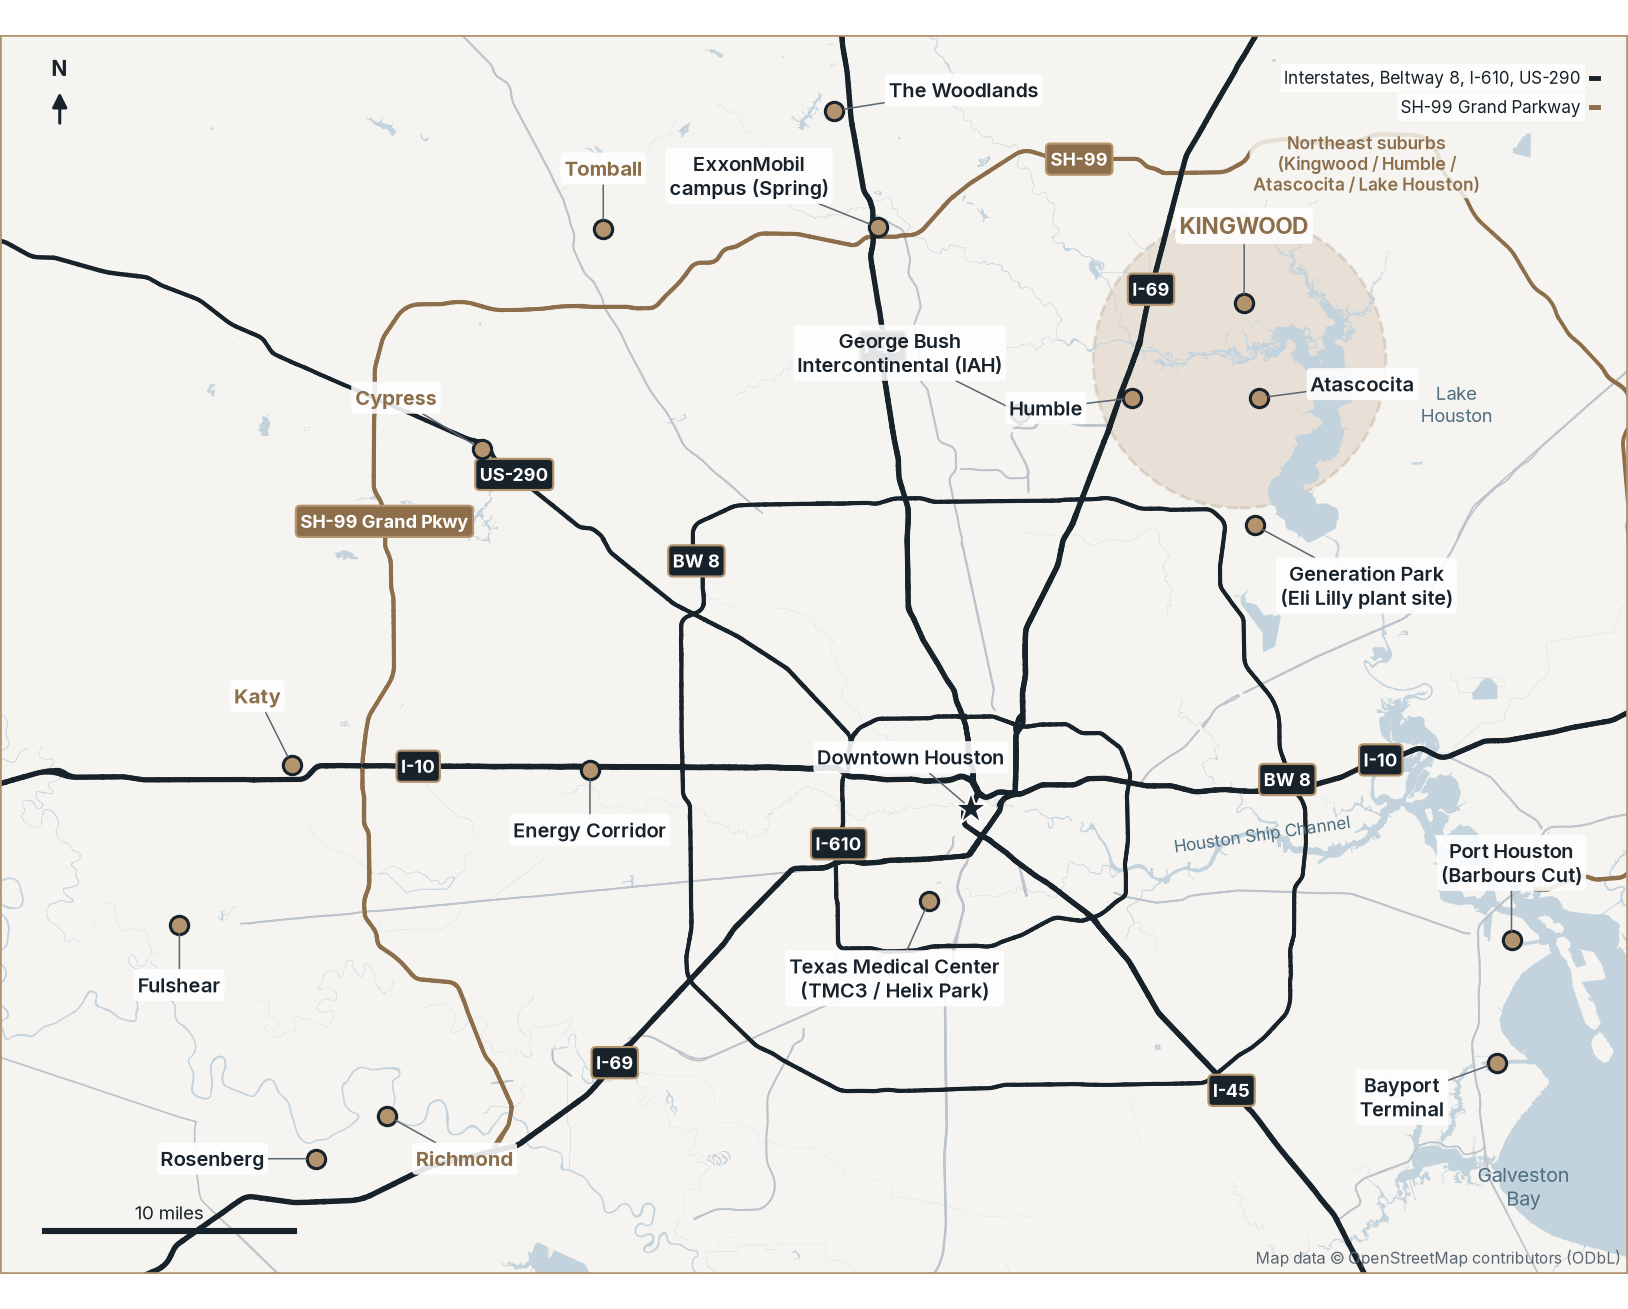
Chart Summary and Key Values
The Houston area map identifies downtown, the Energy Corridor, the Texas Medical Center, George Bush Intercontinental Airport, William P. Hobby Airport and the Port Houston terminals. It shows I-10, I-45, I-69/US-59, SH-99 Grand Parkway, Kingwood, Tomball, Conroe, Katy, Pearland and other surrounding communities. It is a location reference, not a return or travel-time forecast.
The northeast suburbs around Kingwood, Humble, Atascocita and Lake Houston have seen significant population and job growth and are
emblematic of suburban growth across the Houston MSA. Map data: © OpenStreetMap contributors (ODbL).9
Texas Medical Center and TMC3
The Texas Medical Center has more than 120,000 employees and about
120,000+
10 million patient encounters a year, according to TMC.10 In October 2023 it opened the 250,000-square-foot TMC3 Collaborative Building,
Texas Medical Center employees, with 10 million patient encounters a year10
the first building at Helix Park, a 37-acre life-science campus.11 Newmark reports that MD Anderson is adding a $239 million preclinical research facility at Helix Park scheduled to open in 2028, and that the campus is projected to support more than 23,000 permanent Harris County jobs at full build-out.1
Energy and the energy transition
Houston remains the center of the U.S. energy industry. Chevron moved its corporate headquarters from California to Houston effective January 1, 2025.12 Energy is also a source of volatility: GHP expects sectors tied to upstream oil production to shed jobs in 2026,8 and the Dallas Fed reports oil and gas employment down 1.1% year over year in July 2026.7 The region's industrial base is broadening. In Tomball, SEG Solar is expanding with a second plant expected to bring about 800 jobs,2 and in Generation Park northeast of downtown, Eli Lilly plans a $6.5 billion manufacturing facility with 615 permanent jobs averaging more than $100,000 a year and about 4,000 construction jobs, expected to be operational within five years.1
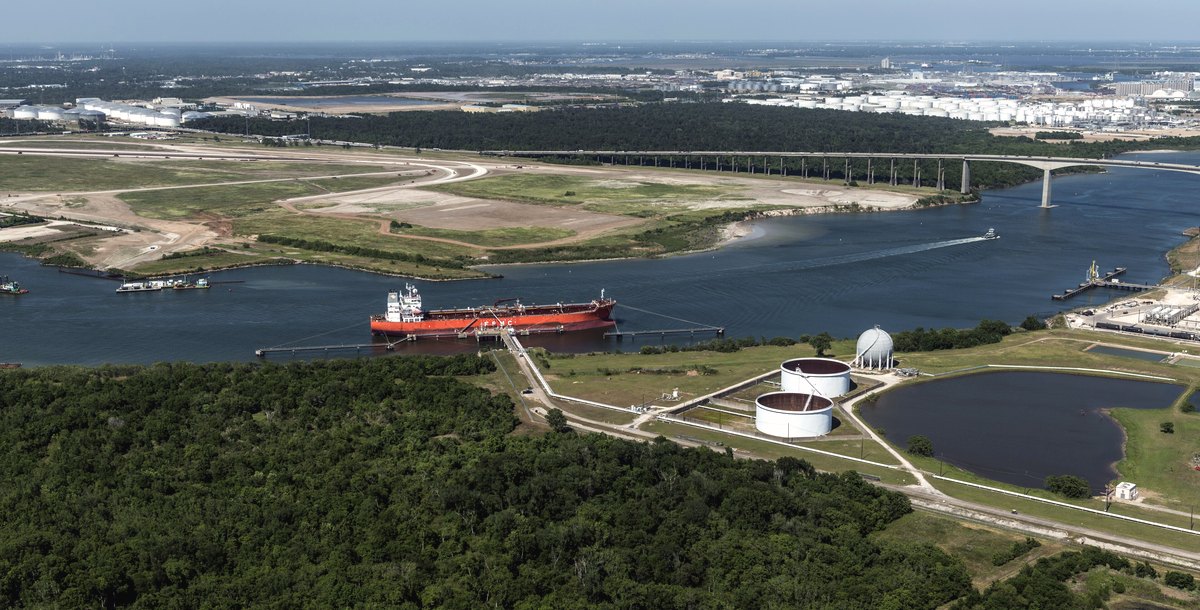

Library of Congress (public domain)
3.0, via Wikimedia Commons (cropped)
Port Houston and the Ship Channel
Port Houston handled a record 4,303,345 TEUs of containers in 2025
4.3M
(+4%) and 54.5 million short tons of cargo across its public terminals (+3%), its best year on record. The Houston Ship Channel, which
TEUs handled by Port Houston in 2025, a record13
includes more than 200 private and eight public terminals, is the nation's largest port for waterborne tonnage.13 Dallas Fed data show exports through the Houston-Galveston port district up 17.5% year over year in June 2026.7
Bush Intercontinental Airport (IAH)
Houston's airports served 62 million passengers in 2025, including 48 million at IAH. IAH set a record with 12.4 million international passengers (+2.5%).14 IAH's $1.46 billion Terminal Redevelopment Program was scheduled to wrap up in early 2026.15 IAH sits a short drive west of Humble and Kingwood, which makes the northeast suburbs a natural home for airport, logistics and Generation Park workers.
3. Where Houston is growing: the suburban ring
BOTTOM LINE Houston's growth is concentrated in its suburbs, and the northeast corridor around Kingwood, Humble and Lake Houston combines strong demographics with a pipeline that thins sharply after 2026.
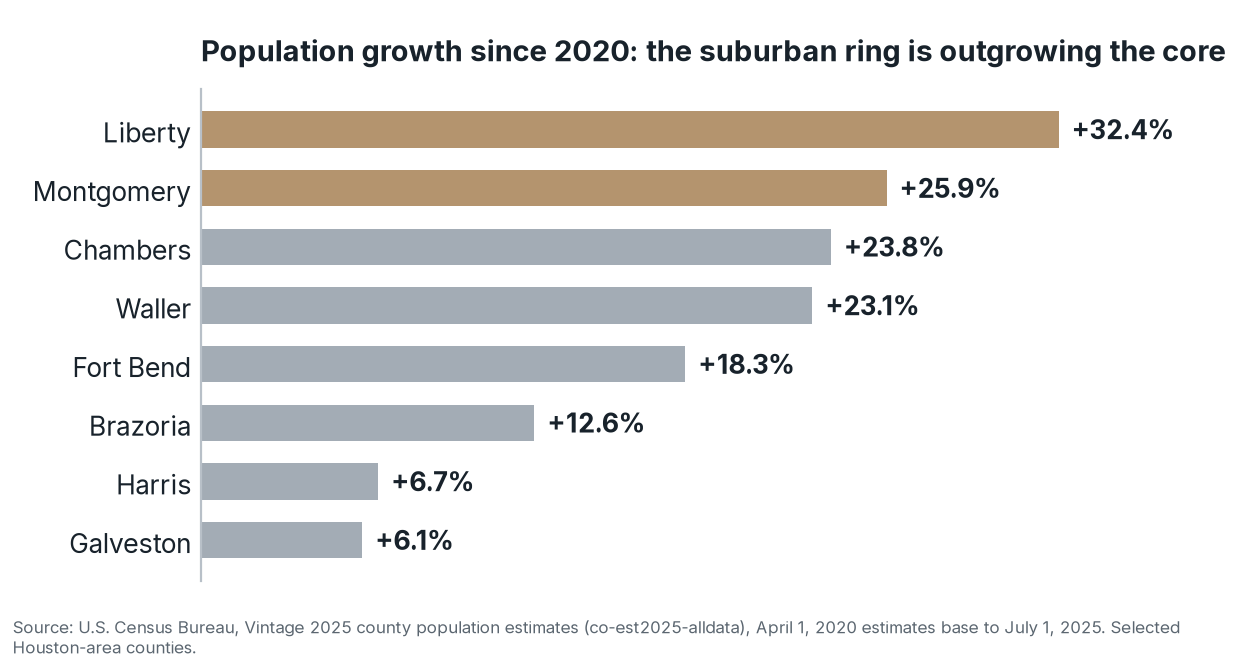
Chart Summary and Key Values
Population growth from the 2020 estimates base through July 2025: Liberty County +32.4%, Montgomery +25.9%, Chambers +23.8%, Waller +23.1%, Fort Bend +18.3%, Brazoria +12.6%, Harris +6.7% and Galveston +6.1%. These are selected Houston-area counties using Census Vintage 2025 estimates.
Population growth since April 2020, selected Houston-area counties.6
Every one of Houston's fastest-growing counties is suburban or
+25.9%
exurban. Liberty County (+32.4% since 2020) and Montgomery County (+25.9%) border the Kingwood and Lake Houston area; Fort Bend
Montgomery County population growth since 20206
County (+18.3%) anchors the southwest.6 Within those counties, the growth hot spots are well known:
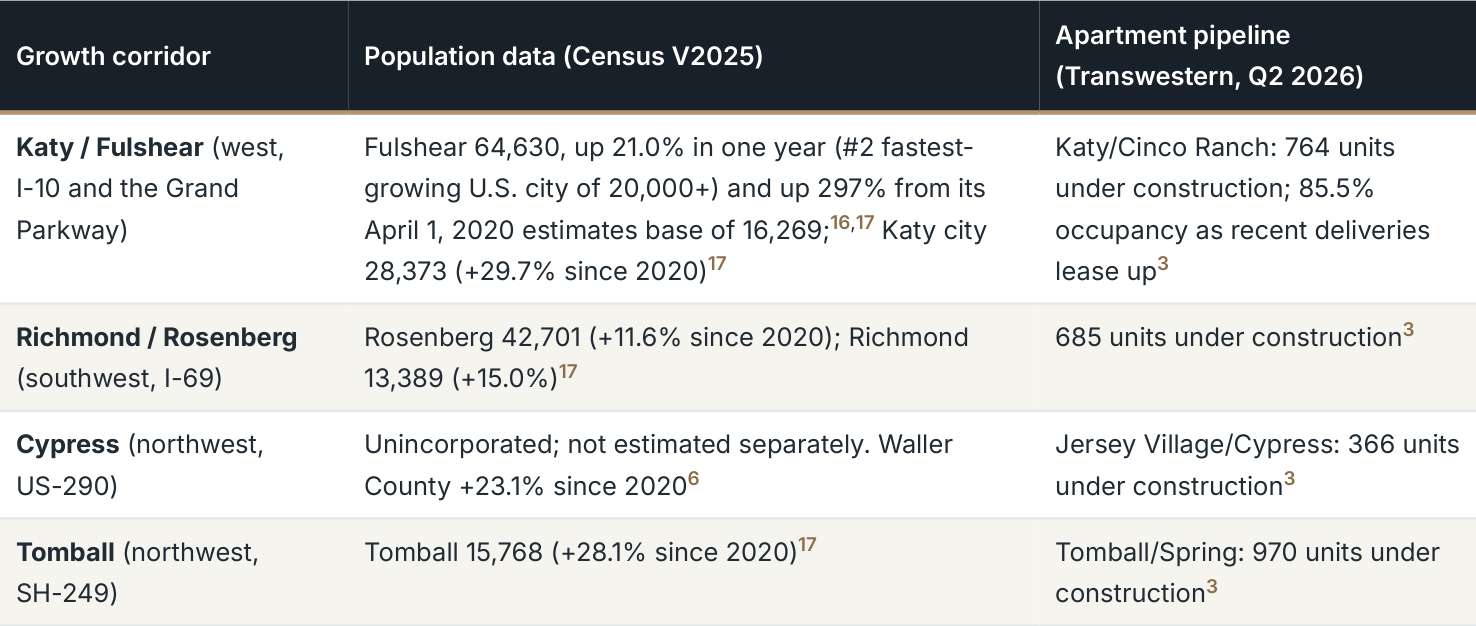
Table Summary and Key Values
| Growth corridor | Population data (Census V2025) | Apartment pipeline (Transwestern, Q2 2026) |
|---|---|---|
| Katy / Fulshear (west, I-10 and the Grand Parkway) | Fulshear 64,630, up 21.0% in one year (#2 fastest- growing U.S. city of 20,000+) and up 297% from its April 1, 2020 estimates base of 16,269;16,17 Katy city 28,373 (+29.7% since 2020)17 | Katy/Cinco Ranch: 764 units under construction; 85.5% occupancy as recent deliveries lease up3 |
| Richmond / Rosenberg (southwest, I-69) | Rosenberg 42,701 (+11.6% since 2020); Richmond 13,389 (+15.0%)17 | 685 units under construction3 |
| Cypress (northwest, US-290) | Unincorporated; not estimated separately. Waller County +23.1% since 20206 | Jersey Village/Cypress: 366 units under construction3 |
| Tomball (northwest, SH-249) | Tomball 15,768 (+28.1% since 2020)17 | Tomball/Spring: 970 units under construction3 |
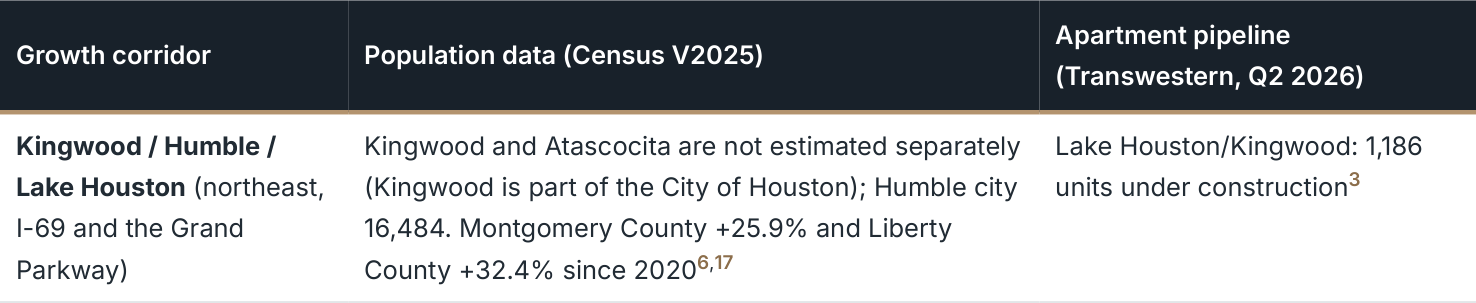
Table Summary and Key Values
| Growth corridor | Population data (Census V2025) | Apartment pipeline (Transwestern, Q2 2026) |
|---|---|---|
| Kingwood / Humble / Lake Houston (northeast, I-69 and the Grand Parkway) | Kingwood and Atascocita are not estimated separately (Kingwood is part of the City of Houston); Humble city 16,484. Montgomery County +25.9% and Liberty County +32.4% since 20206,17 | Lake Houston/Kingwood: 1,186 units under construction3 |
Suburbs dominate new construction, too. Transwestern counts 83% of Houston's units under construction in suburban areas,3 and Newmark puts non-infill submarkets at 88.7% of upcoming supply.1 So the right question is not "suburbs or city?" but which suburbs, which product and which delivery year.
The northeast corridor: Kingwood, Humble and Lake Houston
The northeast suburbs sit between two of the region's largest job
$150,742
generators, IAH and Generation Park, along I-69 and the Grand Parkway, with Lake Houston and its greenbelts as a lifestyle draw. The
median household income in Kingwood's 77345 ZIP, nearly double the metro median18,19
demographics are strong. In Kingwood's 77345 ZIP code, median household income is $150,742, nearly double the metro median of $82,168, and only 14% of households rent. In neighboring 77339, the median is $84,102 and 44% of households rent.18,19,20 High incomes and a low renter share describe a community of people who could afford a house but may prefer, or need, to rent for a while, which is the core build-to-rent customer.

Table Summary and Key Values
| ACS 2020-2024 5-year estimates | Kingwood (ZCTA 77345) | Kingwood/Humble (ZCTA 77339) | Houston metro |
|---|---|---|---|
| Median household income | $150,742 | $84,102 | $82,168 |
| Renter-occupied households | 14.0% | 44.1% | 38.8% |
| Median age | 41.3 | 39.3 | 35.4 |
Rents in the area have held up better than the metro. RealPage data compiled by Newmark show Humble/ Kingwood effective rents up 0.19% in the first half of 2026, while the metro average fell 2.24% (also RealPage via Newmark). RealPage projects Humble/Kingwood rent growth of 2.66% a year from 2027 to 2030, ahead of the 2.18% projected for the metro.1 What could go wrong: Lake Houston/Kingwood is currently Houston's most active construction submarket. Transwestern counts 1,186 units underway,3 and Newmark counts 912, with 624 delivering in 2026 and 288 in 2027 (vs. a 10-year average of 634 a year). Newmark shows nothing scheduled beyond 2027.1 Near-term lease-up competition is real, but the pipeline after 2027 is thin.

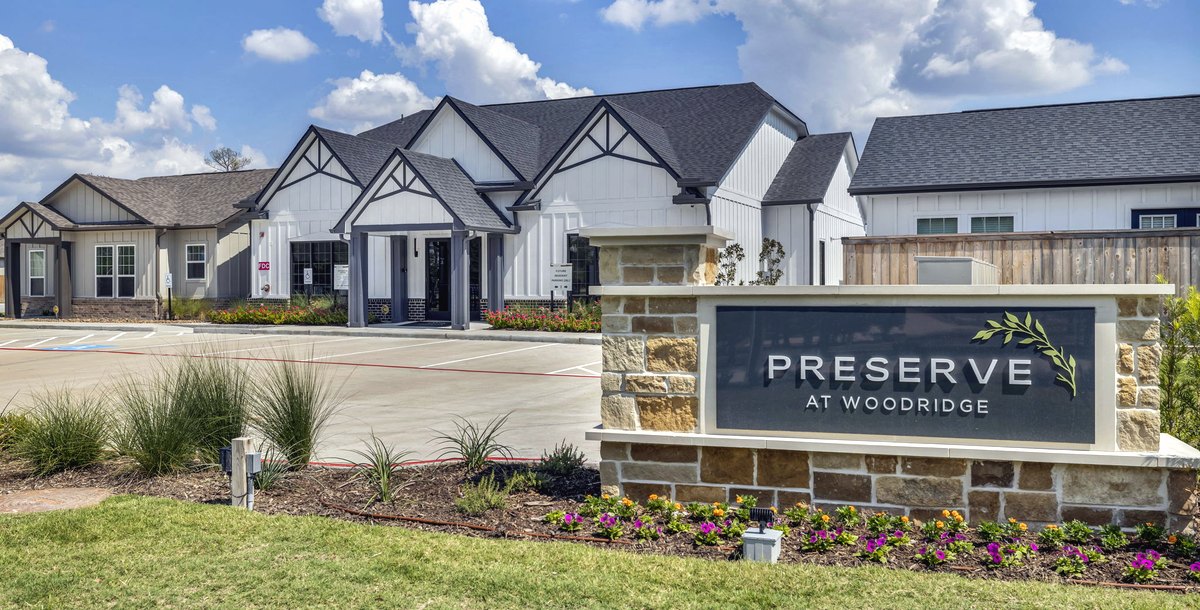
Commons (cropped)
community
4. The supply pipeline is thinning
BOTTOM LINE Houston apartment starts are on pace to finish 2026 about 60% below their 2022 peak, so far fewer new units will be competing for renters in 2027 and 2028.
This is the core of the development thesis. The 2019 to 2024 supply
~60%
wave came from projects financed when money was cheap. Higher interest rates and construction costs have since kept many new projects
projected decline in 2026 starts vs. the 2022 peak (Newmark)1
from starting.
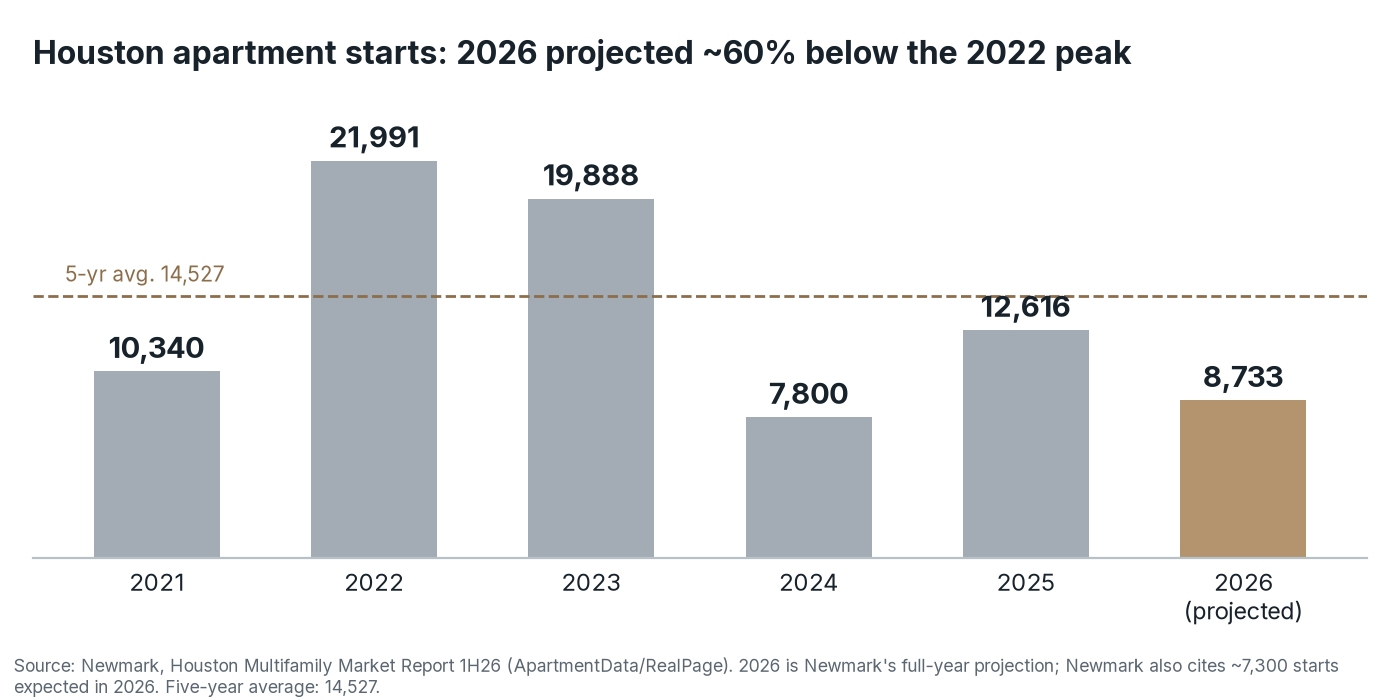
Chart Summary and Key Values
Houston apartment starts: 10,340 in 2021; 21,991 in 2022; 19,888 in 2023; 7,800 in 2024; 12,616 in 2025; and 8,733 projected for 2026. The 2026 projection is approximately 60% below the 2022 peak. The displayed five-year average is 14,527; projected starts are not actual completions.
Houston multifamily construction starts by year.1
Starts: Newmark counts 21,991 starts in 2022 and projects 8,733 in 2026, down 31% from 2025 and well below the five-year average of 14,527.1 CoStar data show trailing-12-month starts of 7,658 units through Q2 2026.21 Northmarq counts about 3,000 starts in the first half of 2026, down 19% year over year, and about 4,000 permits, compared with a five-year average of more than 8,000 for the period.2
Under construction: About 11,500 to 13,300 units, depending on the provider: CoStar 11,461 (1.5% of inventory),21 Northmarq 13,2702 and Transwestern 13,319.3 Northmarq counted 17,192 units under construction at the end of 2024.22
Deliveries: Houston delivered 19,024 units in 2024 and 9,806 in 2025 (ApartmentData via Newmark).1 Providers count differently; Northmarq reports 14,099 completions in 2025.22
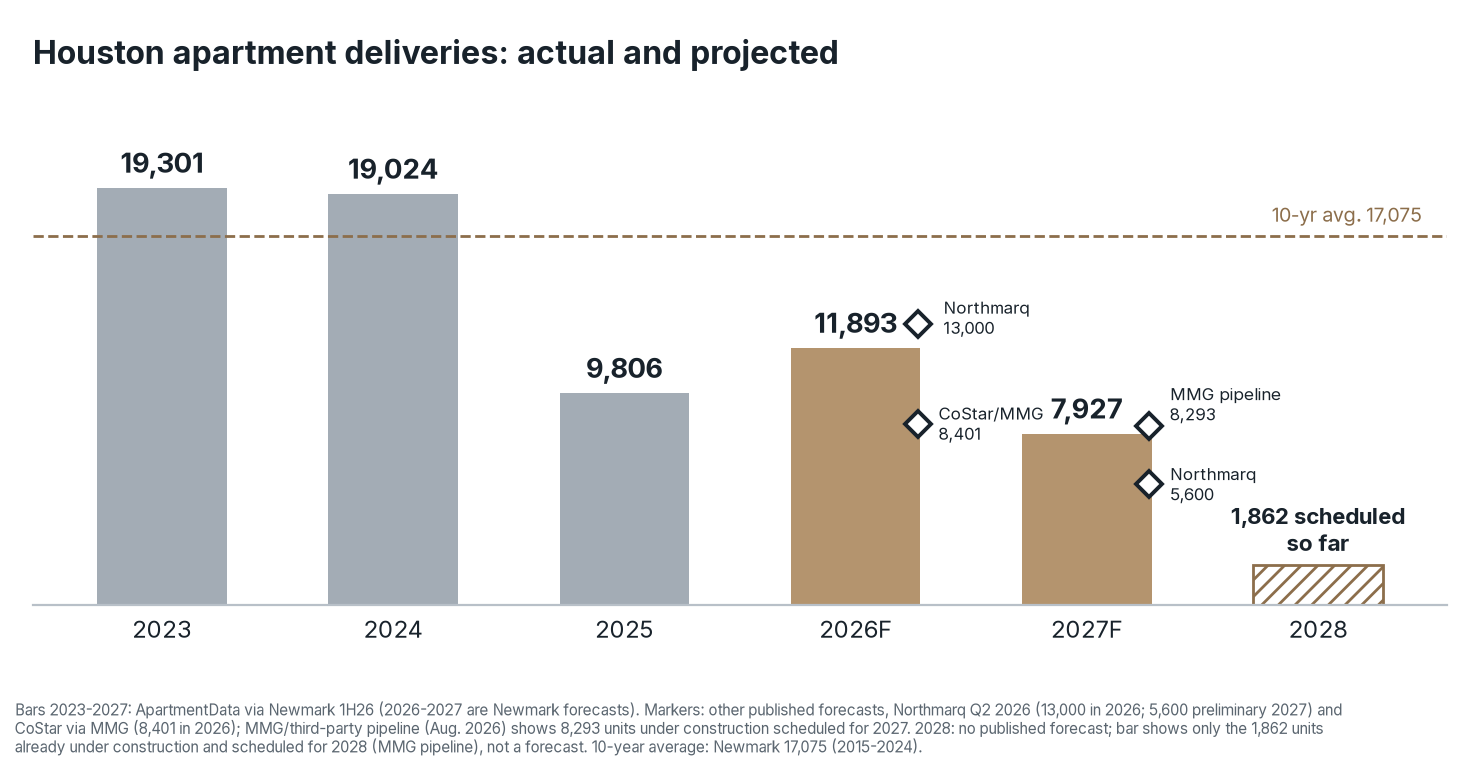
Chart Summary and Key Values
Houston apartment deliveries: 19,301 actual units in 2023, 19,024 in 2024 and 9,806 in 2025. The main bars forecast 11,893 for 2026 and 7,927 for 2027; separate markers identify other providers' forecasts. The 1,862 units shown for 2028 are scheduled so far, not a full-year forecast. The displayed 10-year average is 17,075.
Houston apartment deliveries: actual (2023-2025) and projected (2026-2028).
Projected deliveries, 2026-2028: range of published forecasts
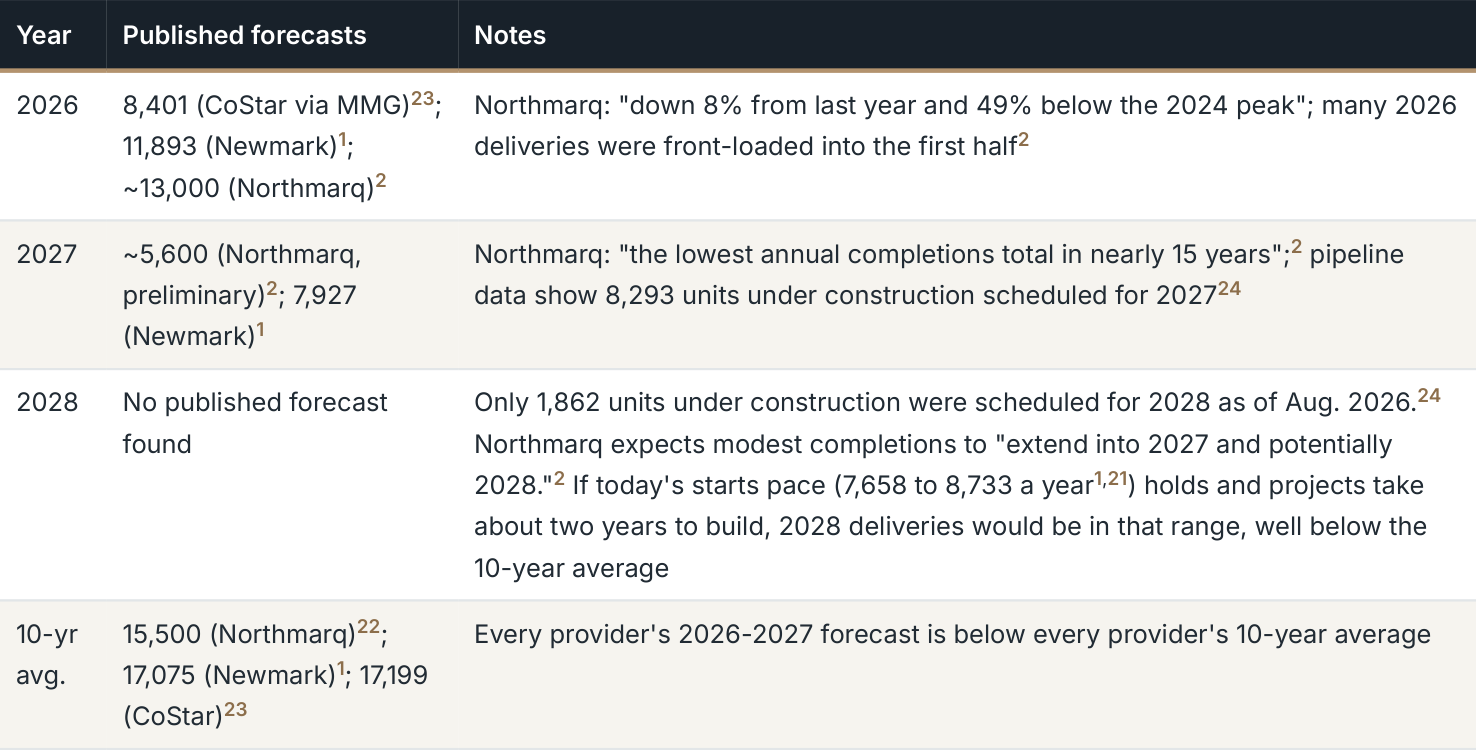
Table Summary and Key Values
| Year | Published forecasts | Notes |
|---|---|---|
| 2026 | 8,401 (CoStar via MMG)23; 11,893 (Newmark)1; ~13,000 (Northmarq)2 | Northmarq: "down 8% from last year and 49% below the 2024 peak"; many 2026 deliveries were front-loaded into the first half2 |
| 2027 | ~5,600 (Northmarq, preliminary)2; 7,927 (Newmark)1 | Northmarq: "the lowest annual completions total in nearly 15 years";2 pipeline data show 8,293 units under construction scheduled for 202724 |
| 2028 | No published forecast found | Only 1,862 units under construction were scheduled for 2028 as of Aug. 2026.24 Northmarq expects modest completions to "extend into 2027 and potentially 2028."2 If today's starts pace (7,658 to 8,733 a year1,21) holds and projects take about two years to build, 2028 deliveries would be in that range, well below the 10-year average |
| 10-yr avg. | 15,500 (Northmarq)22; 17,075 (Newmark)1; 17,199 (CoStar)23 | Every provider's 2026-2027 forecast is below every provider's 10-year average |
Class A first: the newest product is leading
Newer, higher-quality communities are absorbing most of the demand. Northmarq reports Class A vacancy fell 50 basis points in Q2 2026 to 8.1%, the first annual decline in Class A vacancy since the first quarter of 2023, and Class A asking rents rose 1.4% year over year to $1,629.2 Newmark finds the top tranche of suburban assets (rents of $1,700 or more) posting 5.4% rent growth year to date at 94% occupancy, while all suburban Class A product grew rents 0.2% with occupancy, including lease-ups, below 90%.1
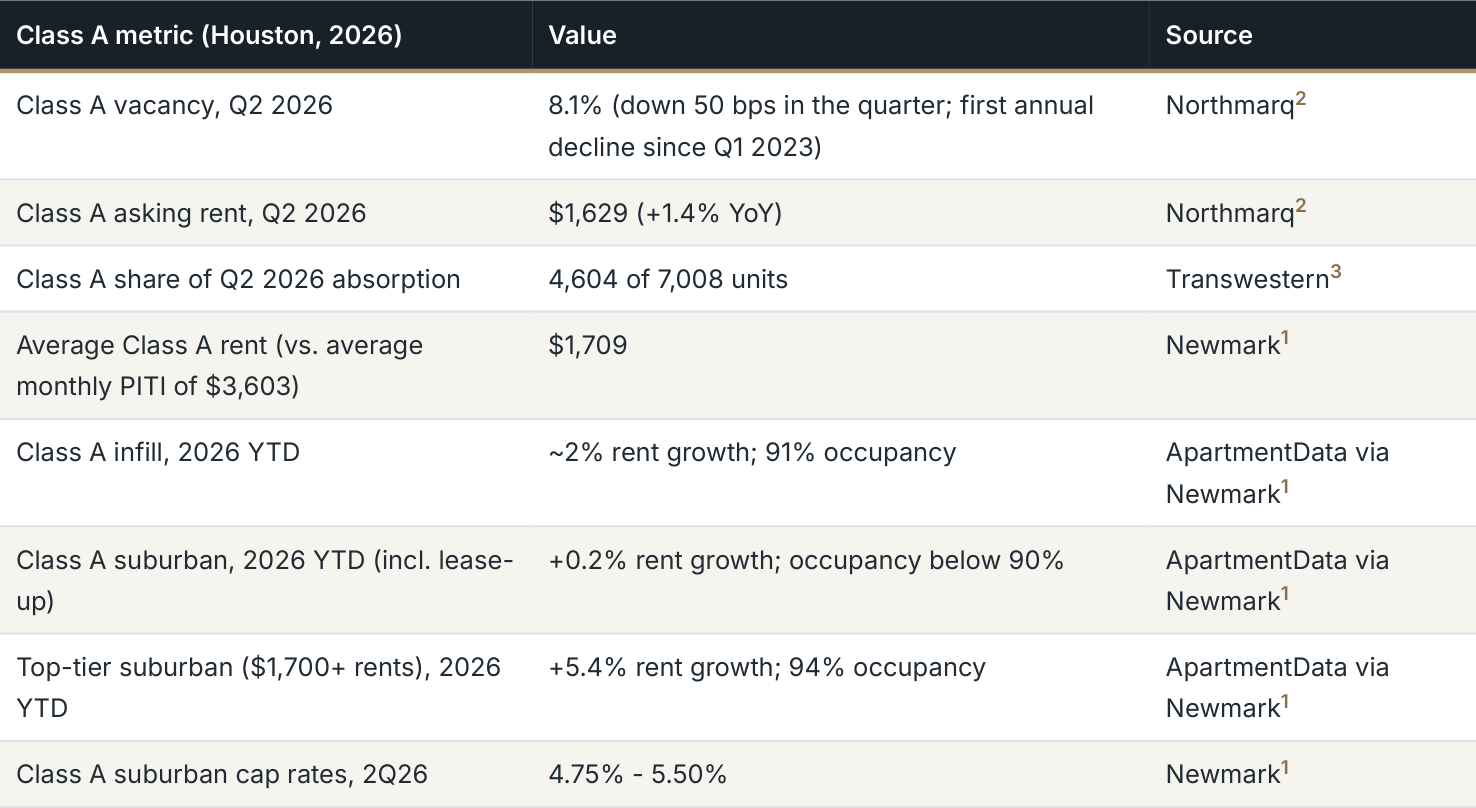
Table Summary and Key Values
| Class A metric (Houston, 2026) | Value | Source |
|---|---|---|
| Class A vacancy, Q2 2026 | 8.1% (down 50 bps in the quarter; first annual decline since Q1 2023) | Northmarq2 |
| Class A asking rent, Q2 2026 | $1,629 (+1.4% YoY) | Northmarq2 |
| Class A share of Q2 2026 absorption | 4,604 of 7,008 units | Transwestern3 |
| Average Class A rent (vs. average monthly PITI of $3,603) | $1,709 | Newmark1 |
| Class A infill, 2026 YTD | ~2% rent growth; 91% occupancy | ApartmentData via Newmark1 |
| Class A suburban, 2026 YTD (incl. lease- up) | +0.2% rent growth; occupancy below 90% | ApartmentData via Newmark1 |
| Top-tier suburban ($1,700+ rents), 2026 YTD | +5.4% rent growth; 94% occupancy | ApartmentData via Newmark1 |
| Class A suburban cap rates, 2Q26 | 4.75% - 5.50% | Newmark1 |
All classes: absorption, occupancy and rents
Demand has caught up with the wave. Northmarq calls Q2 2026
6,500+
absorption (more than 6,500 units, up 60% year over year) the driver of the steepest quarterly vacancy decline since 2021.2 Transwestern
units absorbed in Q2 2026, all classes, with the steepest quarterly vacancy drop since 2021 (Northmarq)2
counts 7,008 units absorbed in Q2, with 36 of 42 submarkets posting positive absorption.3 Rents are still soft while the last of the wave leases up: Transwestern reports 55% of units offering some concession.3 Data providers measure occupancy and rent differently (CoStar includes properties in lease-up, for example), so the table shows each provider's figures separately.
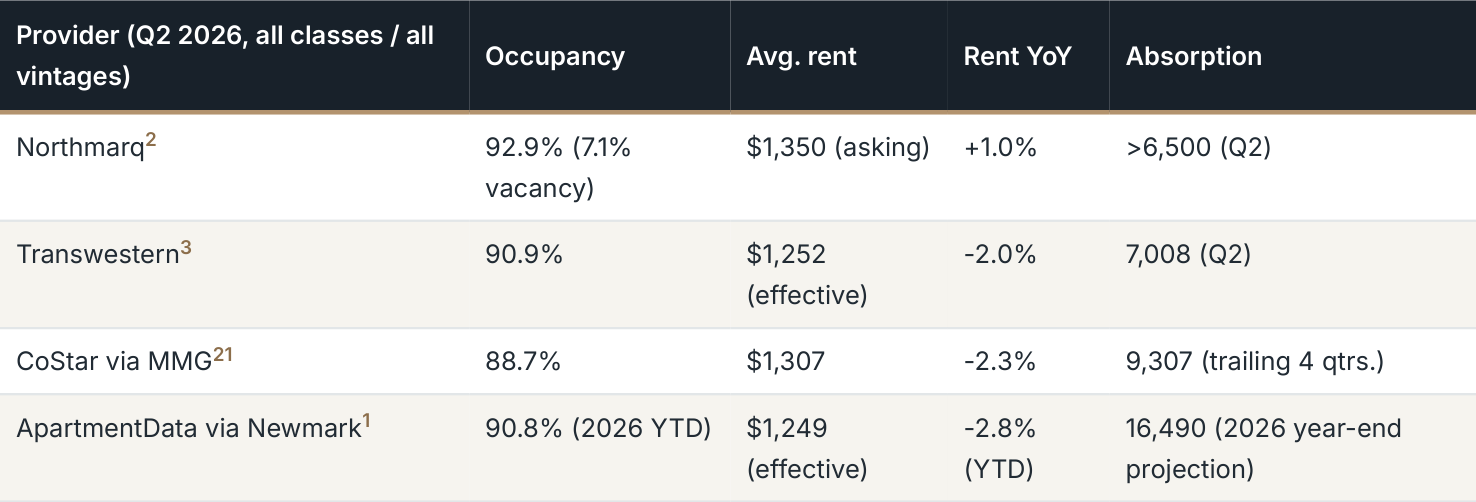
Table Summary and Key Values
| Provider (Q2 2026, all classes / all vintages) | Occupancy | Avg. rent | Rent YoY | Absorption |
|---|---|---|---|---|
| Northmarq2 | 92.9% (7.1% vacancy) | $1,350 (asking) | +1.0% | >6,500 (Q2) |
| Transwestern3 | 90.9% | $1,252 (effective) | -2.0% | 7,008 (Q2) |
| CoStar via MMG21 | 88.7% | $1,307 | -2.3% | 9,307 (trailing 4 qtrs.) |
| ApartmentData via Newmark1 | 90.8% (2026 YTD) | $1,249 (effective) | -2.8% (YTD) | 16,490 (2026 year-end projection) |
How to read it: All-vintage rents are flat to slightly negative depending on the provider, and concessions are widespread, while Class A vacancy is falling. But vacancy is falling, absorption is strong and the delivery pipeline is shrinking quickly. Northmarq forecasts vacancy of 6.8% by year-end 2026, moving gradually back
toward the historical average of about 6%,2 and CoStar data point to "reduced delivery pressure through 2027."21
5. History lesson: Houston rents after past supply waves
BOTTOM LINE Twice in the last decade, Houston rents rebounded once a supply wave was absorbed and construction slowed; that is a historical pattern, not a forecast.
Today's soft rents reflect a supply wave, not a collapse in demand. That
5,551
raises a fair question: what has happened in Houston before, once a wave of new construction ran its course? The record offers three useful
units delivered in 2018, down from 19,020 in 2016 (ApartmentData via Newmark)1
episodes.
After the 2008 glut
Houston delivered 21,862 units in 2008, during the recession. Deliveries then fell to only 3,900 to 5,900 units a year from 2010 to 2012. By 2014, rental rates were rising 8.1% a year, followed by another 5.0% in 2015, according to Apartment Data Services (ADS) figures cited by the Harris County Appraisal District.25 The ApartmentData effective-rent series in the chart below (via Newmark) shows 7.7% for 2014 and 4.9% for 2015; the two providers measure rents differently, so each figure is labeled by source.1
Looking ahead. Published forecasts point to a recovery, though not to a 2021-style spike. RealPage, via Newmark, projects Houston effective rents to fall 1.71% in 2026 and then grow an average of 2.18% a year from 2027 to 2030, with every Houston submarket positive; The Woodlands (3.94%) and Conroe/Montgomery County (3.38%) lead.1 The chart below adds a historical-rebound scenario, not a forecast: it asks what rents would look like if Houston repeated its own past rebounds once today's thin pipeline meets renter demand, using the same ApartmentData series (+7.7% as in 2014, then +14.0% as in 2021, then +10.9%, the average of the two). The 2021 jump came when demand surged after a supply wave and was boosted by pandemic-era demand; whether anything like it repeats is uncertain. Scenarios and forecasts are estimates, not guarantees.
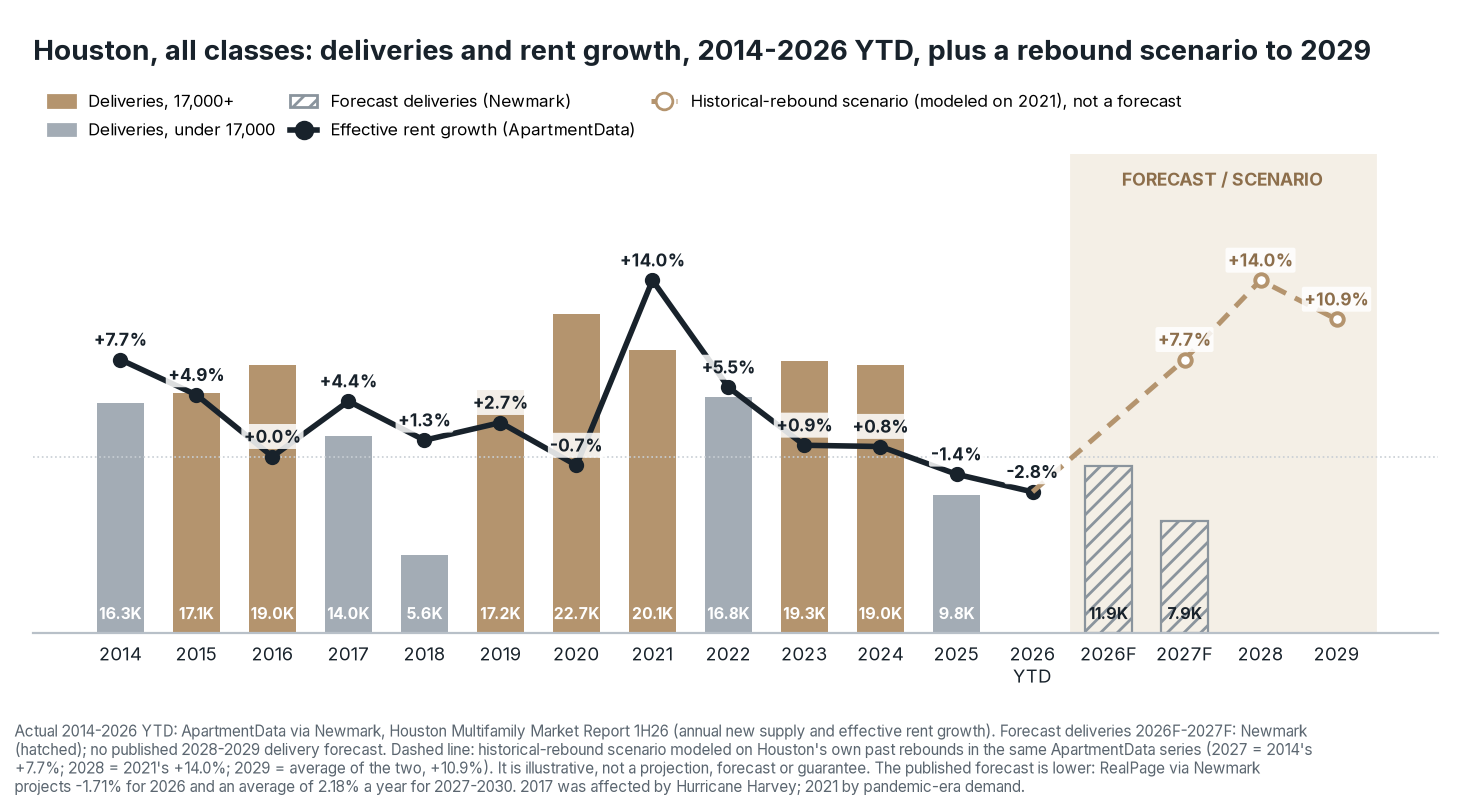
Chart Summary and Key Values
Houston effective rent growth shown for 2014–2026 YTD is +7.7%, +4.9%, +0.0%, +4.4%, +1.3%, +2.7%, −0.7%, +14.0%, +5.5%, −0.9%, −0.8%, −1.4% and −2.6%, respectively. The dashed 2027–2029 rebound scenario shows +7.7%, +14.0% and +10.9%. It is an illustrative scenario modeled on the prior rebound, explicitly not a forecast. Bars separately distinguish deliveries above and below 17,000 units and forecast deliveries.
Houston annual apartment deliveries and rent growth, all classes: actuals from ApartmentData via Newmark; forecast deliveries from Newmark. The dashed line is a historical-rebound scenario built from the same ApartmentData series (2027 = 2014's +7.7%; 2028 = 2021's +14.0%; 2029 = their average, +10.9%). Scenarios are illustrative, not projections or guarantees. The published RealPage forecast
(via Newmark) is lower: -1.71% in 2026 and 2.18% a year in 2027-2030.1
The 2014-2016 oil bust
Then the oil price collapse hit just as another wave of construction
+4.4%
delivered, about 20,000 units in both 2015 and 2016 per ADS. In 2016, absorption fell to 4,195 units (from 13,262 in 2015), vacancy rose to
effective rent growth in 2017 after the oil-bust wave (ApartmentData via Newmark)1
11.5%, rents were flat, and 57% of Class A properties were offering concessions averaging almost a month of free rent.25 Builders pulled back: ApartmentData counts deliveries falling from 19,020 in 2016 to 5,551 in 2018.1 Effective rents rebounded 4.4% in 2017 (ApartmentData via Newmark, all classes),1 and ADS counted 17,469 units absorbed in 2017. Hurricane Harvey distorted that rebound, temporarily taking about 15,000 units out of service and pushing occupancy from 88.9% to 90.2%.26
The 2020-2021 echo, and today
After deliveries peaked at 22,678 units in 2020, effective rents jumped 14.0% in 2021 (ApartmentData via Newmark), driven by pandemic-era demand, so 2021 should not be treated as a typical rebound. Deliveries of about 19,000 a year in 2023 and 2024 pushed effective rent growth below 1% and then negative: -1.4% in 2025 and -2.8% year to date in 2026 (ApartmentData via Newmark, all classes).1 Deliveries have already fallen to 9,806 in 2025.1
The pattern, and its limits. In past Houston cycles, rents weakened while a supply wave delivered, then rose once deliveries fell and demand absorbed the vacant units. That is a historical pattern, not a prediction or a promise. Each cycle had different drivers (the 2017 rebound was distorted by Hurricane Harvey; 2021 by pandemic migration), and Houston's exposure to energy prices means the next cycle may not repeat. Past performance does not guarantee future results.
6. Build-to-rent communities: a growing niche
BOTTOM LINE Build-to-rent communities serve households who want house-like space without buying, and Houston's BTR pipeline is shrinking just as occupancy climbs.
Build-to-rent (BTR) communities are communities of new single-family-
~7%
style rental units built specifically to lease, with professional management and shared amenities. They sit between apartments and
built-for-rent share of U.S. single- family starts, vs. 2.7% historically (NAHB)27
for-sale houses: residents get private entries, more space and often a garage or yard, without a down payment or mortgage. Attached BTR typically fits more units on a site than detached BTR while keeping the house-like feel.
The national picture
U.S. single-family built-for-rent starts were about 15,000 in Q2 2026, down from 18,000 a year earlier, and 63,000 over the past four quarters (-16%). Built-for-rent's share of single-family starts is about 7%, compared with a historical average of 2.7%, according to NAHB.27
RealPage counts 59,660 BTR units under construction nationally as of August 2026, led by the South. It expects about 40,800 deliveries by the end of 2026, 33,100 in 2027 and fewer than 8,000 in 2028. Houston ranks fifth with 2,692 units underway, behind Phoenix, Dallas, Atlanta and Charlotte.28
Houston BTR
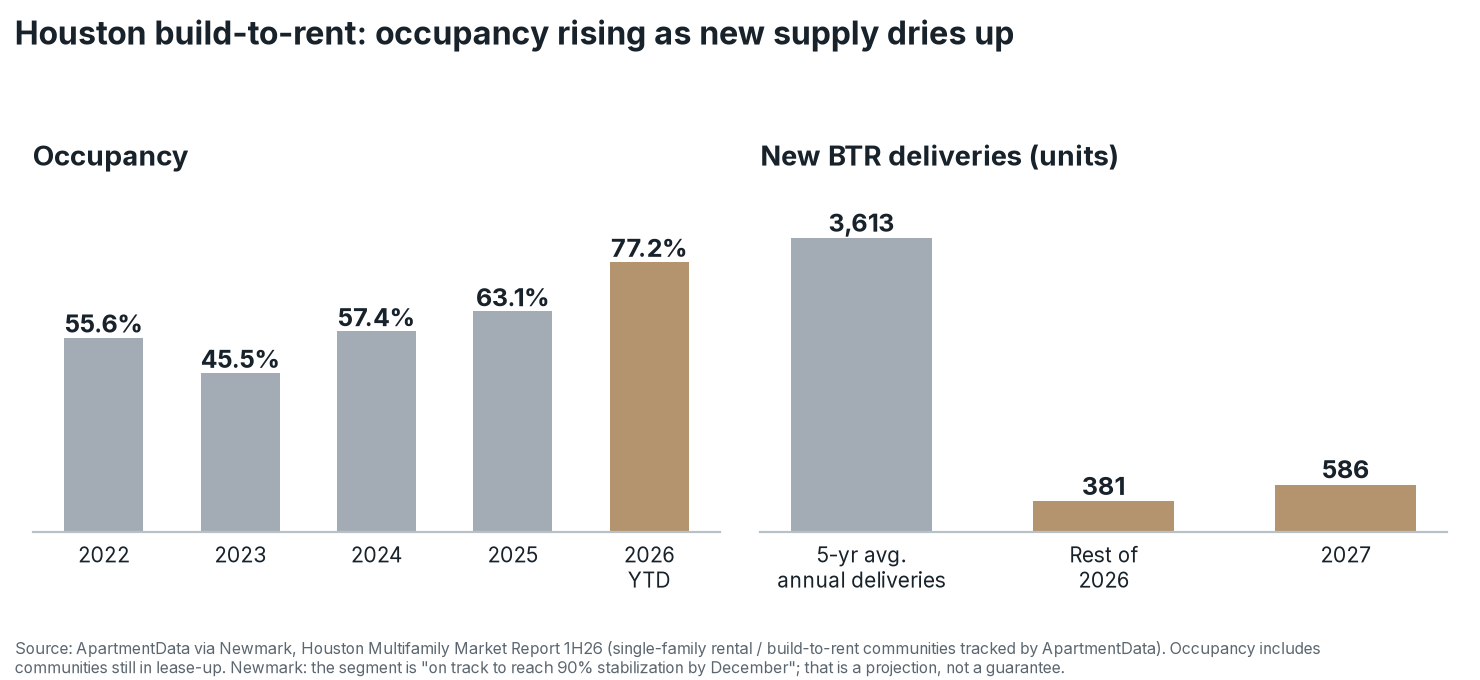
Chart Summary and Key Values
Houston build-to-rent occupancy shown is 55.6% in 2022, 45.5% in 2023, 57.4% in 2024, 63.1% in 2025 and 77.2% in 2026 YTD. New BTR supply compares a five-year average of 3,613 annual units with 381 scheduled for the remainder of 2026 and 586 for 2027. The source definition includes build-to-rent communities tracked by ApartmentData.
Houston single-family rental / build-to-rent communities tracked by ApartmentData.1
Houston's BTR market is still small: about 12,500 completed units plus 2,200 in the pipeline, according to Zonda data cited by Rice University's Kinder Institute. Developers have mostly targeted large suburbs with highly rated school districts, such as Conroe, Cypress, Katy and Tomball, with rents typically ranging from the low $1,000s to the high $2,000s.29 Demand is supported by affordability: Kinder estimates Harris County's homeownership affordability gap, the difference between what a median-income household can afford and the median sale price, reached an all-time high of about $127,700 in 2024.29 With 30-year mortgage rates around 7.40%,30 many would-be buyers are renting longer.
ApartmentData figures compiled by Newmark show Houston BTR
77.2%
occupancy rising from 63.1% in 2025 to 77.2% so far in 2026 (including communities still in lease-up), at an average effective rent of $2,022.
Houston BTR occupancy so far in 2026, including lease-up (ApartmentData via Newmark)1
Only 381 more units are scheduled to deliver in the rest of 2026 and 586 in 2027, compared with a five-year average of 3,613 a year. Newmark says the segment is "on track to reach 90% stabilization by December."1 That is a projection; today's 77.2% reflects how much new BTR product is still leasing up.
Policy watch: the ROAD to Housing Act
The 21st Century ROAD to Housing Act became law on July 11, 2026 and takes effect January 7, 2027. It prohibits large institutional investors (those with investment control of 350 or more single-family homes) from buying additional single-family homes, with civil penalties of up to $1 million per violation or three times the purchase price, whichever is greater. Newly constructed build-to-rent units are an excepted purchase, and the enacted law contains no forced-sale requirement; an earlier version would have required sales within seven years.31 NAHB notes that the law does not prohibit institutional capital from financing BTR.27
Why the exemption is so powerful. For the 15 years the prohibition is in force, the largest institutional single- family investors generally can't grow by buying existing houses. New construction under a build-to-rent program is one of the few doors left open, and Treasury is expressly barred from writing rules that narrow the excepted purchases. A large investor can also buy from another large investor that acquired its homes in compliance with the law.31 In our view, that makes newly built BTR communities one of the main ways institutional capital can keep growing in single-family rentals, which can add significant value to well-located BTR, including at exit. How the law applies depends on each project's structure, so sponsors should get legal advice on a specific project.
7. Why starting now can mean delivering into a tighter market
BOTTOM LINE A project that breaks ground in late 2026 or 2027 would likely deliver in 2028, when few competing projects are scheduled to open.
Development is a timing business. Equity committed today is not exposed to today's lease-up market. It is exposed to the market when the project opens, typically 18 to 24 months after groundbreaking, followed by lease-up. The data point to a favorable setup for a 2028 delivery:
1. The competition is not being built. 2026 starts are projected at about 60% below the 2022 peak,1 and only 1,862 units under construction are scheduled to deliver in 2028.24
2. Today's pipeline will mostly be absorbed by then. Forecasts put 2027 deliveries at about 5,600 to 7,900 units,1,2 the lowest in nearly 15 years by Northmarq's count, with absorption running well ahead of deliveries in 2026.1,2
3. Demand keeps compounding. Houston added more than 126,000 residents last year4 and is expected to add about 30,000 to 35,000 jobs in 2026.2,8
4. A developer's view: development builds in equity that acquisitions can't. An acquisition, by definition,
happens at fair market value, so any value above the purchase price has to be created after closing, through renovations, better management or higher rents. A disciplined developer starts a project only when the cost to build it is below what the finished, stabilized property is expected to be worth at fair market value. When that holds, the gap between cost and value is equity built in from day one, which is why we believe development is inherently the stronger way to create value. It is not guaranteed: it depends on building on budget and on schedule, leasing at underwritten rents and values holding through the exit.
Cap rates: what the market is paying
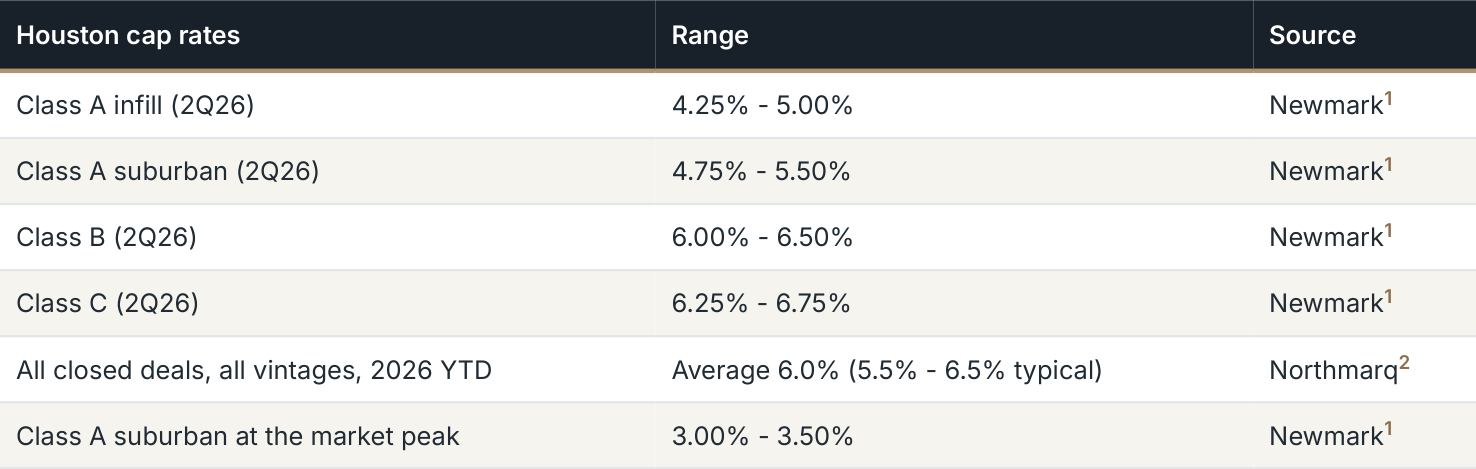
Table Summary and Key Values
| Houston cap rates | Range | Source |
|---|---|---|
| Class A infill (2Q26) | 4.25% - 5.00% | Newmark1 |
| Class A suburban (2Q26) | 4.75% - 5.50% | Newmark1 |
| Class B (2Q26) | 6.00% - 6.50% | Newmark1 |
| Class C (2Q26) | 6.25% - 6.75% | Newmark1 |
| All closed deals, all vintages, 2026 YTD | Average 6.0% (5.5% - 6.5% typical) | Northmarq2 |
| Class A suburban at the market peak | 3.00% - 3.50% | Newmark1 |
Disciplined sponsors underwrite reasonable exit cap assumptions: generally at or above today's observed ranges for the product type, not the peak-era cap rates of 2021 and 2022.
8. Development risks and how disciplined sponsors manage
them
BOTTOM LINE Cost, schedule, rate, lease-up, weather, policy and exit risks are real, and how a sponsor structures and manages them matters as much as the market.
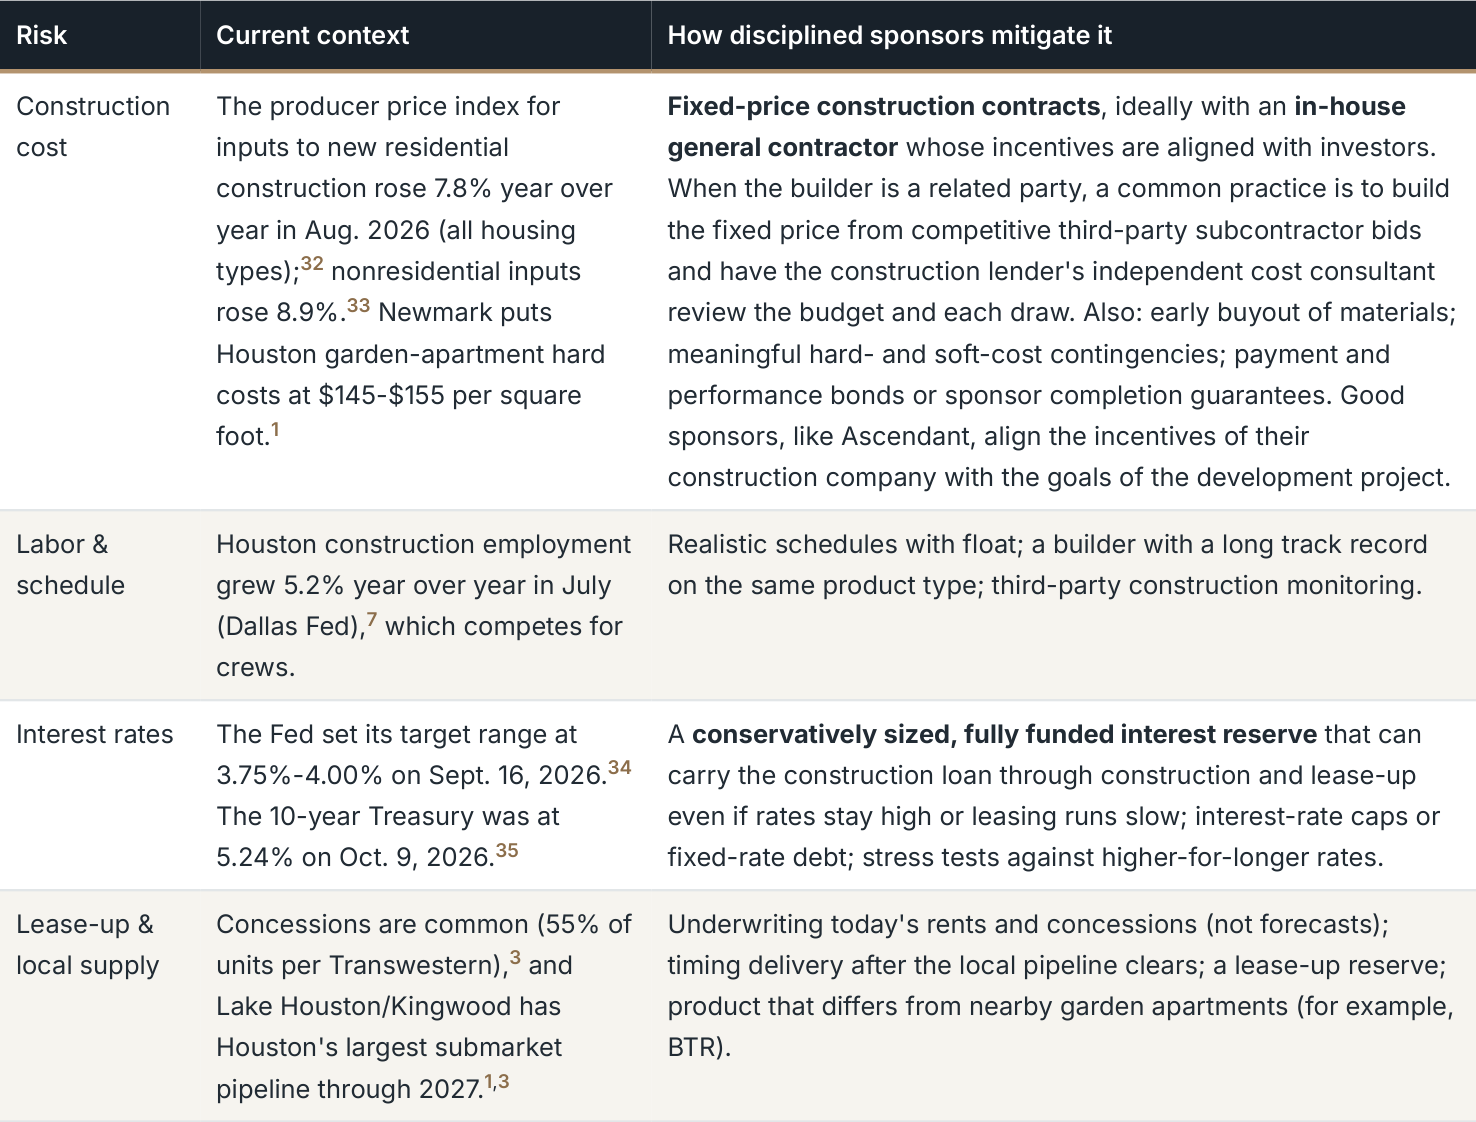
Table Summary and Key Values
| Risk | Current context | How disciplined sponsors mitigate it |
|---|---|---|
| Construction cost | The producer price index for inputs to new residential construction rose 7.8% year over year in Aug. 2026 (all housing types);32 nonresidential inputs rose 8.9%.33 Newmark puts Houston garden-apartment hard costs at $145-$155 per square foot.1 | Fixed-price construction contracts, ideally with an in-house general contractor whose incentives are aligned with investors. When the builder is a related party, a common practice is to build the fixed price from competitive third-party subcontractor bids and have the construction lender's independent cost consultant review the budget and each draw. Also: early buyout of materials; meaningful hard- and soft-cost contingencies; payment and performance bonds or sponsor completion guarantees. Good sponsors, like Ascendant, align the incentives of their construction company with the goals of the development project. |
| Labor & schedule | Houston construction employment grew 5.2% year over year in July (Dallas Fed),7 which competes for crews. | Realistic schedules with float; a builder with a long track record on the same product type; third-party construction monitoring. |
| Interest rates | The Fed set its target range at 3.75%-4.00% on Sept. 16, 2026.34 The 10-year Treasury was at 5.24% on Oct. 9, 2026.35 | A conservatively sized, fully funded interest reserve that can carry the construction loan through construction and lease-up even if rates stay high or leasing runs slow; interest-rate caps or fixed-rate debt; stress tests against higher-for-longer rates. |
| Lease-up & local supply | Concessions are common (55% of units per Transwestern),3 and Lake Houston/Kingwood has Houston's largest submarket pipeline through 2027.1,3 | Underwriting today's rents and concessions (not forecasts); timing delivery after the local pipeline clears; a lease-up reserve; product that differs from nearby garden apartments (for example, BTR). |
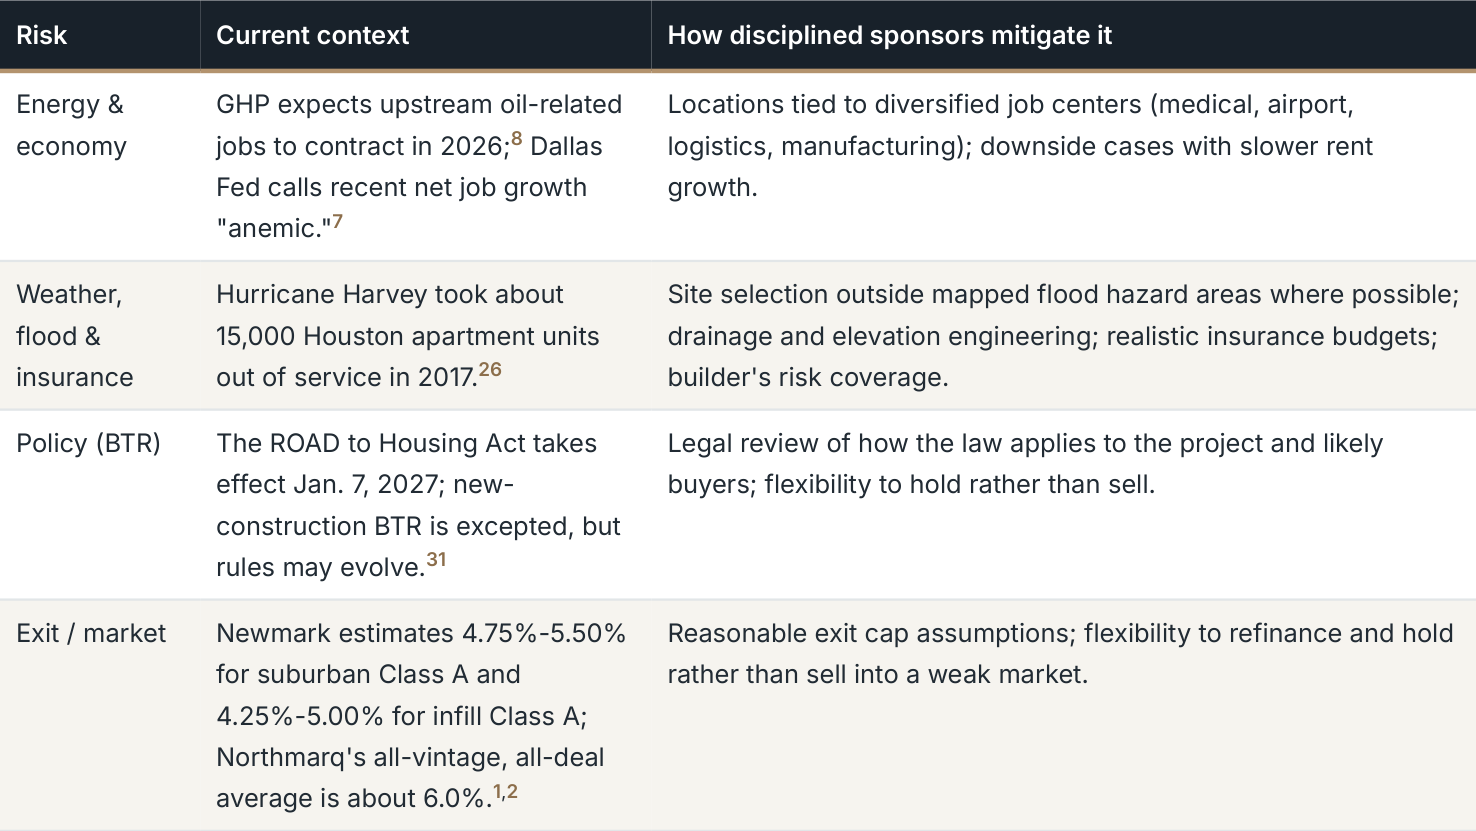
Table Summary and Key Values
| Risk | Current context | How disciplined sponsors mitigate it |
|---|---|---|
| Energy & economy | GHP expects upstream oil-related jobs to contract in 2026;8 Dallas Fed calls recent net job growth "anemic."7 | Locations tied to diversified job centers (medical, airport, logistics, manufacturing); downside cases with slower rent growth. |
| Weather, flood & insurance | Hurricane Harvey took about 15,000 Houston apartment units out of service in 2017.26 | Site selection outside mapped flood hazard areas where possible; drainage and elevation engineering; realistic insurance budgets; builder's risk coverage. |
| Policy (BTR) | The ROAD to Housing Act takes effect Jan. 7, 2027; new- construction BTR is excepted, but rules may evolve.31 | Legal review of how the law applies to the project and likely buyers; flexibility to hold rather than sell. |
| Exit / market | Newmark estimates 4.75%-5.50% for suburban Class A and 4.25%-5.00% for infill Class A; Northmarq's all-vintage, all-deal average is about 6.0%.1,2 | Reasonable exit cap assumptions; flexibility to refinance and hold rather than sell into a weak market. |
9. Tax considerations of new development for LPs
BOTTOM LINE New development can generate meaningful depreciation for limited partners, but the benefit depends on each investor's tax situation.
General education only, not tax advice. Tax outcomes depend on each
100%
investor's situation. Consult your own CPA or tax advisor.
bonus depreciation, now permanent for qualified property acquired after Jan. 19, 202536
Depreciation: Residential rental buildings are generally depreciated straight-line over 27.5 years; land is not depreciable.37 In a partnership, depreciation generally flows through to limited partners on Schedule K-1.
Bonus depreciation: The One, Big, Beautiful Bill made 100% additional first-year (bonus) depreciation permanent for eligible property acquired after January 19, 2025. The building itself is not eligible, but a cost segregation study can identify shorter-lived components (such as certain fixtures, finishes and site improvements) that may qualify. IRS guidance includes rules for self-constructed property.36
Timing: In new development, depreciation generally begins when property is placed in service, so deductions are usually taken as units or buildings are delivered, not during construction.
Passive activity rules: Rental activities are generally passive. Passive losses generally offset only passive income unless you qualify as a real estate professional, and unused losses carry forward.38
Recapture: Depreciation can be recaptured and taxed when the property is sold, so exit planning is part of the analysis.37
About Ascendant Development
Ascendant Development is a vertically integrated real estate development and construction firm headquartered in Houston, Texas. According to the company, Ascendant and its principals have been involved in garden, mid-rise, high-rise and build-to-rent projects totaling more than 5,000 Class A multifamily units and more than $1 billion in total investment, including build-to-rent communities in the Kingwood area, Fresno and Tomball.
Stay ahead of the next cycle
Join the Ascendant Development investor list for quarterly Houston and Texas multifamily market updates, new editions of this report and early notice when we open offerings to verified accredited investors. To walk through the data or our development approach, visit https:// www.ascendantdevco.com/invest-with-us or call Ascendant Development at 713.600.9393.
Join the Houston Multifamily Outlook Investor List Sign up for Houston Multifamily Outlook investor updates →
Scan the code to join the Houston Multifamily Outlook Investor List.
Important disclosures
This report is provided for general informational and educational purposes only. It is not an offer to sell, or a solicitation of an offer to buy, any security, and it may not be relied upon in connection with any investment decision. Any offer will be made only to verified accredited investors through definitive offering documents (including a private placement memorandum, operating agreement and subscription agreement), which will contain important information about risks, fees and conflicts of interest.
Any offering referenced by the sponsor is expected to be made under Rule 506(c) of Regulation D. Investments are available only to accredited investors, as defined in Rule 501(a), whose status has been verified through reasonable steps. Securities offered under Regulation D are not registered with the SEC or any state securities regulator, and no regulator has approved or reviewed this material.
Real estate development investments are speculative, illiquid and involve a high degree of risk, including the possible loss of an investor's entire investment. Common equity is typically subordinate to senior debt and preferred equity. Past performance and market trends do not guarantee future results. Statements about future market conditions are forward-looking, based on third-party data and forecasts believed to be reliable but not independently verified, and actual results may differ materially.
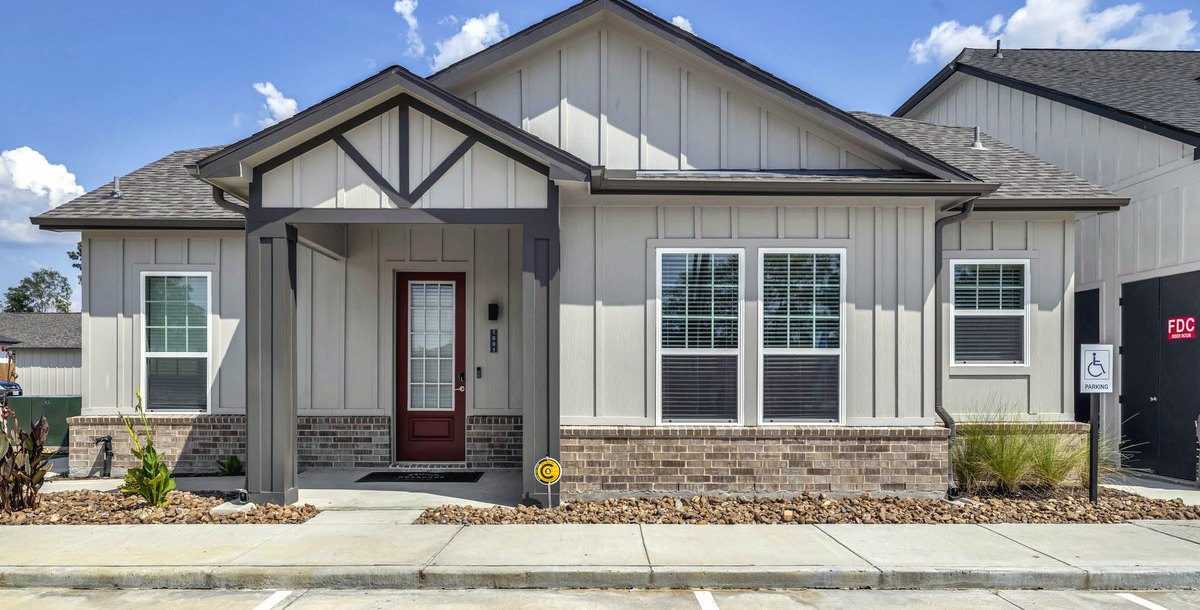
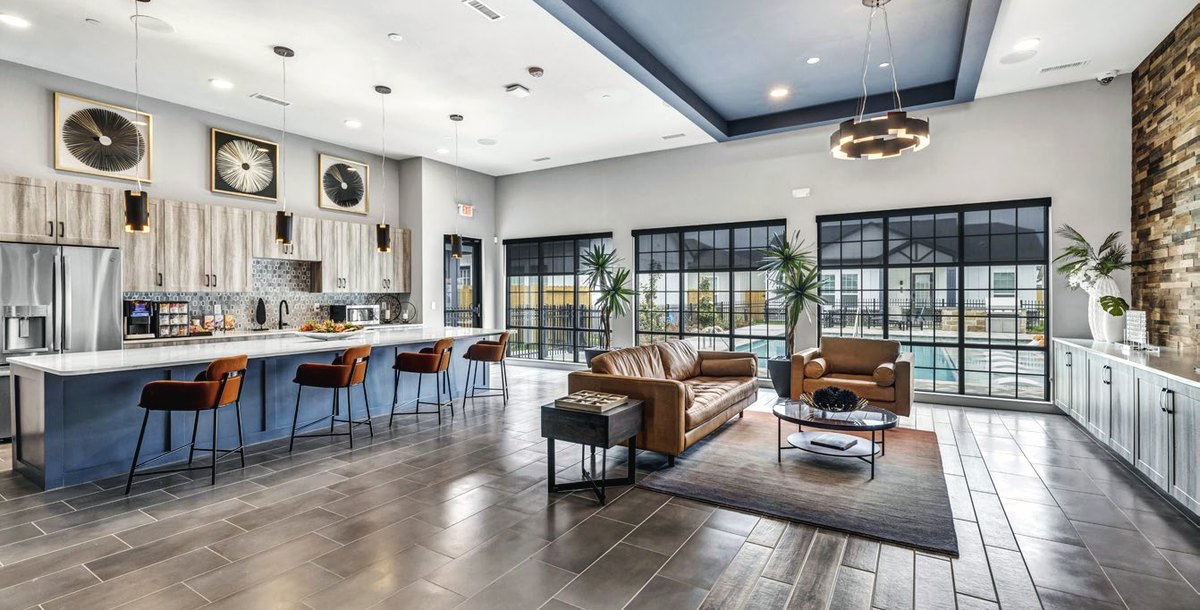
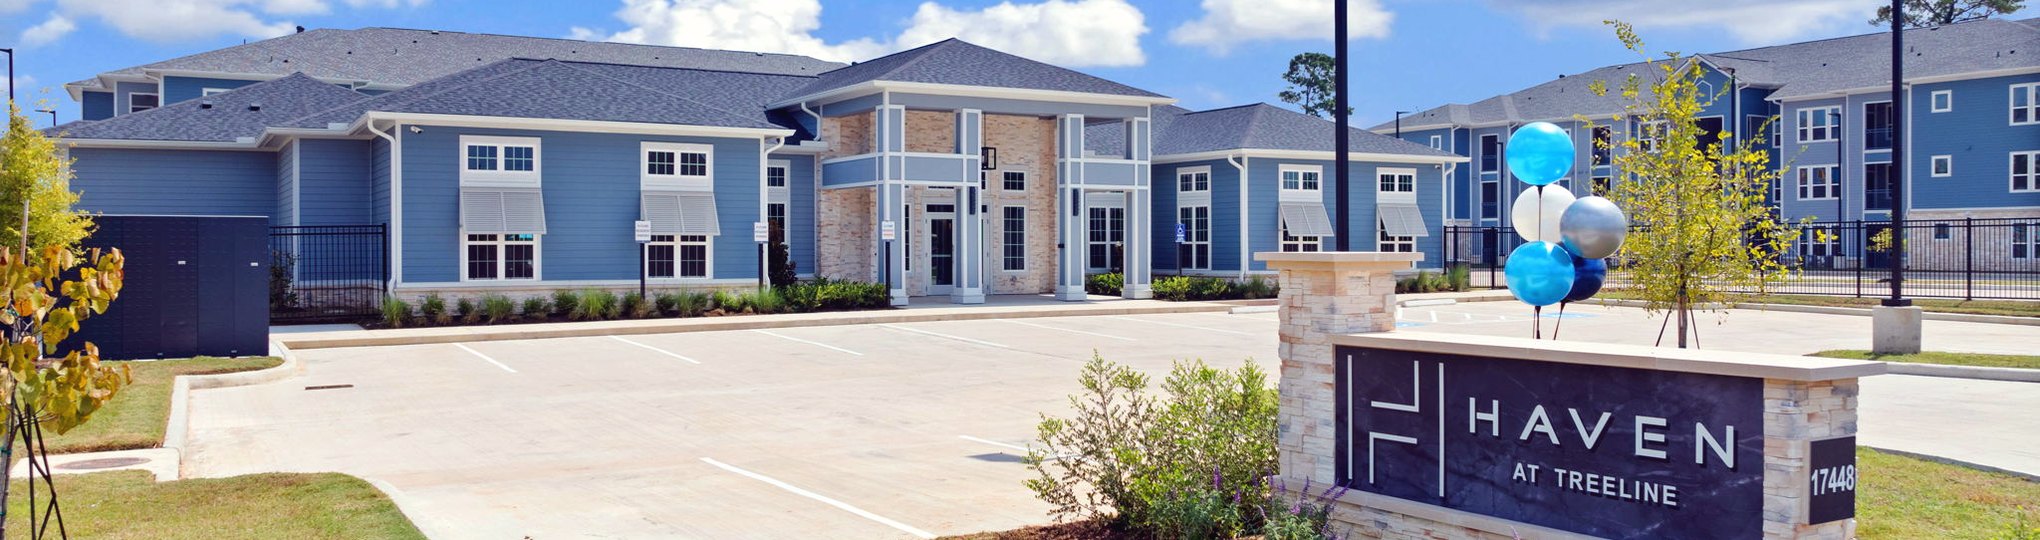
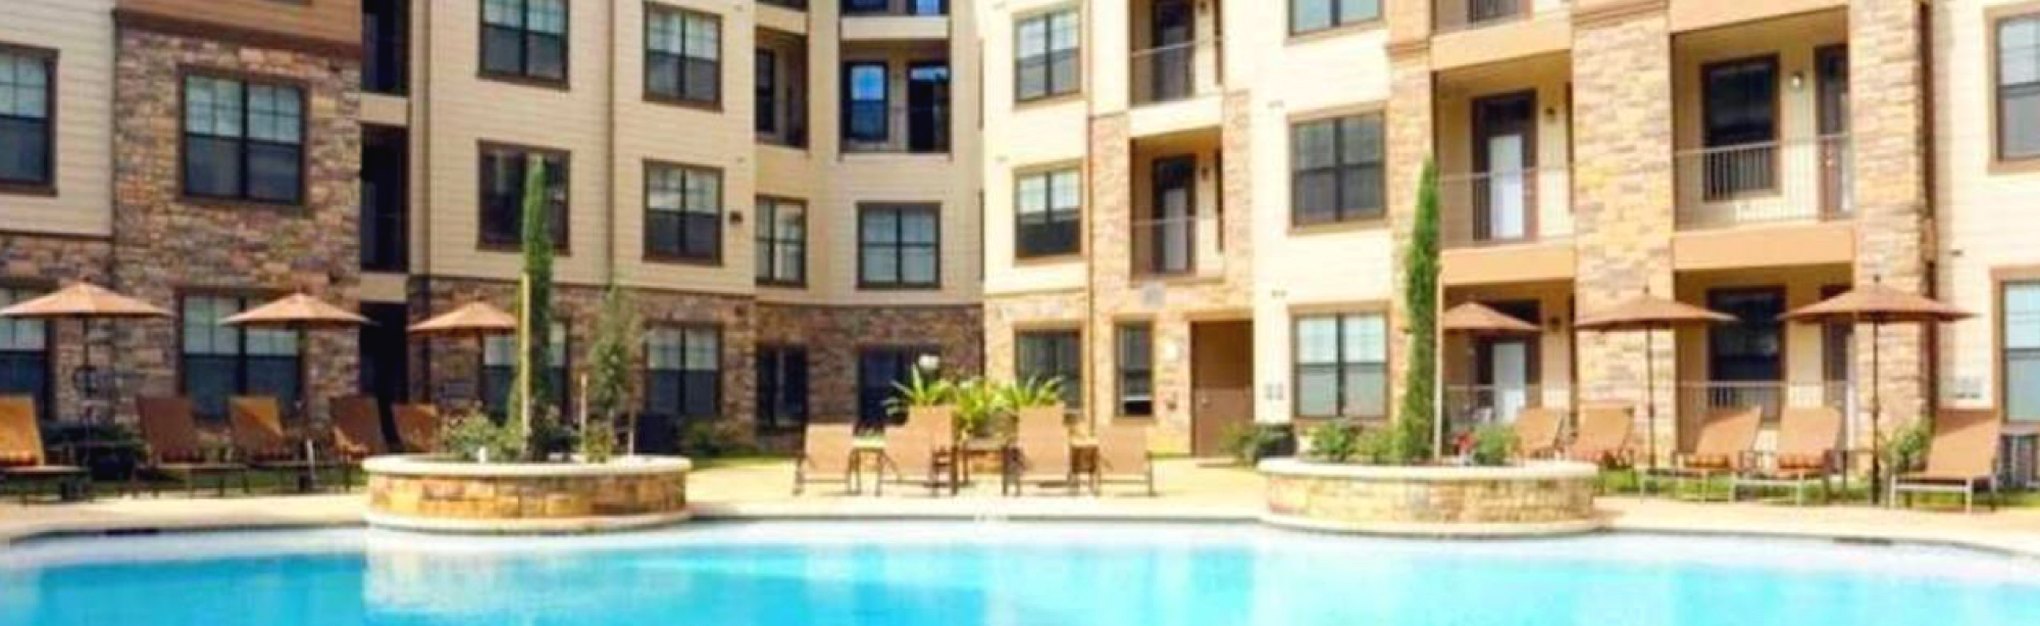
References to Ascendant Development's history, people, projects and practices are provided for general informational purposes only. They do not describe the terms, risks, projected performance or suitability of any investment. Photographs show prior or existing Ascendant projects and do not depict, or represent the results of, any current or future offering.
Historical market data, including the discussion of prior Houston rent cycles, is presented for context only. Past market patterns and past performance do not guarantee future results, and future rent growth may be lower than, or different from, historical experience.
Nothing in this report is legal, tax or investment advice. Tax laws are complex and subject to change, and their application depends on individual circumstances. Consult your own legal, tax and financial advisors before making any investment decision.
Sources
- Newmark, Houston Multifamily Market Report 1H26 (ApartmentData and RealPage data; supply, starts, submarket pipeline, SFR/BTR, cap rates updated June 2026, Replacement Cost Tracker, major projects). View source
- Northmarq, Houston Multifamily Market Insights, Q2 2026. View source
- Transwestern, Houston Multifamily Market, Q2 2026 factsheet (metro and submarket indicators). View source
- U.S. Census Bureau, "Slow Growth Impacts Nation's Largest Counties Hardest" (Vintage 2025 metro and county estimates), released Mar. 26, 2026. View source
- Workforce Solutions (Gulf Coast Workforce Board), "Houston Area Employment Situation, August 2026" (BLS/TWC data), Sept. 2026. View source
- U.S. Census Bureau, Vintage 2025 county population estimates and components of change (co-est2025-alldata.csv). View source
- Federal Reserve Bank of Dallas, Houston Economic Indicators (July 2026 data), Sept. 4, 2026. View source
- Greater Houston Partnership, "Job Growth Forecasted for Houston Region in 2026," Dec. 11, 2025. View source
- OpenStreetMap contributors, map data (ODbL), extracted Oct. 10, 2026. Points of interest plotted at approximate locations. View source
- Texas Medical Center, "About Us: TMC at a Glance". View source
- Texas Medical Center, "Opening of TMC3 Collaborative Building Marks Launch of Helix Park, a 37-acre Campus Fostering Innovation in Healthcare and Life Science," Oct. 26, 2023. View source
- Chevron Corporation, "Chevron Announces Headquarters Relocation and Senior Leadership Changes," Aug. 2, 2024. View source
- Port Houston, "Port Houston Celebrates Best Year Yet: Up 3% Total Tonnage, 4% TEUs," Jan. 30, 2026. View source
- Houston Airports, "Houston Airports closes 2025 with strong international growth, record cargo performance," 2026. View source
- Community Impact, "IAH to wrap up $1.46B Terminal Redevelopment Program in early 2026," Jan. 29, 2026. View source
- U.S. Census Bureau, "Population Growth Holds Steady in Midsized Cities Amid Widespread Slowdown" (Vintage 2025 city and town estimates), May 2026. View source
- U.S. Census Bureau, Vintage 2025 city and town population estimates, Texas (sub-est2025_48.csv). View source
- Census Reporter, ZCTA 77345 (Kingwood), U.S. Census Bureau American Community Survey 2020-2024 5-year estimates (tables B19013, B25003, B01002). View source
- Census Reporter, Houston-Pasadena-The Woodlands, TX Metro Area, ACS 2020-2024 5-year estimates. View source
- Census Reporter, ZCTA 77339 (Kingwood/Humble), ACS 2020-2024 5-year estimates. View source
- MMG Real Estate Advisors, "Houston Q2 2026 Market Report" (CoStar data). View source
- Northmarq, Houston Multifamily Market Insights, Q4 2025. View source
- MMG Real Estate Advisors, "2026 Houston Forecast" (CoStar data; 2025 and forecast 2026 completions and absorption; 10-year averages). View source
- MMG Real Estate Advisors, "Houston Q3 2026 Pipeline Report" (third-party pipeline data assembled Aug. 19, 2026). View source
- Harris County Appraisal District, 2017 Market Trends Report (Apartment Data Services data), Mar. 3, 2017. View source
- Harris County Appraisal District, 2018 Market Trends Report (Apartment Data Services data), Mar. 23, 2018. View source
- NAHB Eye on Housing (R. Dietz), "Second Quarter Declines for Single-Family Built-to-Rent," Aug. 2026. View source
- RealPage Analytics (C. Brown), "Build-to-Rent Update 2Q 2026: South Region Continues to Lead for Build-to-Rent Development," Sept. 1, 2026. View source
- Kinder Institute for Urban Research, Rice University, "Houston's build-to-rent market keeps growing. Will federal legislation bring it down?" (Zonda data), Mar. 23, 2026. View source
- Freddie Mac, Primary Mortgage Market Survey (week of Oct. 8, 2026). View source
- Latham & Watkins, "21st Century ROAD to Housing Act Becomes Law," July 2026. View source
- NAHB Eye on Housing (J. Wade), "Energy Prices Rise Again in August" (BLS Producer Price Index, inputs to new residential construction), Sept. 10, 2026. View source
- Associated General Contractors of America, "Construction Input Costs Climb 8.9% Between August 2025 and August 2026," Sept. 10, 2026. View source
- Board of Governors of the Federal Reserve System, FOMC Statement, Sept. 16, 2026. View source
- Advisor Perspectives, "Treasury Yields Snapshot: October 9, 2026". View source
- Internal Revenue Service, IR-2026-06, "Treasury, IRS issue guidance on the additional first year depreciation deduction amended as part of the One, Big, Beautiful Bill," Jan. 14, 2026. View source
- Internal Revenue Service, Publication 527 (2025), Residential Rental Property. View source
- Internal Revenue Service, Publication 925 (2025), Passive Activity and At-Risk Rules. View source

For educational purposes only. Not an offer to sell or a solicitation of an offer to buy any security. Any offering will be made only to verified accredited investors under Rule 506(c) of Regulation D through definitive offering documents. Past performance does not guarantee future results.