
Key takeaways from the report
BOTTOM LINE 6 of 6: in every market, permits over the latest 12 months are 29% to 69% below the 2021-23 peak.
Badges: TTM multifamily permits (5+ units) through Aug. 2026 vs. each market's highest year in 2021-2023 (U.S.
Building Permits Survey).1,2,3 Shaded: metro areas on 2023 Census boundaries; Tempe is a city inside metro Phoenix.4
Six markets at a glance
BOTTOM LINE 6 of 6: in every market, permits over the latest 12 months are 29% to 69% below the 2021-23 peak.
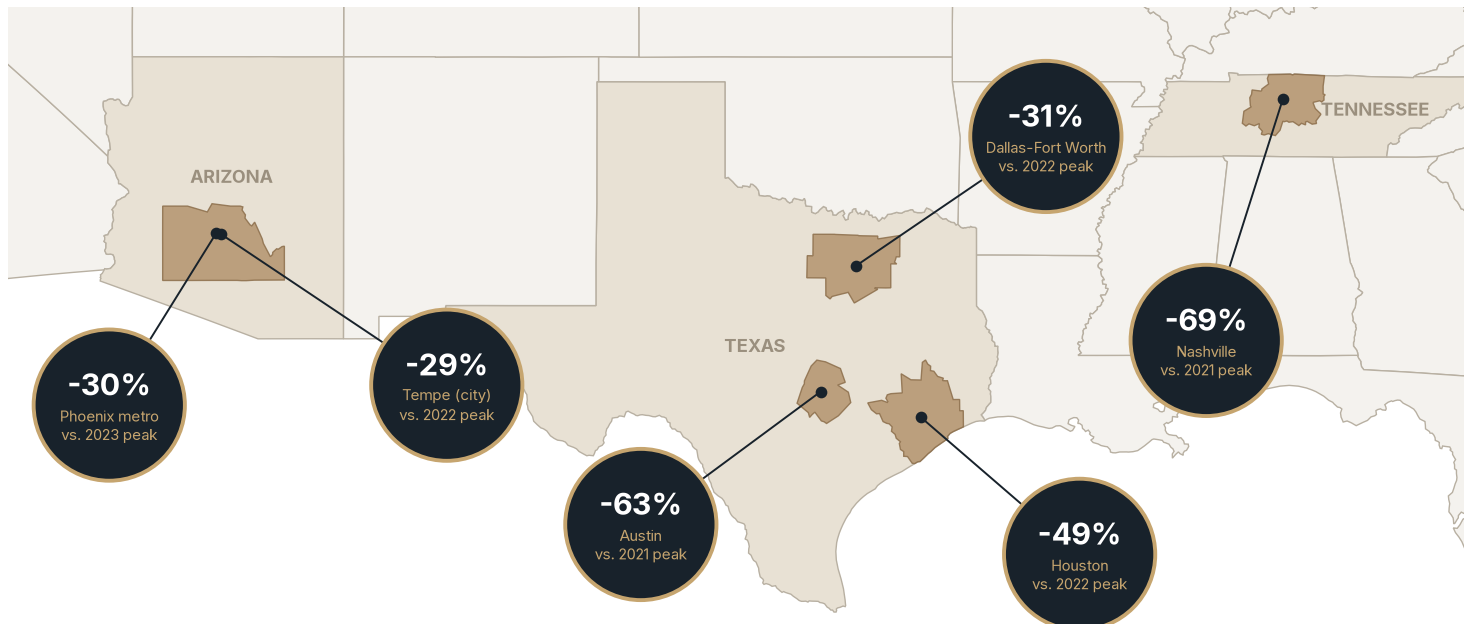
Chart Summary and Key Values
Trailing-12-month multifamily permits through August 2026 versus each market's 2021–2023 peak: Nashville −69%, Austin −63%, Houston −49%, Dallas–Fort Worth −31%, Phoenix metro −30%, and Tempe city −29%. These are changes in permits, not forecasts of rent growth or investment returns.
Badges: TTM multifamily permits (5+ units) through Aug. 2026 vs. each market's highest year in 2021-2023 (U.S. Census Bureau,
Building Permits Survey).1,2,3 Shaded: metro areas on 2023 Census boundaries; Tempe is a city inside metro Phoenix.4
Demand behind the numbers
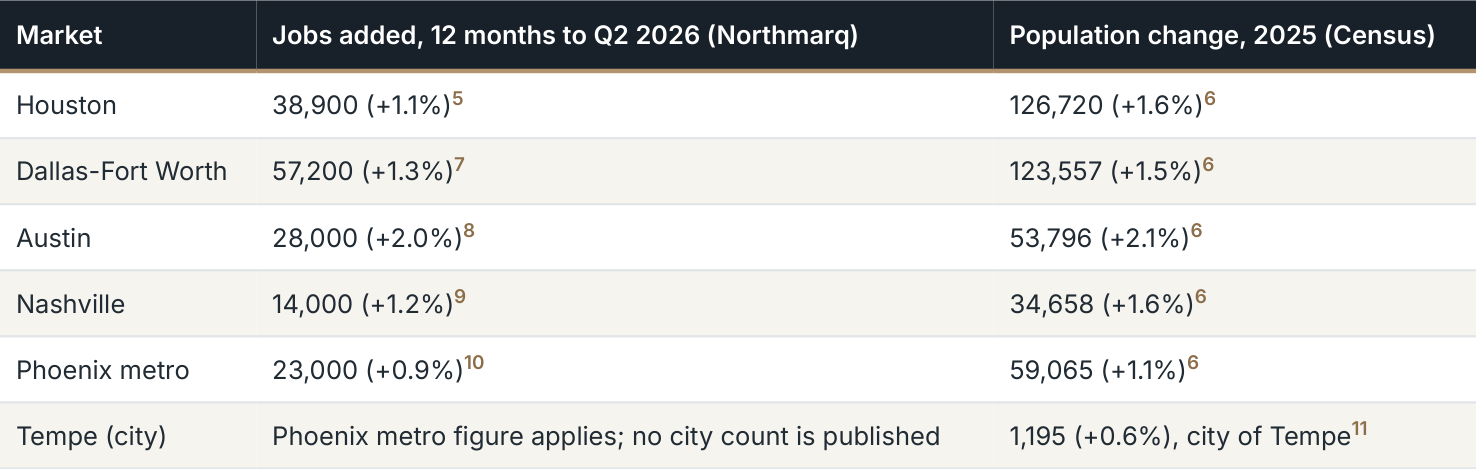
Table Summary and Key Values
| Market | Jobs added, 12 months to Q2 2026 (Northmarq) | Population change, 2025 (Census) |
|---|---|---|
| Houston | 38,900 (+1.1%)5 | 126,720 (+1.6%)6 |
| Dallas-Fort Worth | 57,200 (+1.3%)7 | 123,557 (+1.5%)6 |
| Austin | 28,000 (+2.0%)8 | 53,796 (+2.1%)6 |
| Nashville | 14,000 (+1.2%)9 | 34,658 (+1.6%)6 |
| Phoenix metro | 23,000 (+0.9%)10 | 59,065 (+1.1%)6 |
| Tempe (city) | Phoenix metro figure applies; no city count is published | 1,195 (+0.6%), city of Tempe11 |
All five metros are still adding jobs and residents. Austin leads on growth rates (+2.0% jobs, +2.1% population); Dallas-Fort Worth and Houston add the most people in absolute terms. Population change is July 2024 to July 2025.
Executive summary
Across Texas and the Sun Belt, the apartment construction wave that peaked in 2021-2023 is over. Developers in our six markets pulled permits for units in buildings with five or more units at a far slower pace in the 12 months through August 2026 than at the peak: down 69% in Nashville, 63% in Austin, 49% in Houston, 31% in Dallas-Fort Worth, 30% in metro Phoenix and 29% in the city of Tempe, according to U.S. Census Bureau data.1,2,3 CoStar counts 48,104 starts across the five metros over the past four quarters, 41% below those metros' combined 10-year average for annual deliveries.12,13,14,15,16,17,18,19,20,21
Because a typical apartment project takes about two years or more to build, today's starts are tomorrow's deliveries. Units already scheduled to complete in 2028 are sparse: from 1,862 in Houston to 5,258 in Dallas- Fort Worth, according to Yardi Matrix pipeline data.22,23 Those counts are a floor: projects that start over the next 6-12 months will also deliver in 2028. Nationally, Yardi Matrix expects new supply to bottom out in 2027 at about 444,000 units.24 This scorecard gives each market one page, with every figure attributed to its provider.
What this report is and isn't. This is an educational market overview. It is not an offer to sell, or a solicitation of an offer to buy, any security, and it contains no deal terms or return projections. The Houston yield-on-cost figure is Ascendant's underwriting estimate, labeled as such. Projections are estimates by the named providers or, where labeled "implied," simple extrapolations by Ascendant from published starts data. See the full disclosures at the end.
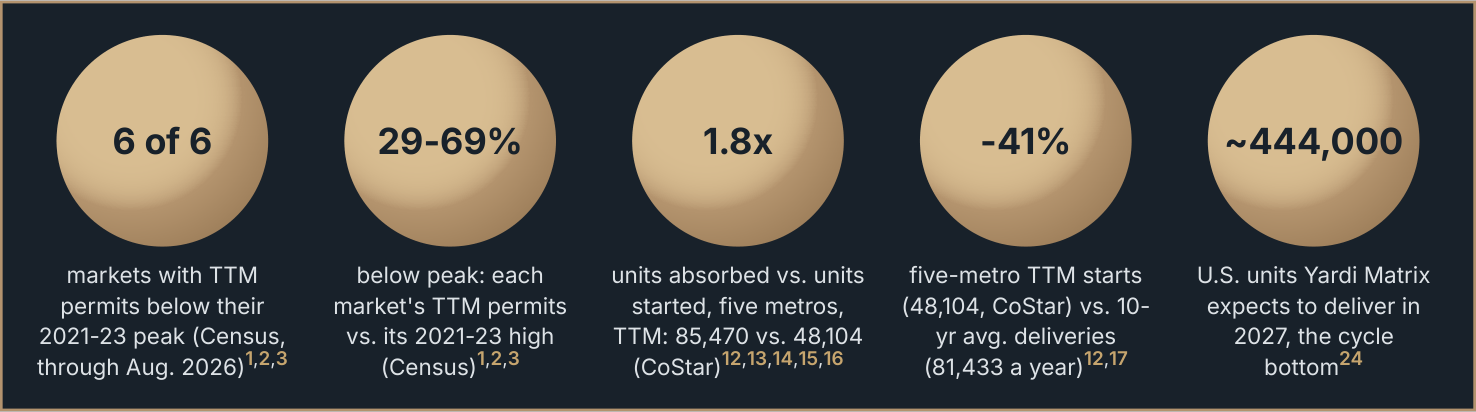
Chart Summary and Key Values
6 of 6 markets have trailing-twelve-month permits below their 2021–23 peak (Census, through Aug. 2026; sources 1–3). Each market's permits are 29–69% below its peak. Across five metros, 85,470 units were absorbed versus 48,104 started: 1.8x (CoStar; sources 12–16). Those 48,104 starts are 41% below average annual deliveries of 81,433 over ten years (sources 12 and 17). Yardi Matrix expects about 444,000 U.S. deliveries in 2027, the cycle bottom (source 24).
Headline findings
The thesis holds in all six markets. Every market's permit pace is 29% to 69% below its 2021-23 peak. Nashville's 2022 Census count is an outlier, so we measure it from its 2021 peak; CoStar shows its starts 63% below their 2022 record.1,2,15,25
Texas and Nashville show the deepest cuts. Austin and Nashville permits are down about two-thirds from 2021; Houston's about half from 2022.1,2
Demand is absorbing the last wave. Over four quarters, absorption beat new starts in all five metros and beat completions in Austin, Nashville and Phoenix (CoStar via MMG).12,14,15,16
The watch item is the East Valley. Tempe's scheduled pipeline empties after 2027. East Valley permits (4,434 TTM) are 28% below the 2021 level of 6,181, but they rose 51% year to date in 2026 (2,106 vs. 1,397).3,26
Demand is outrunning new starts
BOTTOM LINE In all five metros, more units were absorbed over the past year than were started: 85,470 vs. 48,104 combined, about 1.8x.
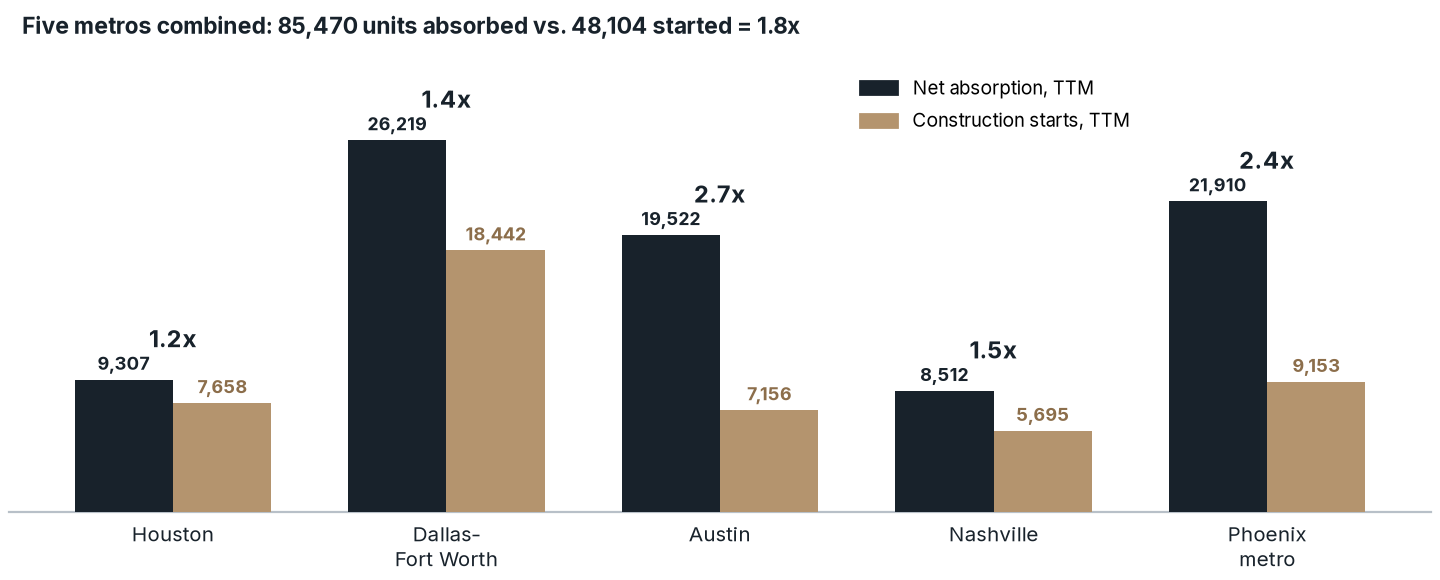
Chart Summary and Key Values
Trailing-12-month net absorption versus construction starts: Houston 9,307 versus 7,658 (1.2×); Dallas–Fort Worth 26,219 versus 18,442 (1.4×); Austin 19,522 versus 7,156 (2.7×); Nashville 8,512 versus 5,695 (1.5×); Phoenix metro 21,910 versus 9,153 (2.4×). Five metros combined: 85,470 units absorbed versus 48,104 started, or 1.8×.
Net absorption and construction starts, trailing four quarters to Q2 2026 (CoStar via MMG).12,13,14,15,16 Tempe is not shown: no Tempe-
only absorption or starts figures are published.
A caveat. Last year's absorption was helped by lease-up concessions: owners of the 2024-2025 wave of new properties offered free rent to fill units. In Phoenix, concessions averaged 8.4% of yearly effective rent in Q2 2026, near an all-time high (Cushman & Wakefield).27 Combined demand would have to fall by about 44% to match today's pace of starts.
Absorption vs. completions, by market
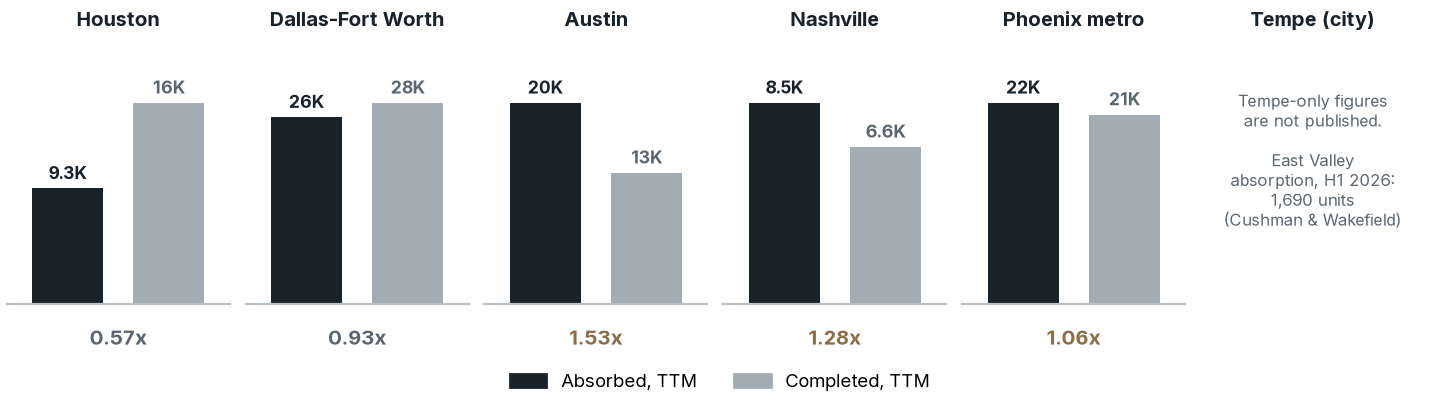
Chart Summary and Key Values
Rounded trailing-12-month absorption versus completions: Houston 9.3K versus 16K (0.57×); Dallas–Fort Worth 26K versus 28K (0.93×); Austin 20K versus 13K (1.53×); Nashville 8.5K versus 6.6K (1.28×); Phoenix metro 22K versus 21K (1.06×). Comparable Tempe-only figures are not published; the chart distinguishes Tempe from the broader East Valley.
Units absorbed vs. units completed, trailing four quarters to Q2 2026 (CoStar via MMG).12,13,14,15,16 East Valley absorption: Cushman &
Wakefield.27
Absorption beat completions in Austin (1.53x), Nashville (1.28x) and Phoenix (1.06x). Houston (0.57x) and Dallas-Fort Worth (0.93x) are still absorbing the last wave of deliveries, but with starts well below absorption in both, that gap narrows as deliveries fall.
Methodology and definitions
BOTTOM LINE One starts proxy for every market (Census permits), with provider data shown alongside, each labeled. Percent changes are computed only within the same source.
Why permits are the common yardstick. Providers disagree widely on how many units started in 2022. For Austin, RealPage data put 2022 starts at 24,371,28 while Yardi Matrix data reported by Multi-Housing News show 32,863.29 To compare markets on an equal footing, we use the U.S. Census Bureau's Building Permits Survey for every market and both periods. Provider starts are shown on each scorecard with the provider named, and we never compute a change using one provider's peak and another's current figure. Nevertheless, permits do not guarantee that a project will be capitalized and actually initiated, so actual starts should be lower than permitted projects by some varying amount.
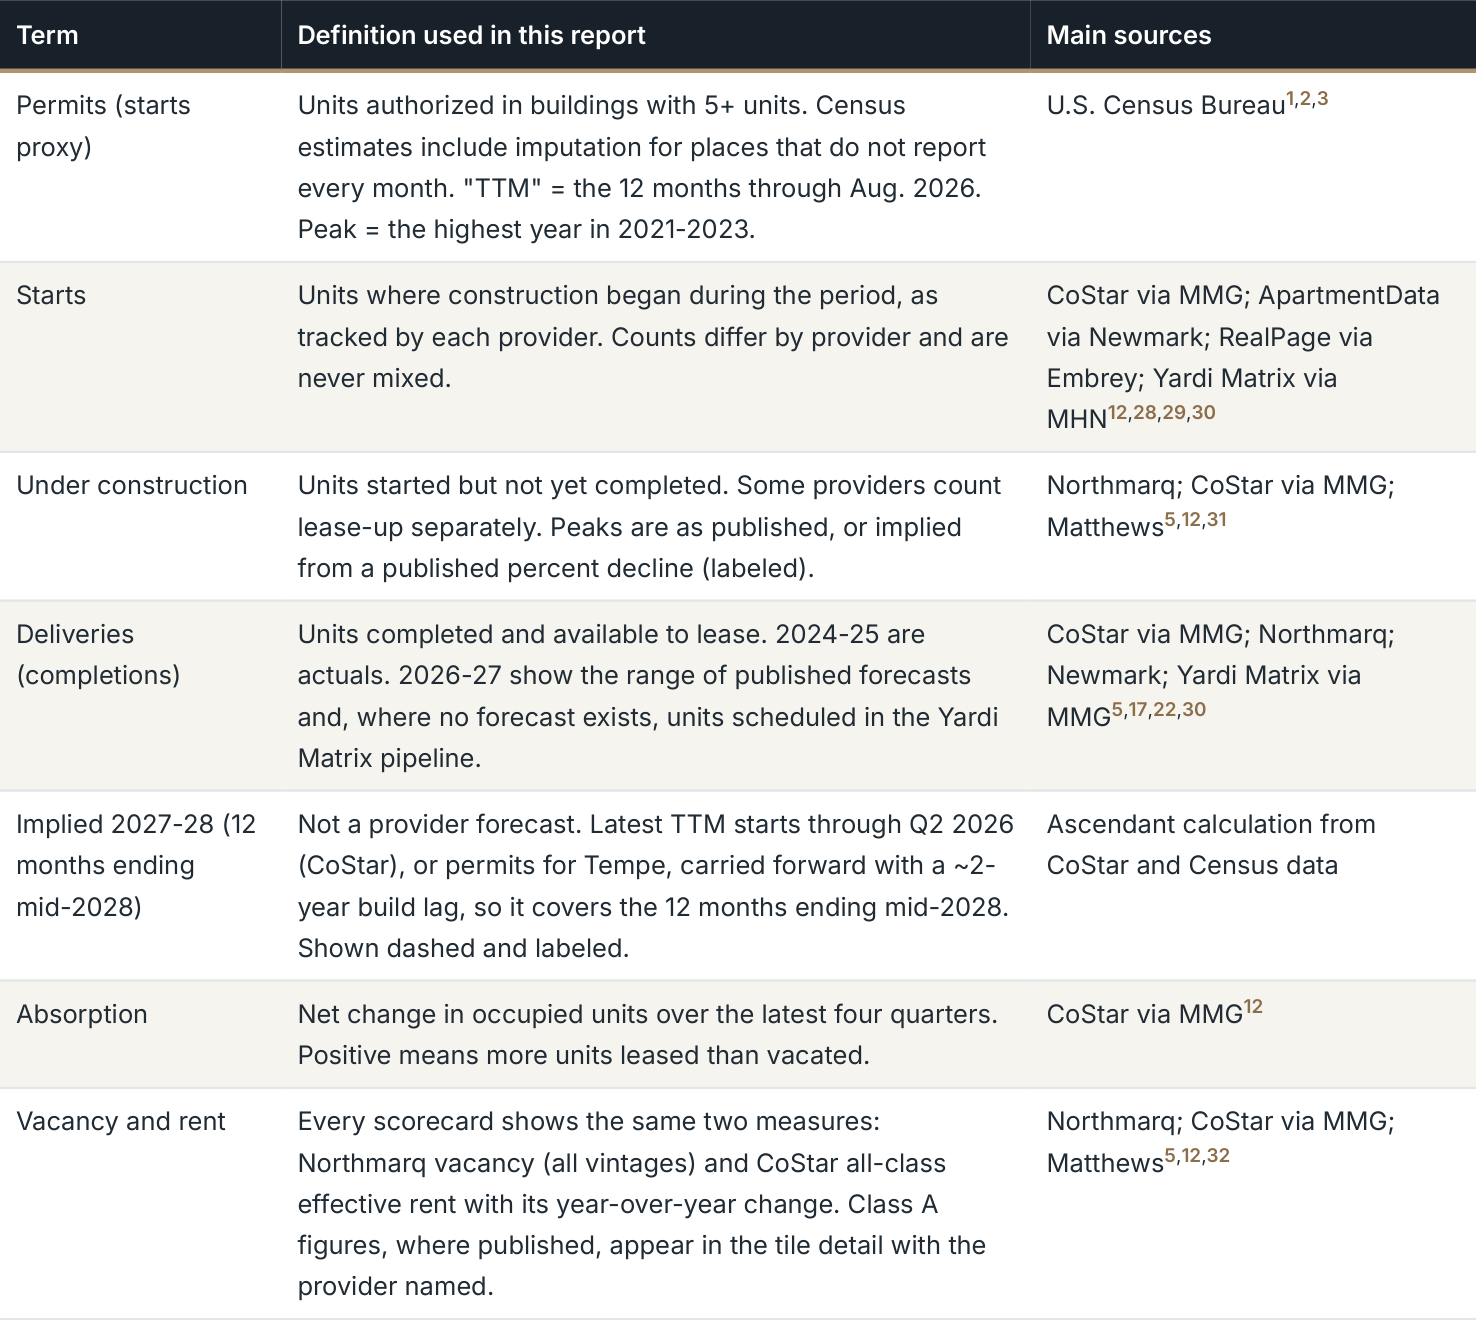
Table Summary and Key Values
| Term | Definition used in this report | Main sources |
|---|---|---|
| Permits (starts proxy) | Units authorized in buildings with 5+ units. Census estimates include imputation for places that do not report every month. "TTM" = the 12 months through Aug. 2026. Peak = the highest year in 2021-2023. | U.S. Census Bureau1,2,3 |
| Starts | Units where construction began during the period, as tracked by each provider. Counts differ by provider and are never mixed. | CoStar via MMG; ApartmentData via Newmark; RealPage via Embrey; Yardi Matrix via MHN12,28,29,30 |
| Under construction | Units started but not yet completed. Some providers count lease-up separately. Peaks are as published, or implied from a published percent decline (labeled). | Northmarq; CoStar via MMG; Matthews5,12,31 |
| Deliveries (completions) | Units completed and available to lease. 2024-25 are actuals. 2026-27 show the range of published forecasts and, where no forecast exists, units scheduled in the Yardi Matrix pipeline. | CoStar via MMG; Northmarq; Newmark; Yardi Matrix via MMG5,17,22,30 |
| Implied 2027-28 (12 months ending mid-2028) | Not a provider forecast. Latest TTM starts through Q2 2026 (CoStar), or permits for Tempe, carried forward with a ~2- year build lag, so it covers the 12 months ending mid-2028. Shown dashed and labeled. | Ascendant calculation from CoStar and Census data |
| Absorption | Net change in occupied units over the latest four quarters. Positive means more units leased than vacated. | CoStar via MMG12 |
| Vacancy and rent | Every scorecard shows the same two measures: Northmarq vacancy (all vintages) and CoStar all-class effective rent with its year-over-year change. Class A figures, where published, appear in the tile detail with the provider named. | Northmarq; CoStar via MMG; Matthews5,12,32 |
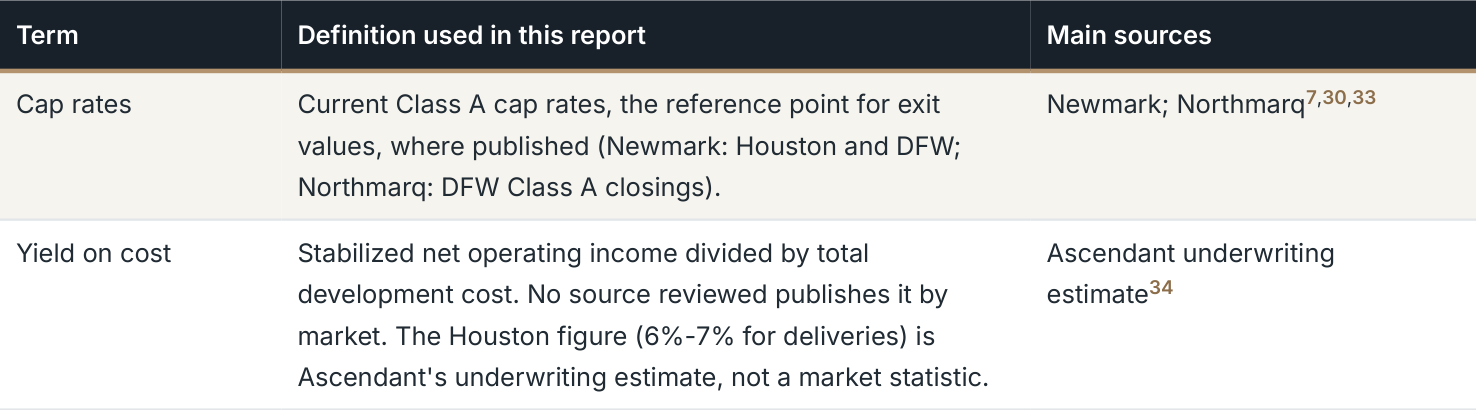
Table Summary and Key Values
| Term | Definition used in this report | Main sources |
|---|---|---|
| Cap rates | Current Class A cap rates, the reference point for exit values, where published (Newmark: Houston and DFW; Northmarq: DFW Class A closings). | Newmark; Northmarq7,30,33 |
| Yield on cost | Stabilized net operating income divided by total development cost. No source reviewed publishes it by market. The Houston figure (6%-7% for deliveries) is Ascendant's underwriting estimate, not a market statistic. | Ascendant underwriting estimate34 |
Geography. Metro figures use each market's metropolitan statistical area, including its suburbs. Census redrew metro areas in July 2023, so 2021-2023 and 2024-2026 permits come from different Census file series.1,2 We checked county composition. Austin's five counties and the Dallas-Fort Worth and Phoenix definitions are unchanged. Houston added only San Jacinto County and Nashville only Hickman County, and neither reported any permits for 5+ unit buildings in 2021-2025, so each peak-to-TTM comparison covers comparable counties.35 County files also put Nashville's 2022 total at 12,594 rather than the metro file's 3,183, which confirms the metro figure is an outlier; the 2021 peak (13,992) is higher under either count.35 Tempe is shown as a city because no provider publishes a Tempe submarket forecast. All data are the latest published as of Oct. 11, 2026, mostly Q2 2026.
Heat map thresholds
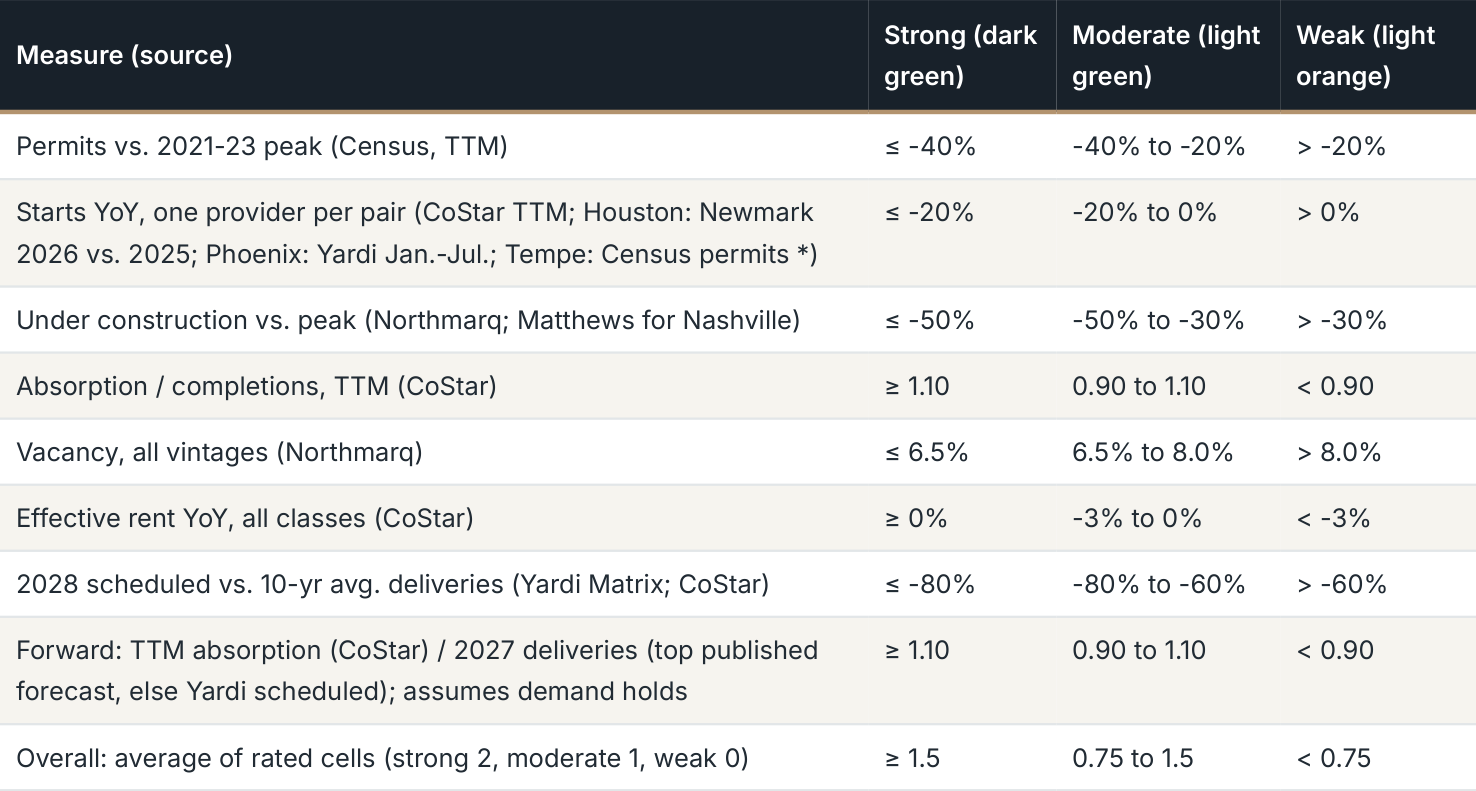
Table Summary and Key Values
| Measure (source) | Strong (dark green) | Moderate (light green) | Weak (light orange) |
|---|---|---|---|
| Permits vs. 2021-23 peak (Census, TTM) | ≤ -40% | -40% to -20% | > -20% |
| Starts YoY, one provider per pair (CoStar TTM; Houston: Newmark 2026 vs. 2025; Phoenix: Yardi Jan.-Jul.; Tempe: Census permits *) | ≤ -20% | -20% to 0% | > 0% |
| Under construction vs. peak (Northmarq; Matthews for Nashville) | ≤ -50% | -50% to -30% | > -30% |
| Absorption / completions, TTM (CoStar) | ≥ 1.10 | 0.90 to 1.10 | < 0.90 |
| Vacancy, all vintages (Northmarq) | ≤ 6.5% | 6.5% to 8.0% | > 8.0% |
| Effective rent YoY, all classes (CoStar) | ≥ 0% | -3% to 0% | < -3% |
| 2028 scheduled vs. 10-yr avg. deliveries (Yardi Matrix; CoStar) | ≤ -80% | -80% to -60% | > -60% |
| Forward: TTM absorption (CoStar) / 2027 deliveries (top published forecast, else Yardi scheduled); assumes demand holds | ≥ 1.10 | 0.90 to 1.10 | < 0.90 |
| Overall: average of rated cells (strong 2, moderate 1, weak 0) | ≥ 1.5 | 0.75 to 1.5 | < 0.75 |
Grey cells are measures not published for that market and are excluded from its average. Strong means the measure favors thin 2027-28 deliveries or healthy lease-up; this is a screen, not a forecast.
M A R K E T S C O R E C A R D 1 O F 6 Houston
Houston-Pasadena-The Woodlands MSA, including suburban Harris, Fort Bend and Montgomery counties. Census permits: metro
(CBSA 26420).
PERMITS, 5+ UNITS -49%
STARTS, TTM 7,658
UNDER CONSTRUCTION -57%
27,156 in 2022 (peak) to 13,772 in the 12 months to Aug. 2026 (Census)1,2
units through Q2 2026 (CoStar via MMG; year-ago figure not published).12 Newmark (RealPage): 8,733 projected for 2026, -31% vs. 12,616 in 2025 and -60% vs. 21,991 in 202230
~13,300 now vs. ~30,700 at the Q1 2023 peak (Northmarq; peak implied from its Q4 2024 report)5,36
ABSORPTION VS. COMPLETIONS, TTM 9,307
VACANCY, ALL VINTAGES 7.1%
EFFECTIVE RENT, ALL CLASSES $1,307
Q2 2026 (Northmarq); Class A vacancy 8.1%.5 CoStar all-class occupancy 88.7%, incl. lease-up12
Q2 2026, -2.3% YoY (CoStar via MMG).12
units absorbed vs. 16,210 completed, four quarters to Q2 2026 (CoStar via MMG)12
Class A asking rent $1,629, +1.4% YoY (Northmarq)5
DELIVERIES: ACTUAL AND PROJECTED
PROJECTED DELIVERIES, WITH SOURCES
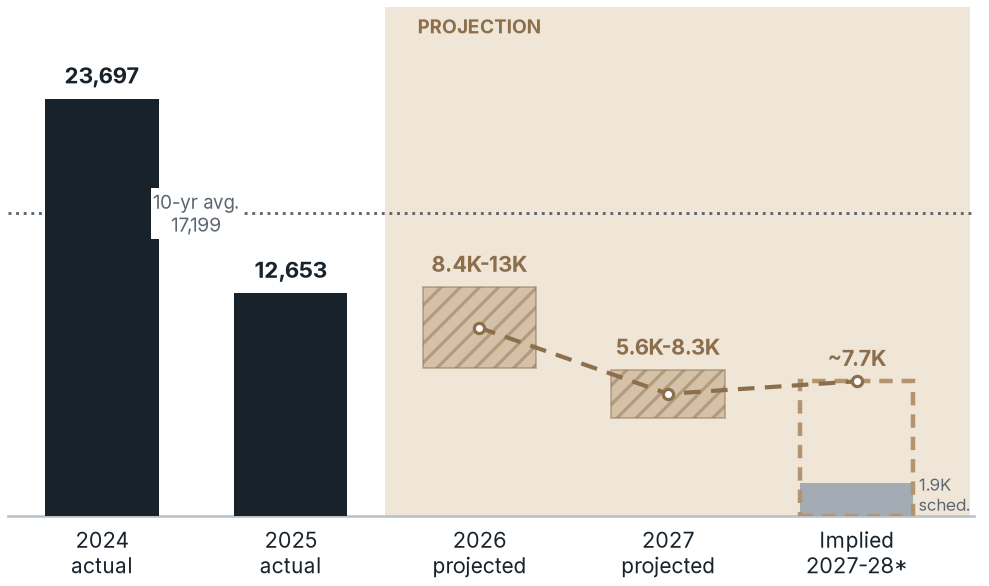
Chart Summary and Key Values
Houston deliveries: 23,697 actual units in 2024 and 12,653 in 2025. The chart projects 8.4K–13K for 2026 and 5.6K–8.3K for 2027, versus a 10-year average of 17,199. The implied 2027–2028 level is approximately 7.7K; 1.9K units are scheduled. Projected, implied and scheduled figures are different measures, not guaranteed outcomes.
Year Units Basis and source
2026 8,401 to ~13,000 Forecasts: CoStar via MMG 8,401;17
Newmark 11,893;30 Northmarq ~13,0005
2027 ~5,600 to 8,293 Northmarq ~5,600 (preliminary), "the lowest annual completions total in nearly 15 years";5 Newmark 7,927;30
8,293 scheduled (Yardi Matrix)22
2028 ~7,700 implied Implied 2027-28 (12 months ending mid-2028) from 7,658 TTM starts, ~2- year lag; no published forecast.12
Navy: actual completions (CoStar via MMG).17,37 Hatched: 2026-27 range of published forecasts and scheduled units (table at right). 2028: grey = units already scheduled (Yardi Matrix), a floor;22 dashed = implied 2027-28 (12 months ending mid-2028) from today's starts with a ~2-year lag, not a forecast. Dotted line: 10-year average.
Scheduled so far: 1,862 (Yardi Matrix), a floor22
Demand. Employers added 38,900 jobs (+1.1%) in the 12 months to Q2 2026 (Northmarq),5 and the metro gained 126,720 residents (+1.6%) in 2025 (Census).6 Suburbs: Transwestern counts 83% of units under construction in suburban areas.38 Matthews puts units under construction at just 2.63% of inventory.31
BOTTOM LINE Permits are down by about half from 2022, and published 2027 forecasts and scheduled units sit 52% to 67% below the 10-year average of 17,199 deliveries a year.
M A R K E T S C O R E C A R D 2 O F 6 Dallas-Fort Worth Dallas-Fort Worth-Arlington MSA, including Collin, Denton, Tarrant and other suburban counties. Census permits: metro (CBSA 19100).
PERMITS, 5+ UNITS -31%
STARTS, TTM 18,442
UNDER CONSTRUCTION -43%
32,650 in 2022 (peak) to 22,489 in the 12 months to Aug. 2026 (Census)1,2
through Q2 2026, vs. 28,572 a year earlier (CoStar via MMG).13 CoStar counted about 42,000 starts in 2022, so TTM is ~56% lower39
43,300 now, 43% below the 2023 peak (Northmarq; implied peak ~76,000)7
ABSORPTION VS. COMPLETIONS, TTM 26,219
VACANCY, ALL VINTAGES 6.2%
EFFECTIVE RENT, ALL CLASSES $1,460
Q2 2026 (Northmarq).7 CoStar all-class occupancy 90.1%, incl. lease-up13
Q2 2026, -2.8% YoY (CoStar via MMG).13
units absorbed vs. 28,232 completed, four quarters to Q2 2026 (CoStar via MMG)13
Class A asking rent $1,987, +2.2% YoY (Northmarq)7
DELIVERIES: ACTUAL AND PROJECTED
PROJECTED DELIVERIES, WITH SOURCES
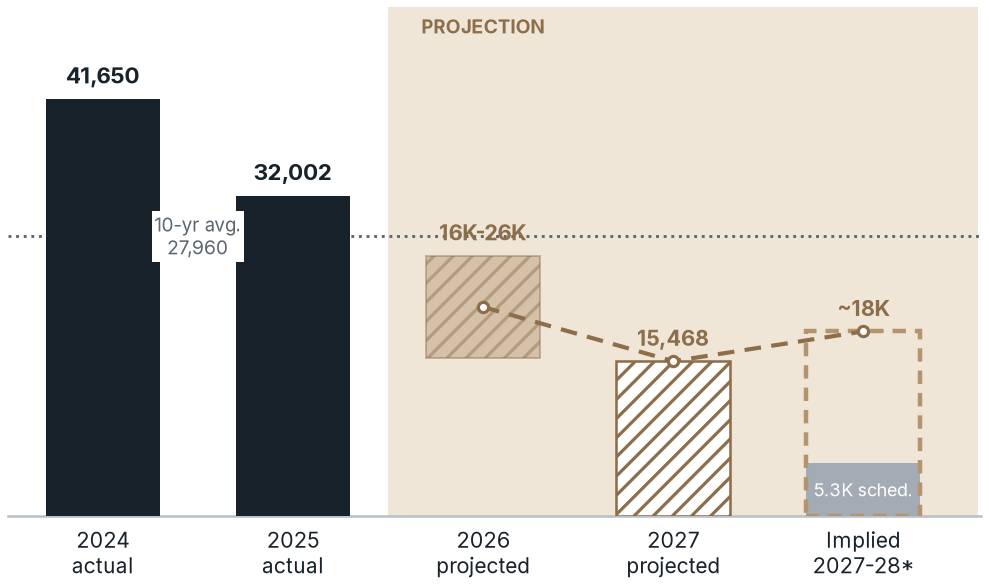
Chart Summary and Key Values
Dallas–Fort Worth deliveries: 41,650 actual units in 2024 and 32,002 in 2025. The chart shows 16K–26K projected for 2026, 15,468 projected for 2027, and approximately 18K implied for 2027–2028, including 5.3K scheduled units. The 10-year average is 27,960. These projections differ from actual deliveries and scheduled-only counts.
Year Units Basis and source
2026 15,765 to ~26,000 Forecasts: CoStar via MMG 15,765;18
Transwestern 22,143;41 Colliers 22,963;42 Northmarq ~26,0007
2027 15,468 scheduled 15,468 units scheduled for 2027 (Yardi Matrix); no calendar-2027 forecast found.23 Transwestern's 24,133 covers the next 12 months (Q3 2026-Q2 2027)43
2028 ~18,400 implied Implied 2027-28 (12 months ending mid-2028) from 18,442 TTM starts, ~2-year lag; no published forecast.13
Navy: actual completions (CoStar via MMG).18,40 Hatched: 2026-27 range of published forecasts and scheduled units (table at right). 2028: grey = units already scheduled (Yardi Matrix), a floor;23 dashed = implied 2027-28 (12 months ending mid-2028) from today's starts with a ~2-year lag, not a forecast. Dotted line: 10-year average.
Scheduled so far: 5,258 (Yardi Matrix), a floor23
Demand. Payrolls grew by 57,200 jobs (+1.3%) in the 12 months to Q2 2026 (Northmarq),7 and the metro gained 123,557 residents (+1.5%) in 2025 (Census).6 Suburbs: about 30% of the pipeline is in Frisco and Allen/McKinney (Northmarq).7 Matthews puts units under construction at 4.32% of inventory, down from 8.54% in Q1 2023.44
BOTTOM LINE DFW still has the largest pipeline of the six, but CoStar starts fell 35% in a year and only 5,258 units are scheduled for 2028.
M A R K E T S C O R E C A R D 3 O F 6 Austin Austin-Round Rock-San Marcos MSA, including Williamson and
Hays counties. Census permits: metro (CBSA 12420).
PERMITS, 5+ UNITS -63%
STARTS, TTM 7,156
UNDER CONSTRUCTION -46%
25,539 at the 2021 peak to 9,338 in the 12 months to Aug. 2026; -58% vs. 22,157 in 2022 (Census)1,2
through Q2 2026, vs. 12,107 a year earlier, -41% (CoStar via MMG).14 RealPage data put 2022 starts at 24,37128
~18,100 now, 46% below the 2024 high (Northmarq; implied peak ~33,500).8 Matthews: 4.55% of inventory vs. 19.67% in Q1 202332
ABSORPTION VS. COMPLETIONS, TTM 19,522
VACANCY, ALL VINTAGES 10.3%
EFFECTIVE RENT, ALL CLASSES $1,412
Q2 2026, -4.2% YoY (CoStar via MMG).14
Q2 2026, highest of the five metros (Northmarq); stabilized Class A 13.0%.8
units absorbed vs. 12,726 completed, four quarters to Q2 2026 (CoStar via MMG)14
Class A effective rent $1,420, +1.9% in Q2 (Northmarq reports effective, not asking, rents for Austin)8
CoStar occupancy 89.8%14
DELIVERIES: ACTUAL AND PROJECTED
PROJECTED DELIVERIES, WITH SOURCES
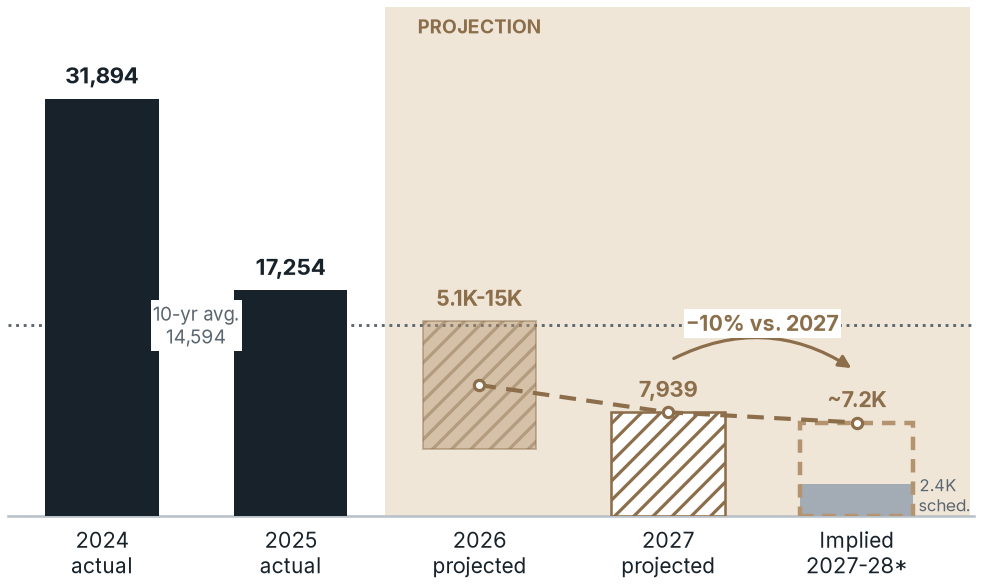
Chart Summary and Key Values
Austin deliveries: 31,894 actual units in 2024 and 17,254 in 2025. The chart projects 5.1K–15K for 2026 and 7,939 for 2027. The implied 2027–2028 level is approximately 7.2K, 10% below 2027, with 2.4K units scheduled. The 10-year average is 14,594; the projected and implied figures are illustrative, not actual results.
Year Units Basis and source
2026 5,137 to 14,900 Forecasts: CoStar via MMG 5,137;19
Northmarq 14,900. Northmarq counted ~6,300 delivered in the first half alone, so methods differ8
2027 7,939 scheduled No published forecast found. 7,939 units scheduled for 2027 (Yardi Matrix)46
2028 ~7,200 implied Implied 2027-28 (12 months ending mid-2028) from 7,156 TTM starts, ~2- year lag; no published forecast.14
Navy: actual completions (CoStar via MMG).19,45 Hatched: 2026-27 range of published forecasts and scheduled units (table at right). 2028: grey = units already scheduled (Yardi Matrix), a floor;46 dashed = implied 2027-28 (12 months ending mid-2028) from today's starts with a ~2-year lag, not a forecast. Dotted line: 10-year average.
Scheduled so far: 2,426 (Yardi Matrix), a floor46
Demand. Employers added roughly 28,000 jobs (+2.0%) in the 12 months to Q2 2026 (Northmarq),8 and the metro gained 53,796 residents (+2.1%) in 2025 (Census).6 Absorption outran completions by about 6,800 units over four quarters, but vacancy is still the highest of the five metros.14
BOTTOM LINE Austin's permits are down 63% from the 2021 peak and CoStar starts fell 41% in a year; the market is still working through vacancy, but the 2027-28 pipeline is thin.
M A R K E T S C O R E C A R D 4 O F 6 Nashville
Nashville-Davidson-Murfreesboro-Franklin MSA, including Williamson, Rutherford, Wilson and Sumner counties. Census
permits: metro (CBSA 34980).
PERMITS, 5+ UNITS -69%
STARTS, TTM 5,695
UNDER CONSTRUCTION 5.5%
13,992 at the 2021 peak to 4,404 in the 12 months to Aug. 2026 (Census).1,2 Census reports only 3,183 for 2022; see note
through Q2 2026, vs. 7,575 a year earlier (CoStar via MMG).15 That is 63% below CoStar's record 15,400 starts in 202225
of inventory, down from a 15.87% peak in Q3 2022 (Matthews).47 Northmarq counts ~10,500 units, -18% YoY;9 a peak unit count is not published
ABSORPTION VS. COMPLETIONS, TTM 8,512
VACANCY, ALL VINTAGES 7.8%
EFFECTIVE RENT, ALL CLASSES $1,586
Q2 2026 (Northmarq).9 CoStar all-class occupancy 92.3%, highest of the five metros, incl. lease-up15
Q2 2026, -2.8% YoY (CoStar via MMG).15
units absorbed vs. 6,645 completed, four quarters to Q2 2026 (CoStar via MMG)15
Class A asking rent $1,948, flat YoY (Northmarq)9
DELIVERIES: ACTUAL AND PROJECTED
PROJECTED DELIVERIES, WITH SOURCES
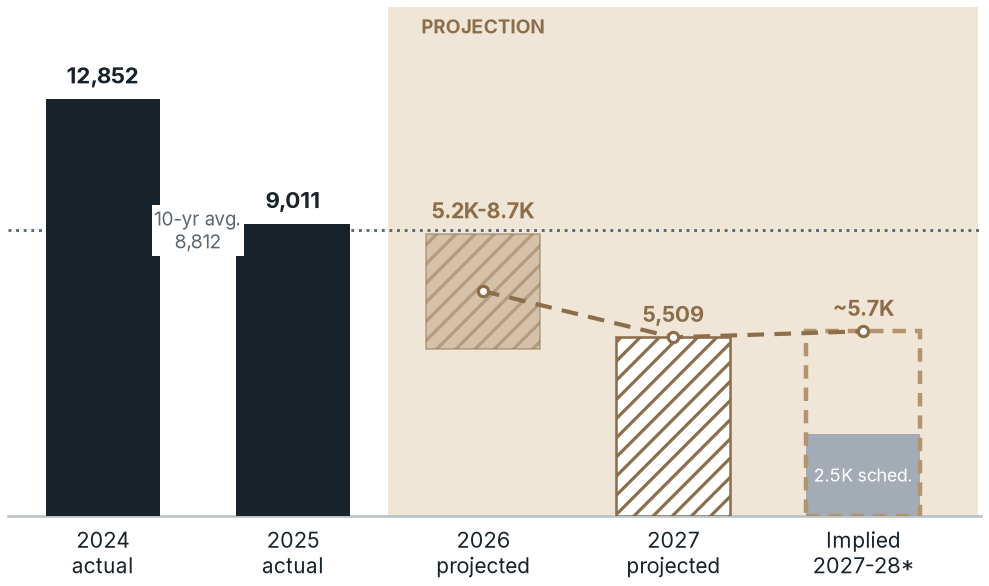
Chart Summary and Key Values
Nashville deliveries: 12,852 actual units in 2024 and 9,011 in 2025. The chart projects 5.2K–8.7K for 2026 and 5,509 for 2027. The implied 2027–2028 level is approximately 5.7K, with 2.5K scheduled units. The 10-year average is 8,812. Scheduled, projected and implied figures must not be treated as the same series.
Year Units Basis and source
2026 5,164 to ~8,700 Forecasts: Matthews 5,164;47 CoStar via MMG 6,020;20 Northmarq ~8,7009
2027 5,509 scheduled No published forecast found. 5,509 units scheduled for 2027 (Yardi Matrix)48
2028 ~5,700 implied Implied 2027-28 (12 months ending mid-2028) from 5,695 TTM starts, ~2- year lag; no published forecast.15
Scheduled so far: 2,532 (Yardi Matrix), a floor48
Navy: actual completions (CoStar via MMG).20,25 Hatched: 2026-27 range of published forecasts and scheduled units (table at right). 2028: grey = units already scheduled (Yardi Matrix), a floor;48 dashed = implied 2027-28 (12 months ending mid-2028) from today's starts with a ~2-year lag, not a forecast. Dotted line: 10-year average.
Demand. Employers added 14,000 jobs (+1.2%) in the 12 months to Q2 2026 (Northmarq),9 and the metro gained 34,658 residents (+1.6%) in 2025 (Census).6 Data note: the Census metro file reports 3,183 permits for 2022, far below 2021 (13,992) and 2023 (9,597), while CoStar records 2022 as a record year for starts and Census county files sum to 12,594.2,25,35 We treat it as an outlier and measure from the 2021 peak.
BOTTOM LINE Nashville's starts are down about two-thirds from the 2021-22 peak, and occupancy is already the highest of the five metros.
M A R K E T S C O R E C A R D 5 O F 6 Phoenix metro Phoenix-Mesa-Chandler MSA (Maricopa and Pinal counties).
Census permits: metro (CBSA 38060).
PERMITS, 5+ UNITS -30%
STARTS, TTM 9,153
UNDER CONSTRUCTION -46%
18,932 at the 2023 peak to 13,184 in the 12 months to Aug. 2026; -30% vs. 18,748 in 2022 (Census)1,2
units through Q2 2026 (CoStar via MMG; year-ago figure not published).16 Yardi Matrix: starts +6% YoY, Jan.-Jul. 202649
~23,100 now, 46% below the end-2023 peak and 27% lower YoY (Northmarq; implied peak ~42,800)10
ABSORPTION VS. COMPLETIONS, TTM 21,910
VACANCY, ALL VINTAGES 6.6%
EFFECTIVE RENT, ALL CLASSES $1,440
Q2 2026, lowest since early 2023 (Northmarq).10 CoStar all-class occupancy 91.3%, incl. lease-up16
Q2 2026, -4.6% YoY (CoStar via MMG).16
units absorbed vs. 20,636 completed, four quarters to Q2 2026 (CoStar via MMG)16
Concessions: 8.4% of yearly effective rent, near an all-time high; avg. asking $1,592 (Cushman & Wakefield)27
DELIVERIES: ACTUAL AND PROJECTED
PROJECTED DELIVERIES, WITH SOURCES
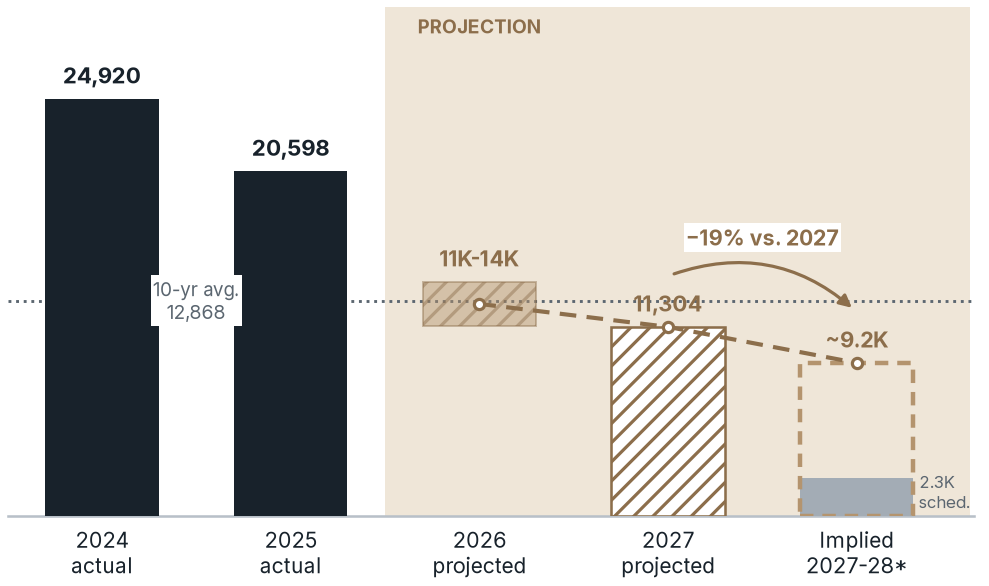
Chart Summary and Key Values
Phoenix metro deliveries: 24,920 actual units in 2024 and 20,598 in 2025. The chart projects 11K–14K for 2026 and 11,304 for 2027. The implied 2027–2028 level is approximately 9.2K, 19% below 2027, with 2.3K scheduled units. The 10-year average is 12,868. Future figures are not guaranteed.
Year Units Basis and source
2026 11,356 to ~14,000 Forecasts: CoStar via MMG 11,356;21
Northmarq ~14,00010
2027 11,304 scheduled No published forecast found. 11,304 units scheduled for 2027 (Yardi Matrix)26
2028 ~9,200 implied Implied 2027-28 (12 months ending mid-2028) from 9,153 TTM starts, ~2- year lag; no published forecast.16
Scheduled so far: 2,280 (Yardi Matrix), a floor26
Navy: actual completions (CoStar via MMG).21,50 Hatched: 2026-27 range of published forecasts and scheduled units (table at right). 2028: grey = units already scheduled (Yardi Matrix), a floor;26 dashed = implied 2027-28 (12 months ending mid-2028) from today's starts with a ~2-year lag, not a forecast. Dotted line: 10-year average.
Demand. Employment rose by 23,000 jobs (+0.9%) in the 12 months to Q2 2026 (Northmarq),10 and the metro gained 59,065 residents (+1.1%) in 2025 (Census).6 Permit definitions differ: Northmarq counts about 3,600 multifamily permits in the first half of 2026 (-38% YoY) on its own basis;10 Census counts 4,574 units in 5+ unit buildings for the same six months (-21% vs. 5,824), and the 13,184 shown here is a 12-month Census total.1
BOTTOM LINE Phoenix's permit decline is milder than in Texas or Nashville, but its pipeline is down 46% from peak while demand runs at a record pace.
M A R K E T S C O R E C A R D 6 O F 6 Tempe / East Valley
City of Tempe (Census place-level permits), with East Valley context: Tempe, Mesa, Chandler, Gilbert, Queen Creek and Apache
Junction.
PERMITS, TEMPE -29%
PERMITS, EAST VALLEY -28%
PIPELINE, TEMPE 812
1,627 in 2022 (peak) to 1,158 in the 12 months to Aug. 2026. Census estimates; Tempe's monthly values are imputed3
4,434 TTM across six cities, 28% below the 2021 level of 6,181 (peak). Year to date, permits rose 51%: 2,106 vs. 1,397 a year earlier3
units under construction plus 1,559 in lease-up, Aug. 2026 (Yardi Matrix via MMG)26
ABSORPTION, EAST VALLEY 1,690
VACANCY, SOUTH TEMPE AREA 4.8-5.3%
EFFECTIVE RENT, METRO $1,440
units, first half of 2026 (Cushman & Wakefield); the closest published figure for Tempe27
Ahwatukee, Chandler and South Tempe, Q2 2026, stabilized, all vintages (Northmarq); the closest published figure10
Q2 2026, -4.6% YoY, all classes, Phoenix metro (CoStar via MMG).16 Metro concessions: 8.4% of effective rent (Cushman & Wakefield)27
DELIVERIES: ACTUAL AND PROJECTED
PROJECTED DELIVERIES, WITH SOURCES
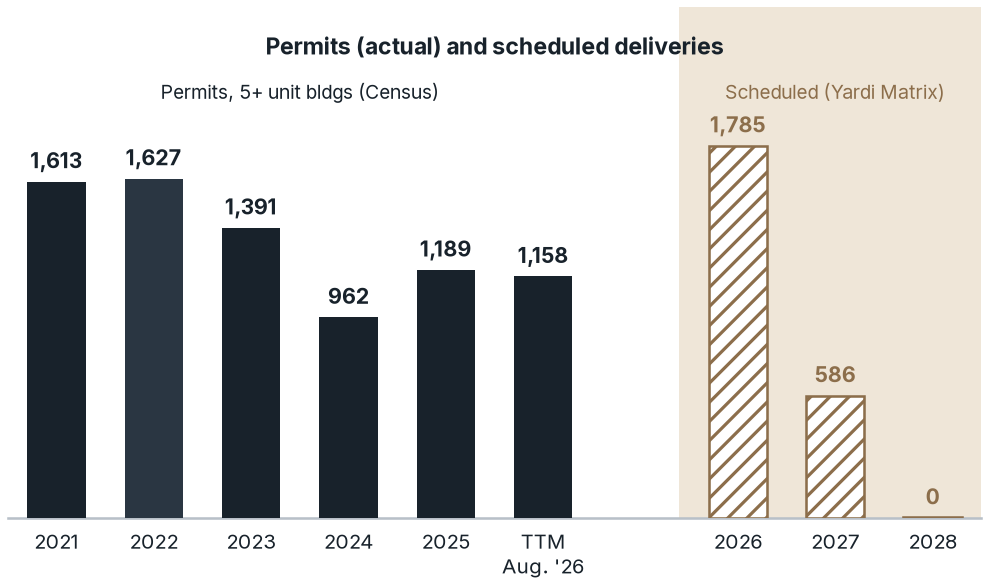
Chart Summary and Key Values
Tempe city multifamily permits in buildings of five or more units: 1,613 in 2021; 1,627 in 2022; 1,391 in 2023; 962 in 2024; 1,189 in 2025; and 1,158 in the trailing 12 months through August 2026. Separately, scheduled Yardi Matrix deliveries are 1,785 in 2026, 586 in 2027 and 0 in 2028. Permits and scheduled deliveries are not interchangeable.
Year Units Basis and source
2026 1,785 scheduled Tempe units scheduled for 2026 (Yardi Matrix);26 Cushman & Wakefield counts more than 1,000 delivered year to date27
2027 0 to 586 Only The Pier (586 units) remains: Yardi Matrix dates it May 2027;26
Kidder Mathews lists Pier 202 for 4Q2651
2028 ~1,200 implied Implied 2027-28 (12 months ending mid-2028) from 1,158 TTM permits; no forecast.3 0 scheduled so far (East Valley: 1,329)26
Navy: Tempe permits for units in 5+ unit buildings, 2021-2025 and the 12 months to Aug. 2026 (Census estimates).3 Hatched: Tempe units scheduled for completion in 2026-28 among projects under construction or in lease-up (Yardi Matrix via MMG, Aug. 2026).26 Tempe has no published delivery forecast.
Demand. Tempe gained 1,195 residents (+0.6%) in 2025 (Census);11 metro Phoenix added 23,000 jobs (Northmarq).10 East Valley: Yardi Matrix scheduled completions fall from 6,739 in 2026 to 1,329 in 2028,26 but permits rose 51% year to date (2,106 vs. 1,397), so they bear watching.3
BOTTOM LINE Tempe's scheduled pipeline empties after 2027, but permits are steady at ~1,200 a year, so 2028 depends on whether those permits actually start.
Six markets on one timeline
BOTTOM LINE Every market's permit pace is 29% to 69% below its 2021-23 peak. Carried forward about two years, that points to thin deliveries in 2027-28.
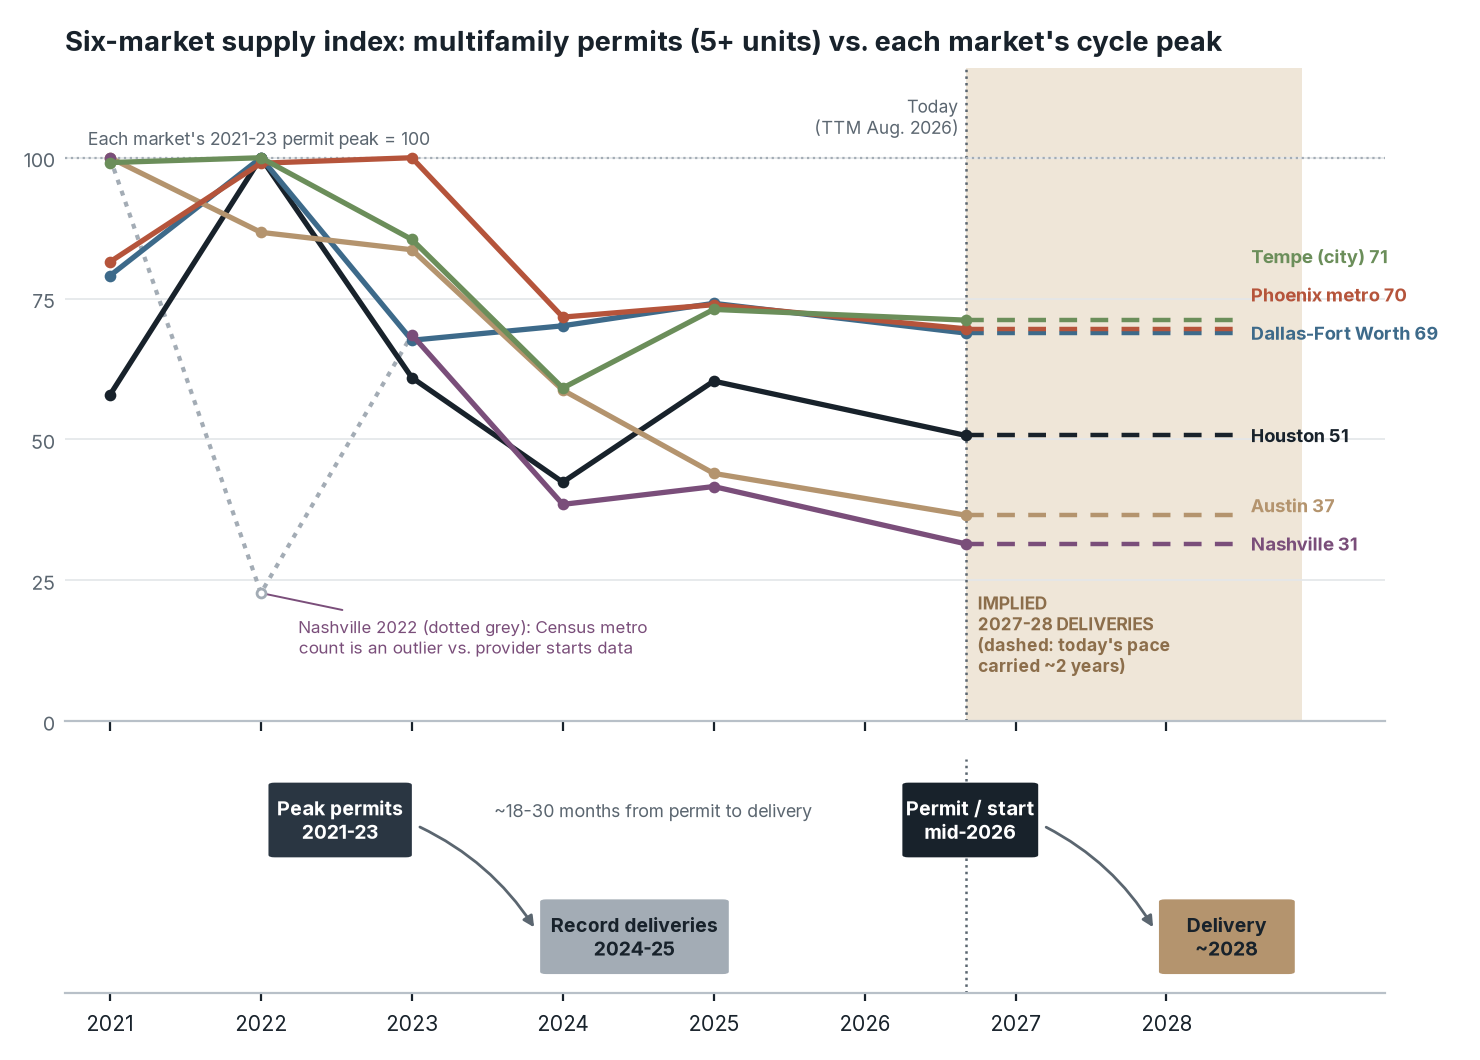
Chart Summary and Key Values
With each market's 2021–2023 multifamily permit peak indexed to 100, the chart's latest levels are Tempe city 71, Phoenix metro 70, Dallas–Fort Worth 69, Houston 51, Austin 37 and Nashville 31. An illustrative 18–30-month permit-to-delivery lag links lower permitting to a potential delivery trough around 2028. The dashed future lines are implied, not published forecasts.
Multifamily permits (units in 5+ unit buildings) indexed to each market's 2021-23 peak = 100; the final point is the 12 months to Aug. 2026. Dashed lines carry today's pace forward and are not a forecast. Tempe = city of Tempe. Source: U.S. Census Bureau, Building
Permits Survey.1,2,3 Timeline panel is illustrative.
The pattern is consistent. Permits peaked in 2021-2023, deliveries peaked in 2024-2025 as those projects completed, and permits have since settled at a much lower level. The timeline panel shows the link: a project permitted in mid-2026 would typically deliver around 2028. Nashville's 2022 dip (dotted grey) reflects the Census metro-file outlier discussed in the methodology, not a real collapse in activity.2,25,35
The cliff in one picture: the scheduled pipeline
BOTTOM LINE Units scheduled for completion fall from 86,125 in 2026 to 48,513 in 2027 and 14,358 in 2028 across the five metros.
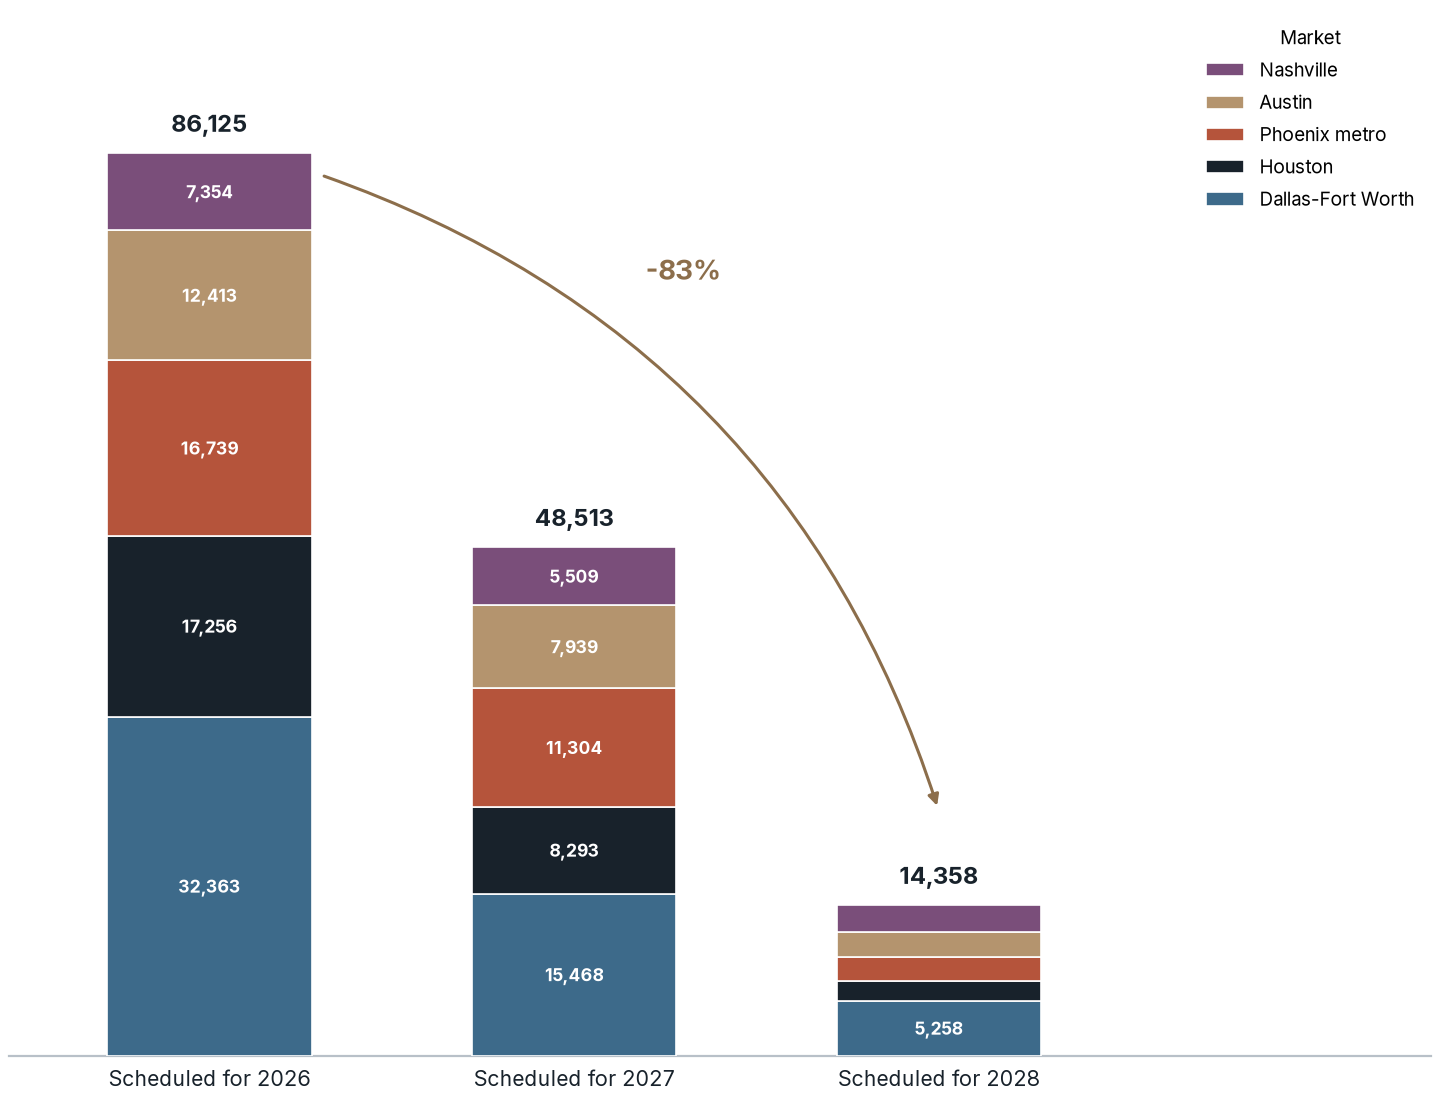
Chart Summary and Key Values
Combined scheduled deliveries across the chart's markets decline from 86,125 units for 2026 to 48,533 for 2027 and 14,358 for 2028, an approximately 83% reduction from 2026 to 2028. Stacked segments identify Nashville, Austin, Phoenix metro, Houston and Dallas–Fort Worth. Scheduled pipeline counts are not a complete forecast of eventual supply.
Units under construction or in lease-up by forecast completion year, Aug. 2026 (Yardi Matrix via MMG).22,23,26,46,48 Tempe is inside
metro Phoenix and is not counted separately. Scheduled counts for later years fill in as new projects start.
Actual 2028 figures are impossible to know for sure and could vary depending on the market in the next 2 years.
Scorecard comparison: ranked by supply decline
BOTTOM LINE Nashville, Austin and Houston show the steepest declines; Dallas-Fort Worth, Phoenix and Tempe show the mildest, but all six are well off their peaks.
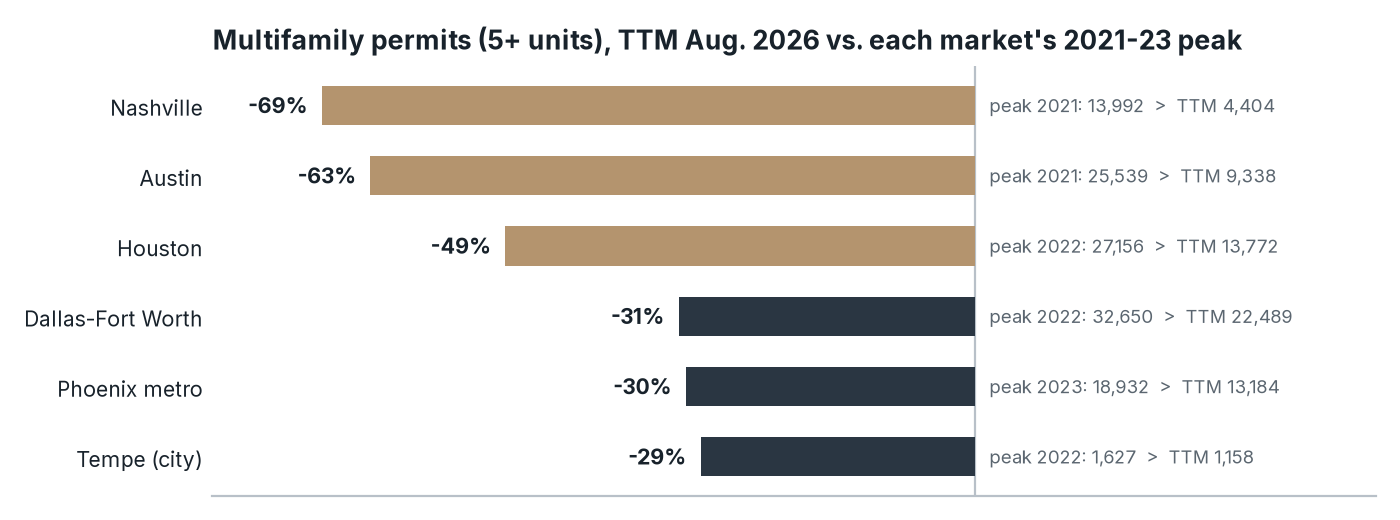
Chart Summary and Key Values
Multifamily permits, trailing 12 months through August 2026 versus each market's 2021–2023 peak: Nashville 4,404 versus 13,992 (−69%); Austin 9,338 versus 25,539 (−63%); Houston 13,772 versus 27,156 (−49%); Dallas–Fort Worth 22,489 versus 32,650 (−31%); Phoenix metro 13,184 versus 18,932 (−30%); Tempe city 1,158 versus 1,627 (−29%).
Permits for units in 5+ unit buildings, 12 months to Aug. 2026 vs. each market's 2021-23 peak year. Source: U.S. Census Bureau, Building
Permits Survey.1,2,3
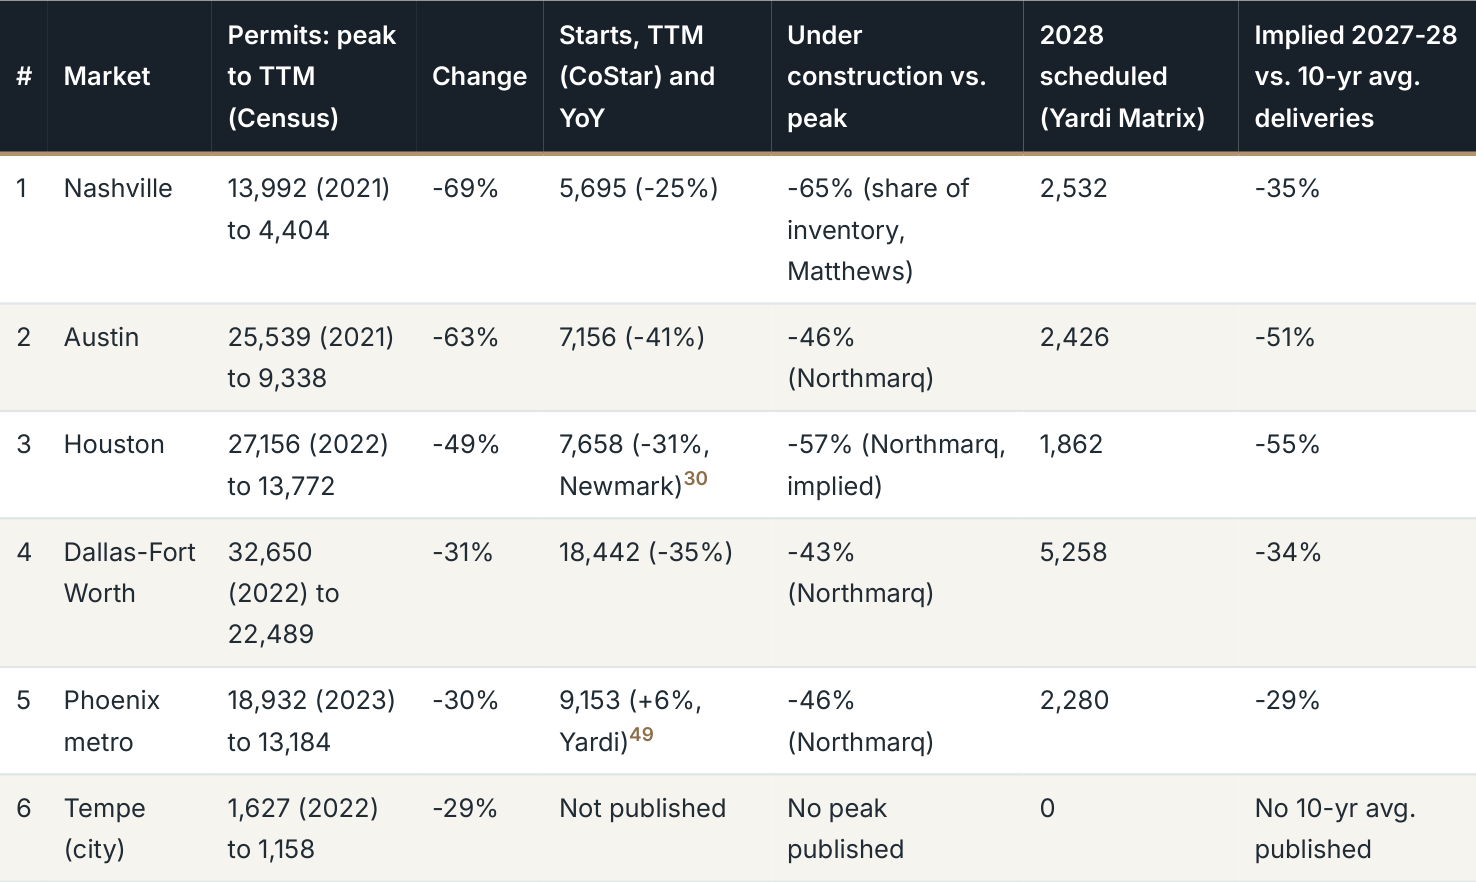
Table Summary and Key Values
| # | Market | Permits: peak to TTM (Census) | Change | Starts, TTM (CoStar) and YoY | Under construction vs. peak | 2028 scheduled (Yardi Matrix) | Implied 2027-28 vs. 10-yr avg. deliveries |
|---|---|---|---|---|---|---|---|
| 1 | Nashville | 13,992 (2021) to 4,404 | -69% | 5,695 (-25%) | -65% (share of inventory, Matthews) | 2,532 | -35% |
| 2 | Austin | 25,539 (2021) to 9,338 | -63% | 7,156 (-41%) | -46% (Northmarq) | 2,426 | -51% |
| 3 | Houston | 27,156 (2022) to 13,772 | -49% | 7,658 (-31%, Newmark)30 | -57% (Northmarq, implied) | 1,862 | -55% |
| 4 | Dallas-Fort Worth | 32,650 (2022) to 22,489 | -31% | 18,442 (-35%) | -43% (Northmarq) | 5,258 | -34% |
| 5 | Phoenix metro | 18,932 (2023) to 13,184 | -30% | 9,153 (+6%, Yardi)49 | -46% (Northmarq) | 2,280 | -29% |
| 6 | Tempe (city) | 1,627 (2022) to 1,158 | -29% | Not published | No peak published | 0 | No 10-yr avg. published |
Sources: Census permits;1,2,3 CoStar starts and 10-year averages via MMG;12,13,14,15,16,17,18,19,20,21 under construction from Northmarq and Matthews;5,7,8,10,36,47 scheduled completions from Yardi Matrix via MMG.22,23,26,46,48 Implied 2027-28 = TTM starts vs. the 10-year average of annual deliveries. Ranked by permit change; other columns mix providers.
Supply heat map: six markets, eight measures
BOTTOM LINE Nashville, Houston and Dallas-Fort Worth rate strong overall; Austin, Phoenix and Tempe rate moderate. At today's demand, every metro would absorb more than its 2027 deliveries. Weak cells are soft rents in Austin and Phoenix, Houston's current absorption gap, Austin's vacancy, and rising starts or permits in Phoenix and Tempe.
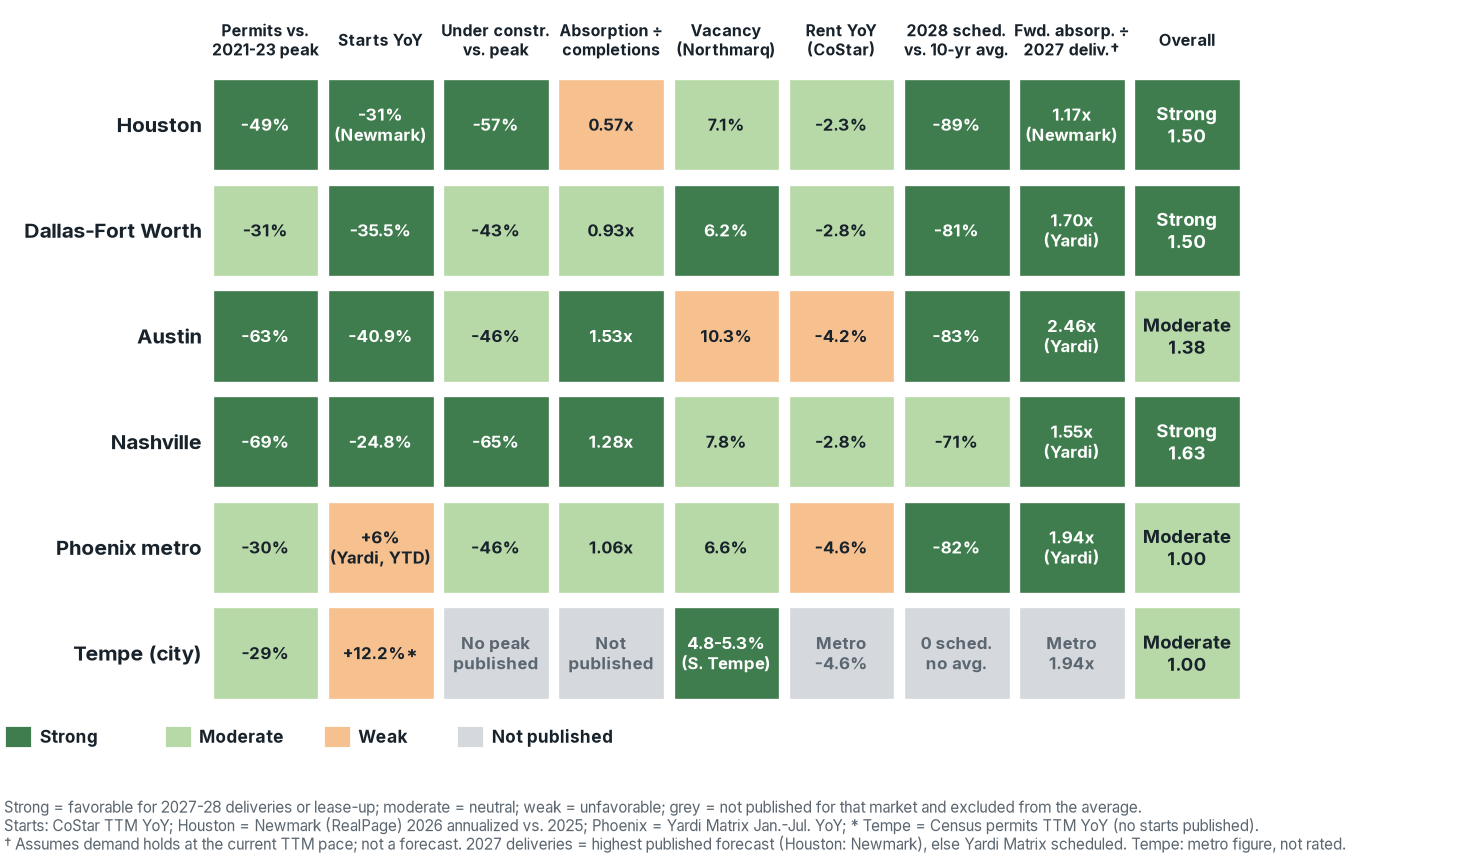
Chart Summary and Key Values
The report's six-market scorecard combines permits, starts, construction, absorption, vacancy, rent changes and forward supply measures. Overall scores and labels shown are Houston 1.50, Strong; Dallas–Fort Worth 1.50, Strong; Austin 1.38, Moderate; Nashville 1.63, Strong; Phoenix metro 1.00, Moderate; and Tempe city 1.00, Moderate. These are the report's screening scores, not investment ratings or return forecasts; missing data and mixed source dates are identified in the source figure.
Sources: Census permits;1,2,3 CoStar starts, absorption, completions, rents and 10-year averages via MMG;12,13,14,15,16,17,18,19,20,21 Northmarq and Matthews under construction and vacancy;5,7,8,9,10,47 Yardi Matrix scheduled units via MMG;22,23,26,46,48 starts YoY: Newmark (RealPage) for Houston30 and Yardi Matrix for Phoenix.49 Forward column: 2027 deliveries from Newmark (Houston)30 and Yardi Matrix scheduled units;23,26,46,48 it assumes demand holds at the current pace and is not a forecast. Thresholds: see
methodology.
How to read it. Each cell compares one published measure with a fixed threshold (listed in the methodology and the companion workbook). Supply measures (permits, starts, under construction, 2028 scheduled) are mostly strong, which is the supply-cliff thesis. Demand and pricing measures (absorption, vacancy, rents) are mixed, which is the work the 2024-2025 deliveries still have to do. The forward column asks whether today's demand could absorb 2027's deliveries: Houston's 9,307 units absorbed over the past year are 1.17x the 7,927 Newmark forecasts for 2027, though only 0.57x the past year's deliveries. The overall score is a simple average of the rated cells, not a weighting of their importance.
What it does not say. A strong market is not a recommendation, and a weak cell is not a reason to avoid a market. Submarket conditions vary widely inside every metro, and several measures here are metro-wide or come from a single provider. Disciplined sponsors use a screen like this to decide where to look, then underwrite each site on its own submarket data.
For comparison: two non-Ascendant metros on the same scale
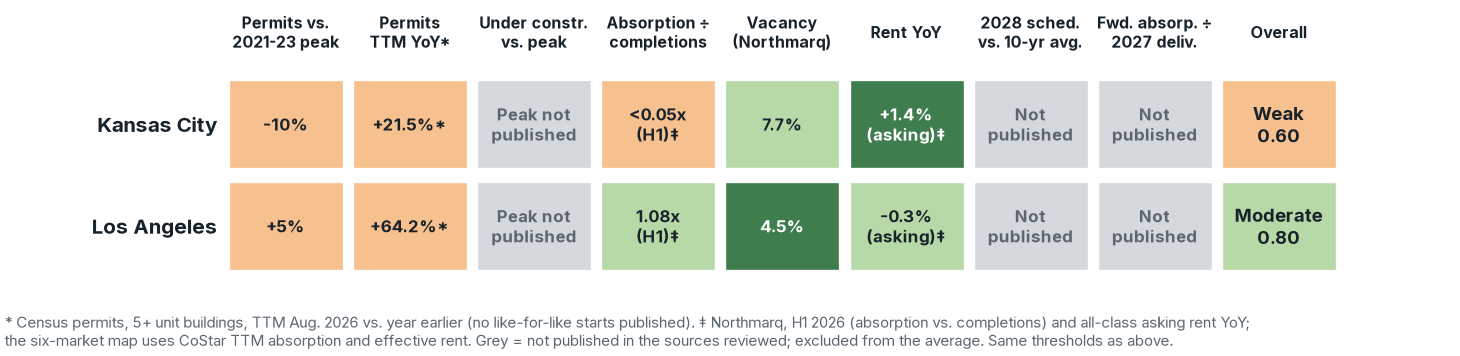
Chart Summary and Key Values
The comparison-market scorecard labels Kansas City Weak with an overall score of 0.60 and Los Angeles Moderate with 0.80. Their displayed absorption-to-completions ratios are 0.05× and 1.08×, respectively. The chart flags unpublished measures and different reporting periods; the screening scores are not projected returns.
Same thresholds as the six-market map. Permits: U.S. Census Bureau, CBSA 28140 (Kansas City, MO-KS) and 31080 (Los Angeles-Long Beach-Anaheim, CA).1,2 Absorption, completions, vacancy and asking rents: Northmarq, Q2 2026.52,53 Grey cells are not published in
the sources reviewed.
Two different dynamics. In Kansas City, permits for 5+ unit buildings are only 10% below their 2022 peak (4,755 TTM vs. 5,295) and up 21.5% year over year; Northmarq counts 6,299 units under construction, up from about 5,400 a year ago, and net absorption of fewer than 100 units in the first half of 2026 against 2,467 completed, with vacancy at 7.7%.1,2,52 In Los Angeles, permits have climbed back above their 2022 peak (20,624 TTM vs. 19,559) and are up 64.2% year over year, even though vacancy is a tight 4.5% and absorption (roughly 3,200 units) just matched completions (2,973) in the first half.1,2,53 Neither shows the supply decline seen in the six Ascendant markets.
Timing: the lease-up window, and who can build
BOTTOM LINE A project that starts in Q1 2027 would deliver around 2028-29 and stabilize around 2029-30, so 2029 supply matters as much as 2028.
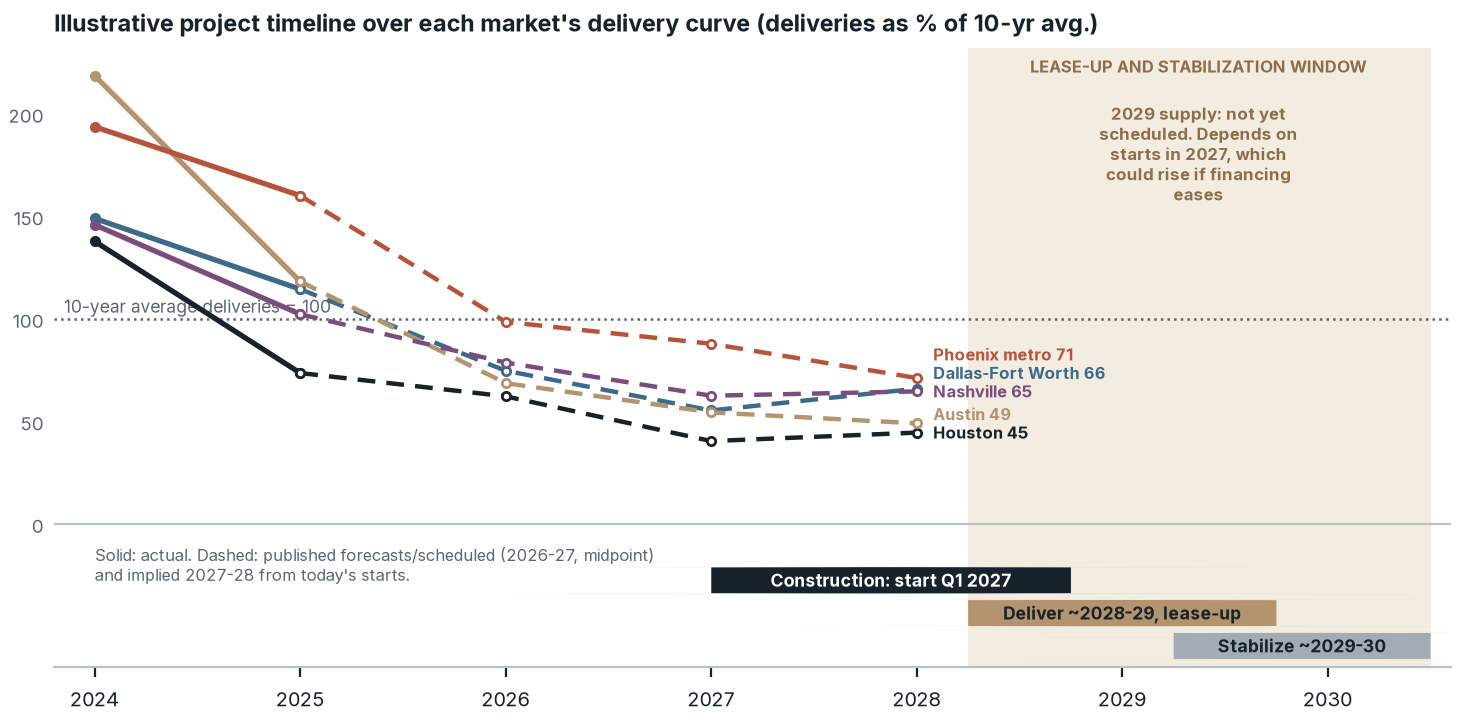
Chart Summary and Key Values
Illustrative timing: construction starts in Q1 2027, delivery and lease-up occur around 2028–2029, and stabilization around 2029–2030. Delivery curves are indexed to each market's 10-year average of 100. Solid lines are actual; dashed lines combine published or scheduled 2026–2027 data with implied 2027–2028 supply. Supply in 2029 and later depends on future starts and is not shown as a known outcome.
Lines: each metro's deliveries as a share of its 10-year average: 2024-25 actual, 2026-27 midpoint of published forecasts and scheduled units, 2027-28 implied from TTM starts (CoStar via MMG; Northmarq; Newmark; Yardi Matrix via MMG).17,18,19,20,21,25,37,40,45,50 Bars:
an illustrative development timeline, not a specific project.
The lease-up and stabilization window. A 2028 delivery stabilizes in 2029, so the supply that matters is what delivers in both 2028 and 2029. Only 14,358 units are scheduled for 2028 across the five metros today, and the Yardi Matrix pipeline shows no units yet scheduled for 2029, because those projects have not started.22,23,26,46,48 That is the opportunity and the risk: if financing eases in 2027, new starts would deliver in exactly that window. Disciplined sponsors track starts through 2027, not just today's pipeline.
Construction financing is the moat
Why starts fell. The cost and availability of construction financing is a big reason. MMG attributes Dallas-Fort Worth's nearly 50% drop in 2024 starts in part to the rising cost of construction financing,40 and notes that Nashville development slowed in response to rising financing costs.25 Banks have not reopened the window: in the Federal Reserve's July 2026 survey, standards for construction and land development loans were basically unchanged in the second quarter, demand for those loans was weaker, and a significant net share of banks said their standards sit at the tighter end of their range.54
Who can still build. That limits who can start projects. Experienced sponsors with track records and lender relationships, like Ascendant, can still secure construction financing. Fewer competing starts is what keeps the 2028-29 window thin.
Development vs. acquisition in a supply cliff
BOTTOM LINE Development builds to a cost below fair market value; acquisitions happen at fair market value. Development makes sense only where the yield on cost clears market cap rates by a healthy spread.
Acquisitions happen at fair market value. When a buyer acquires a stabilized apartment community, a competitive sale sets the price, which is by definition the property's fair market value. Development builds below fair market value. A development is built to a cost. When land, hard and soft costs and a conservative, fully funded interest reserve add up to less than what the finished, stabilized property is worth, the difference is built-in equity, the reward for taking on construction and lease-up risk.
Yield on cost is the test. The supply gap is what can widen the spread between yield on cost and cap rates by delivery. For Houston deliveries, Ascendant's underwriting estimates a yield on cost of 6%-7%. That is Ascendant's estimate, not a market statistic.34 Newmark puts Class A cap rates in Houston at 4.75%-5.50% for suburban product and 4.25%-5.00% for infill.30
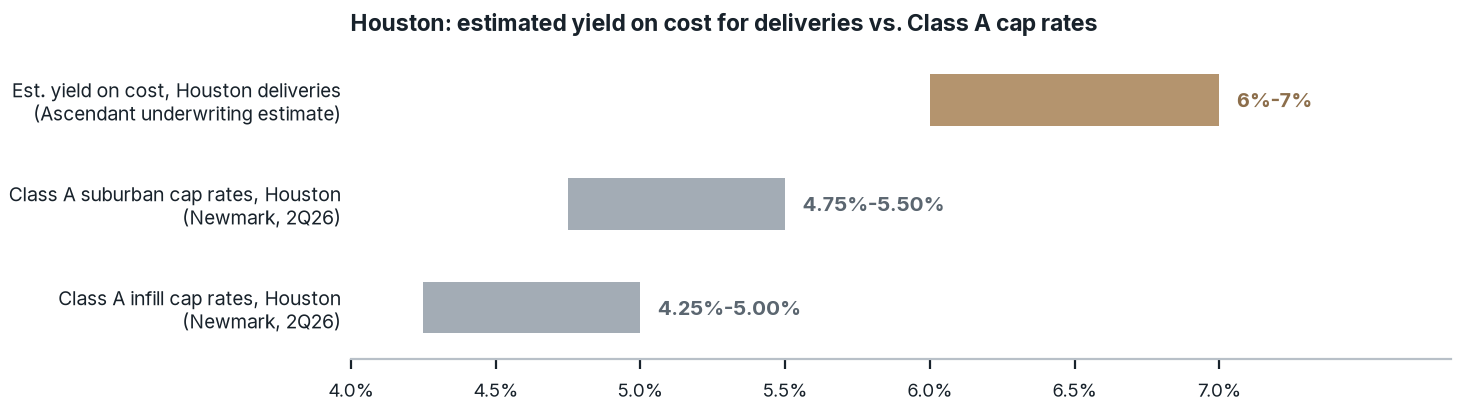
Chart Summary and Key Values
Houston comparison: the report estimates a 6%–7% development yield on cost, versus 2026 Class A suburban cap rates of 4.75%–5.50% and Class A infill cap rates of 4.25%–5.00%. Yield on cost is an Ascendant underwriting estimate; cap-rate ranges are attributed to Newmark. These are different measures and do not constitute a promised investor return.
Yield on cost: Ascendant underwriting estimate for Houston deliveries, not a market statistic or a projection for any specific project.34
Class A cap rates: Newmark, Houston, 2Q26.30
Cap rates by market: the reference point for exit values
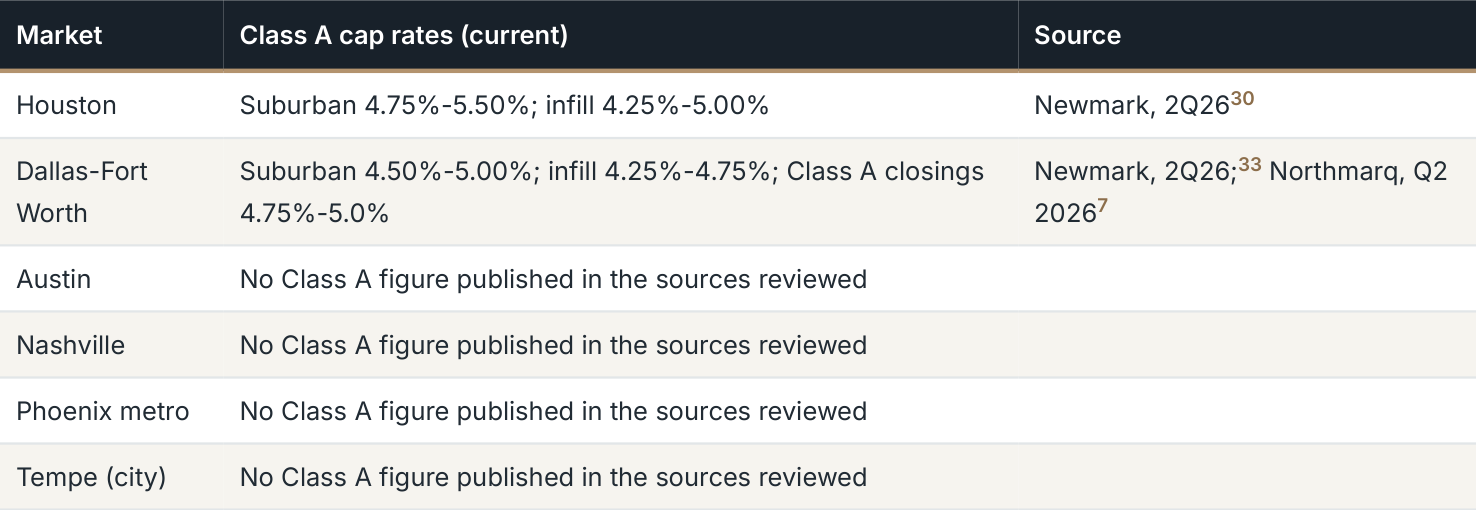
Table Summary and Key Values
| Market | Class A cap rates (current) | Source |
|---|---|---|
| Houston | Suburban 4.75%-5.50%; infill 4.25%-5.00% | Newmark, 2Q2630 |
| Dallas-Fort Worth | Suburban 4.50%-5.00%; infill 4.25%-4.75%; Class A closings 4.75%-5.0% | Newmark, 2Q26;33 Northmarq, Q2 20267 |
| Austin | No Class A figure published in the sources reviewed | |
| Nashville | No Class A figure published in the sources reviewed | |
| Phoenix metro | No Class A figure published in the sources reviewed | |
| Tempe (city) | No Class A figure published in the sources reviewed |
Why the sponsor matters. Built-in equity exists only if the project is delivered on budget and on schedule, and the largest controllable risk is construction. Ascendant builds through its affiliate, Ascendant Construction, under fixed-price contracts.
This is a conflict of interest, and it is disclosed as one. Ascendant Construction
earns fees as the general contractor. The conflict is managed through competitive third-party subcontractor bids and review by the construction lender's independent cost consultant, and it is fully disclosed in offering documents. Good sponsors, like Ascendant, align the incentives of their construction company with the goals of the development project. Ascendant also underwrites a conservative, fully funded interest reserve, sized so a project can carry its construction financing through lease-up even if rates stay elevated or leasing takes longer than planned.
What could go wrong
BOTTOM LINE A supply cliff is a tailwind, not a guarantee. These are the risks that could change the picture, and how disciplined sponsors manage them.
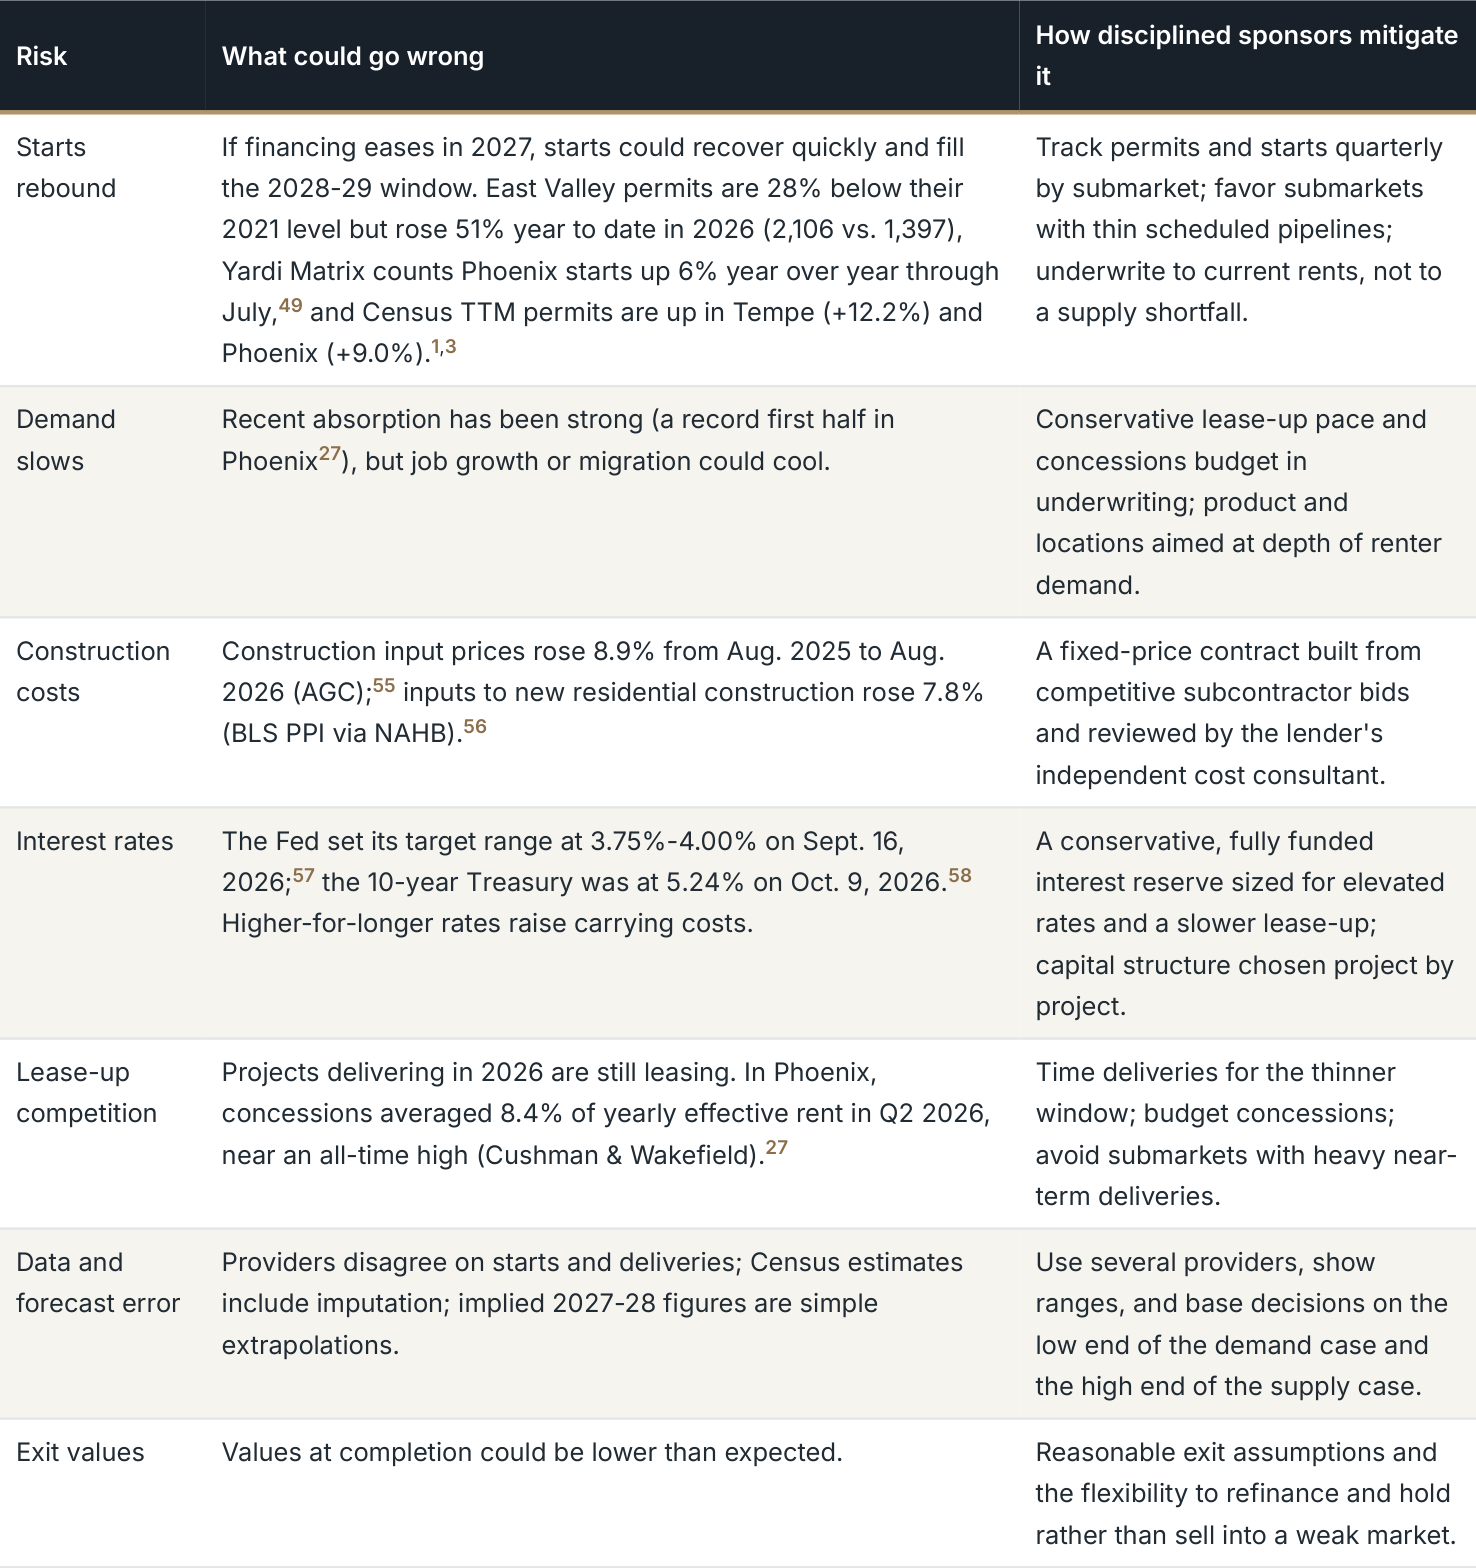
Table Summary and Key Values
| Risk | What could go wrong | How disciplined sponsors mitigate it |
|---|---|---|
| Starts rebound | If financing eases in 2027, starts could recover quickly and fill the 2028-29 window. East Valley permits are 28% below their 2021 level but rose 51% year to date in 2026 (2,106 vs. 1,397), Yardi Matrix counts Phoenix starts up 6% year over year through July,49 and Census TTM permits are up in Tempe (+12.2%) and Phoenix (+9.0%).1,3 | Track permits and starts quarterly by submarket; favor submarkets with thin scheduled pipelines; underwrite to current rents, not to a supply shortfall. |
| Demand slows | Recent absorption has been strong (a record first half in Phoenix27), but job growth or migration could cool. | Conservative lease-up pace and concessions budget in underwriting; product and locations aimed at depth of renter demand. |
| Construction costs | Construction input prices rose 8.9% from Aug. 2025 to Aug. 2026 (AGC); (BLS PPI via NAHB). 55 inputs to new residential construction rose 7.8% 56 | A fixed-price contract built from competitive subcontractor bids and reviewed by the lender's independent cost consultant. |
| Interest rates | The Fed set its target range at 3.75%-4.00% on Sept. 16, 2026; Higher-for-longer rates raise carrying costs. 57 the 10-year Treasury was at 5.24% on Oct. 9, 2026.58 | A conservative, fully funded interest reserve sized for elevated rates and a slower lease-up; capital structure chosen project by project. |
| Lease-up competition | Projects delivering in 2026 are still leasing. In Phoenix, concessions averaged 8.4% of yearly effective rent in Q2 2026, near an all-time high (Cushman & Wakefield).27 | Time deliveries for the thinner window; budget concessions; avoid submarkets with heavy near- term deliveries. |
| Data and forecast error | Providers disagree on starts and deliveries; Census estimates include imputation; implied 2027-28 figures are simple extrapolations. | Use several providers, show ranges, and base decisions on the low end of the demand case and the high end of the supply case. |
| Exit values | Values at completion could be lower than expected. | Reasonable exit assumptions and the flexibility to refinance and hold rather than sell into a weak market. |
THE QUARTERLY WATCH LIST
Disciplined sponsors re-check the supply thesis every quarter, submarket by submarket:
Multifamily permits (Census, monthly) and construction starts (provider data, quarterly)
Units scheduled for 2027-28 completion in pipeline reports, and whether delayed projects slip into the window
Absorption vs. completions over the trailing four quarters
Class A vacancy, concessions and effective rent trends
About Ascendant Development
Ascendant Development is a vertically integrated real estate development and construction firm headquartered in Houston, Texas. According to the company, Ascendant and its principals have been involved in garden, mid-rise, high-rise and build-to-rent projects totaling more than 5,000 Class A multifamily units and more than $1 billion in total investment, including build-to-rent communities in the Kingwood area, Fresno and Tomball.
Build into the gap, with a disciplined sponsor
Join the Ascendant Development investor list for quarterly supply scorecards, market updates and early notice when we open offerings to verified accredited investors. To walk through the data or our development approach, visit https://www.ascendantdevco.com/invest-with-us or call Ascendant Development at 713.600.9393.
Join the Supply Cliff Scorecard Investor List Sign up for Supply Cliff Scorecard investor updates →
Scan the code to join the Supply Cliff Scorecard Investor List.
Important disclosures
This report is provided for general informational and educational purposes only. It is not an offer to sell, or a solicitation of an offer to buy, any security, and it may not be relied upon in connection with any investment decision. Any offer will be made only to verified accredited investors through definitive offering documents (including a private placement memorandum, operating agreement and subscription agreement), which will contain important information about risks, fees and conflicts of interest.
Any offering referenced by the sponsor is expected to be made under Rule 506(c) of Regulation D. Investments are available only to accredited investors, as defined in Rule 501(a), whose status has been verified through reasonable steps. Securities offered under Regulation D are not registered with the SEC or any state securities regulator, and no regulator has approved or reviewed this material.
Real estate development investments are speculative, illiquid and involve a high degree of risk, including the possible loss of an investor's entire investment. Common equity is typically subordinate to senior debt and preferred equity. Past performance and market trends do not guarantee future results. Statements about future market conditions are forward-looking, based on third-party data and forecasts believed to be reliable but not independently verified, and actual results may differ materially.
Figures labeled "implied" are simple extrapolations by Ascendant from published starts or permit data, assuming a construction period of about two years. They are not forecasts by any data provider and should not be relied upon as predictions of future deliveries. Provider figures differ in methodology, geography and timing and are shown as published.
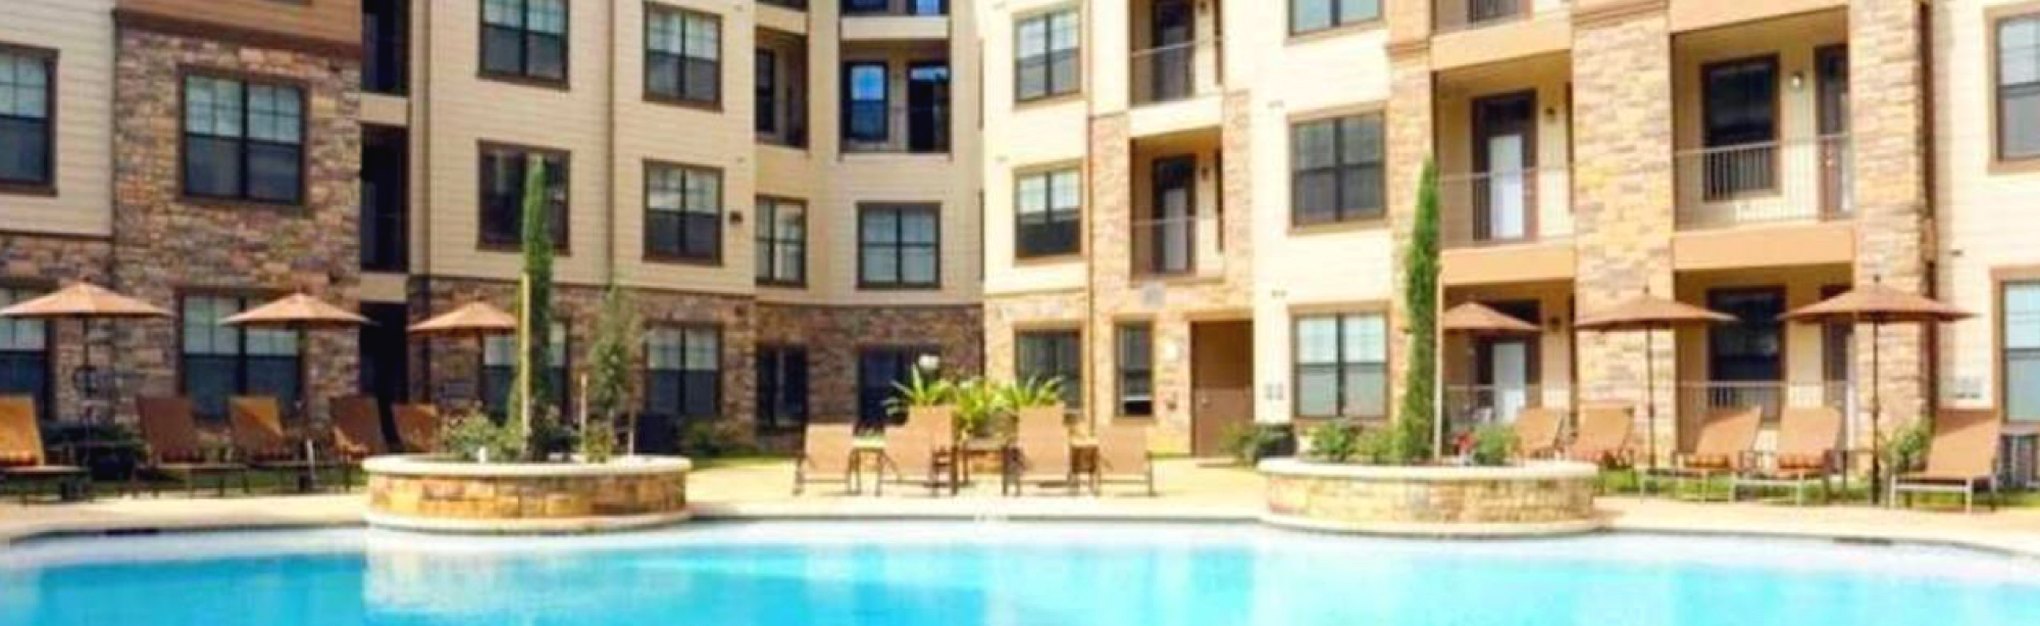
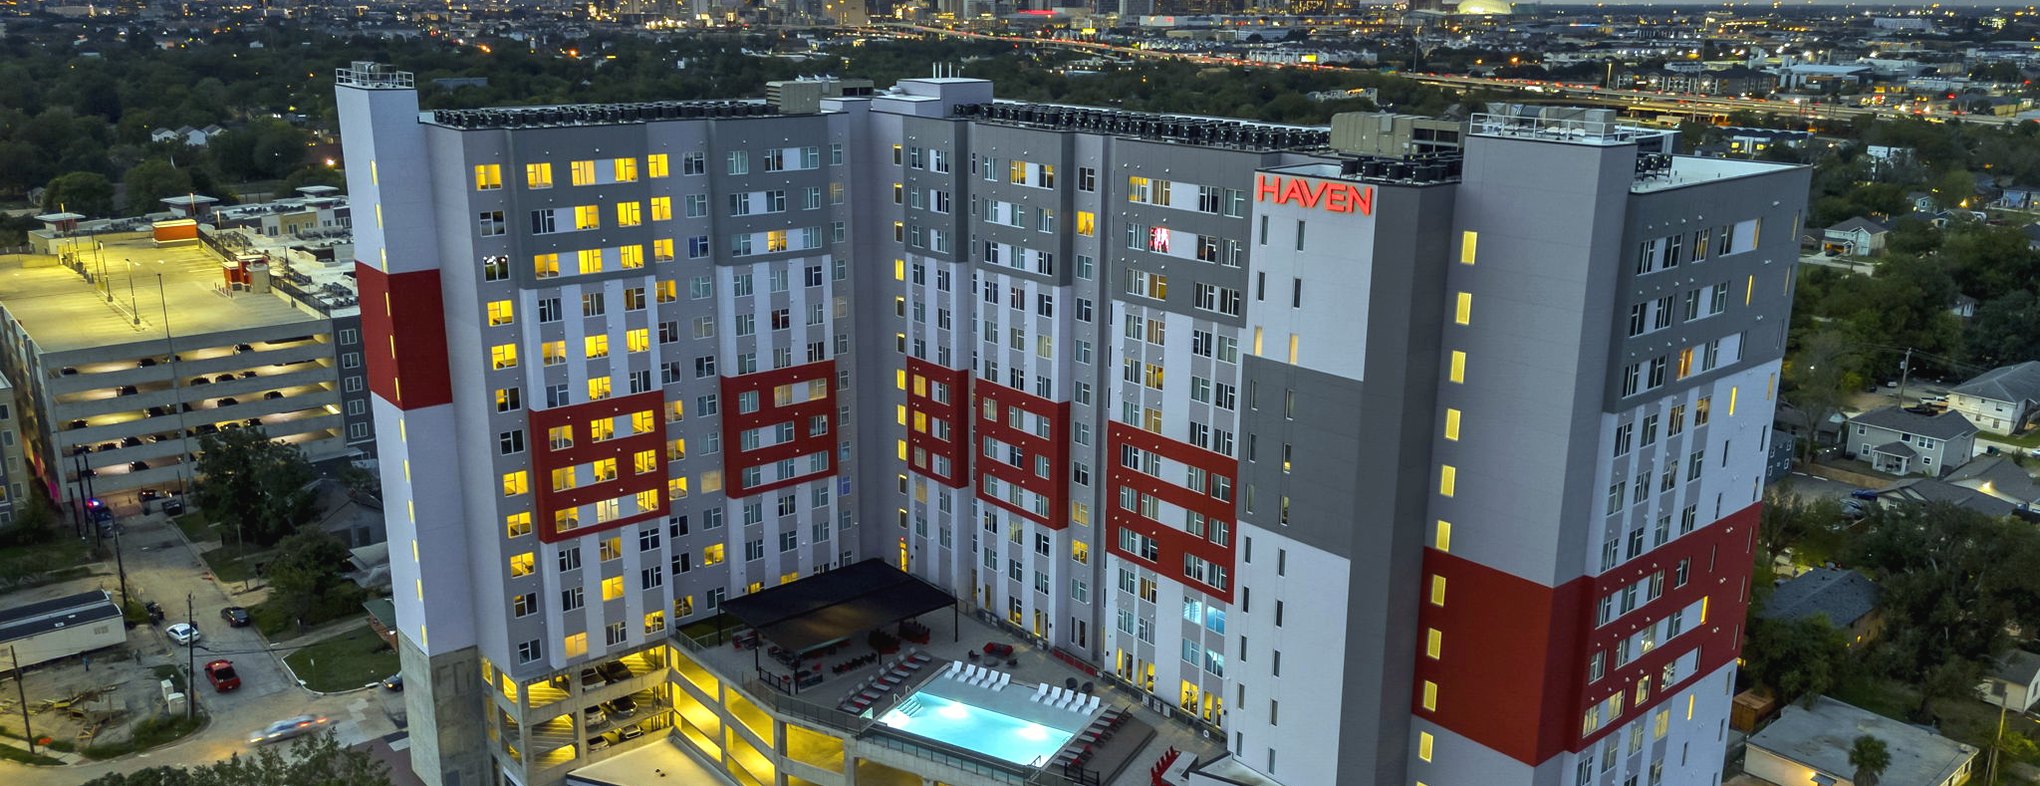
References to Ascendant Development's history, people, projects and practices are provided for general informational purposes only. They do not describe the terms, risks, projected performance or suitability of any investment. Photographs show prior or existing Ascendant projects and do not depict, or represent the results of, any current or future offering.
Nothing in this report is legal, tax or investment advice. Consult your own legal, tax and financial advisors before making any investment decision.
Sources
- U.S. Census Bureau, Building Permits Survey, CBSA annual files 2024 and 2025 and year-to-date files through Aug. 2024, June 2025, Aug. 2025, June 2026 and Aug. 2026 (units in buildings with 5+ units; estimates with imputation). View source
- U.S. Census Bureau, Building Permits Survey, metropolitan area annual files 2021-2023 (units in buildings with 5+ units; estimates with imputation). View source
- U.S. Census Bureau, Building Permits Survey, place-level files, West Region: annual 2021-2025 and year-to-date through Aug. 2024, Aug. 2025 and Aug. 2026 (Tempe, Mesa, Chandler, Gilbert, Queen Creek and Apache Junction, AZ; estimates with imputation). View source
- U.S. Census Bureau, cartographic boundary files 2023 (states; core based statistical areas), 1:20,000,000. View source
- Northmarq, Houston Multifamily Market Insights, Q2 2026. View source
- U.S. Census Bureau, Vintage 2025 population estimates, metropolitan and micropolitan statistical areas (cbsa-est2025-alldata). View source
- Northmarq, Dallas-Fort Worth Multifamily Market Insights, Q2 2026. View source
- Northmarq, Austin Multifamily Market Insights, Q2 2026. View source
- Northmarq, Nashville Multifamily Market Insights, Q2 2026. View source
- Northmarq, Phoenix Multifamily Market Insights, Q2 2026. View source
- U.S. Census Bureau, Vintage 2025 population estimates, incorporated places, Arizona (sub-est2025_4; Tempe city). View source
- MMG Real Estate Advisors, "Houston Q2 2026 Market Report" (CoStar data). View source
- MMG Real Estate Advisors, "Dallas-Fort Worth Q2 2026 Market Report" (CoStar data). View source
- MMG Real Estate Advisors, "Austin Q2 2026 Market Report" (CoStar data). View source
- MMG Real Estate Advisors, "Nashville Q2 2026 Market Report" (CoStar data). View source
- MMG Real Estate Advisors, "Phoenix Q2 2026 Market Report" (CoStar data). View source
- MMG Real Estate Advisors, "2026 Houston Forecast" (CoStar data; 2025 completions, 2026 forecast completions, 10-year average). View source
- MMG Real Estate Advisors, "2026 Dallas-Fort Worth Forecast" (CoStar data; 2025 completions, 2026 forecast completions, 10-year average). View source
- MMG Real Estate Advisors, "2026 Austin Forecast" (CoStar data; 2025 completions, 2026 forecast completions, 10-year average). View source
- MMG Real Estate Advisors, "2026 Nashville Forecast" (CoStar data; 2025 completions, 2026 forecast completions, 10-year average). View source
- MMG Real Estate Advisors, "2026 Phoenix Forecast" (CoStar data; 2025 completions, 2026 forecast completions, 10-year average). View source
- MMG Real Estate Advisors, "Houston Q3 2026 Pipeline Report" (Yardi Matrix data; units under construction and in lease-up by forecast completion year, Aug. 2026). View source
- MMG Real Estate Advisors, "Dallas-Fort Worth Q3 2026 Pipeline Report" (Yardi Matrix data, Aug. 2026). View source
- Multifamily Dive, "Multifamily new supply set to bottom out in 2027" (Yardi Matrix Q3 2026 Supply Forecast), Aug. 25, 2026. View source
- MMG Real Estate Advisors, "2025 Nashville Forecast" (CoStar data; 2024 completions; record 2022 starts). View source
- MMG Real Estate Advisors, "Phoenix Q3 2026 Pipeline Report" (Yardi Matrix data, Aug. 2026; project-level detail incl. Tempe and East Valley). View source
- Cushman & Wakefield, Phoenix Multifamily MarketBeat Q2 2026. View source
- Embrey Partners, "Austin's Multifamily Outlook Brightening" (RealPage data), Mar. 2025. View source
- Multi-Housing News, "Top Markets for Multifamily Deliveries in 2022" (Yardi Matrix data, incl. 2022 starts). View source
- Newmark, Houston Multifamily Market Report 1H26 (ApartmentData and RealPage data; starts and delivery forecasts; 2Q26 cap rate estimates). View source
- Matthews Real Estate Investment Services, "Houston Multifamily Market Report Q2 2026". View source
- Matthews Real Estate Investment Services, "Austin, TX Multifamily Market Report Q2 2026". View source
- Newmark, Dallas-Fort Worth Multifamily Market Report 2Q26 (2Q26 cap rate estimates). View source
- Ascendant Development, underwriting estimate of yield on cost for Houston deliveries (internal estimate; not a market statistic or provider figure), Oct. 2026.
- U.S. Census Bureau, Building Permits Survey, county annual files 2021-2025, and OMB metropolitan delineation files, March 2020 and July 2023 (list1_2020, list1_2023). View source
- Northmarq, Houston Multifamily Market Insights, Q4 2024 (units under construction vs. Q1 2023 peak). View source
- MMG Real Estate Advisors, "2025 Houston Forecast" (CoStar data; 2024 completions). View source
- Transwestern, Houston Multifamily Market, Q2 2026 factsheet (share of construction in suburban areas). View source
- MMG Real Estate Advisors, "Dallas-Fort Worth 2024 Forecast" (CoStar data; 2022 and 2023 starts). View source
- MMG Real Estate Advisors, "2025 Dallas-Fort Worth Forecast" (CoStar data; 2024 completions). View source
- Transwestern, Dallas-Fort Worth Multifamily Market Q1 2026 factsheet (forecasted deliveries). View source
- Colliers, Q4 2025 Multifamily Report, Dallas-Fort Worth (units expected to deliver over the next year). View source
- CRE Daily, "Dallas-Fort Worth Multifamily Absorption Climbs in Q2" (Transwestern Q2 2026 data), Sept. 8, 2026. View source
- Matthews Real Estate Investment Services, "Dallas-Fort Worth, TX Multifamily Market Report Q2 2026," Aug. 13, 2026. View source
- MMG Real Estate Advisors, "2025 Austin Forecast" (CoStar data; 2024 completions). View source
- MMG Real Estate Advisors, "Austin Q3 2026 Pipeline Report" (Yardi Matrix data, Aug. 2026). View source
- Matthews Real Estate Investment Services, "Nashville Multifamily Market Report Q2 2026". View source
- MMG Real Estate Advisors, "Nashville Q3 2026 Pipeline Report" (Yardi Matrix data, Aug. 2026). View source
- Yardi Matrix, "Phoenix Multifamily Market Report - September 2026" (Yardi Matrix blog, A. Gagiuc), Oct. 5, 2026 (project starts through July 2026 vs. same period 2025). View source
- MMG Real Estate Advisors, "2025 Phoenix Forecast" (CoStar data; 2024 completions). View source
- Kidder Mathews, Phoenix Multifamily Market Research, Q2 2026 (development pipeline table). View source
- Northmarq, Kansas City Multifamily Market Insights, Q2 2026. View source
- Northmarq, Los Angeles Multifamily Market Insights, Q2 2026. View source
- Board of Governors of the Federal Reserve System, Senior Loan Officer Opinion Survey on Bank Lending Practices, July 2026 (construction and land development loans). View source
- Associated General Contractors of America, "Construction Input Costs Climb 8.9% Between August 2025 and August 2026," Sept. 10, 2026. View source
- NAHB Eye on Housing (J. Wade), "Energy Prices Rise Again in August" (BLS Producer Price Index, inputs to new residential construction), Sept. 10, 2026. View source
- Board of Governors of the Federal Reserve System, FOMC Statement, Sept. 16, 2026. View source
- Advisor Perspectives, "Treasury Yields Snapshot: October 9, 2026". View source
For educational purposes only. Not an offer to sell or a solicitation of an offer to buy any security. Any offering will be made only to verified accredited investors under Rule 506(c) of Regulation D through definitive offering documents. Past performance does not guarantee future results.