
Key takeaways
- The 30-year mortgage rate is 7.11%, more than two and a half times its 2021 low, and the typical existing home costs more than half again what it did in early 2020. Together, they have raised the monthly payment on a median-priced home by more than 80%.
- More households are renting, and renting longer: renter households are near the highest level on record.
- At the same time, new apartment construction has pulled back from its 2022 peak, and the number of units under construction nationally is down by a third.
- Past cycles suggest that when demand holds up while new supply shrinks, occupancy and rents tend to firm within a few years, although a building surge can reverse that.
The setup in one paragraph
Two forces are moving in opposite directions. On the demand side, the cost of buying a home has risen faster than incomes, so would-be buyers stay in the rental market longer and existing owners stay put. On the supply side, the same high rates, along with tighter bank lending through most of 2022 to 2026, have reduced how many new apartment communities break ground. Apartments take roughly two years to build, so today's lower starts become fewer deliveries in 2027 and 2028. The sections below take each piece in turn, using public data from the Federal Reserve, the U.S. Census Bureau, the Bureau of Labor Statistics, Freddie Mac, the Federal Housing Finance Agency, the National Association of Realtors and Zillow.
Mortgage rates: far above the pandemic lows
Freddie Mac's Primary Mortgage Market Survey put the average 30-year fixed rate at 7.11% for the week of November 12, 2026, up from 6.24% a year earlier, after weekly readings of 7.32%, 7.24% and 7.18% over the prior three weeks.1 The record low in the survey was 2.65% in January 2021, the rate averaged ~2.96% for all of 2021, and so far in 2026 the weekly rate has ranged from 5.98% to 7.40%, the high set in October.2
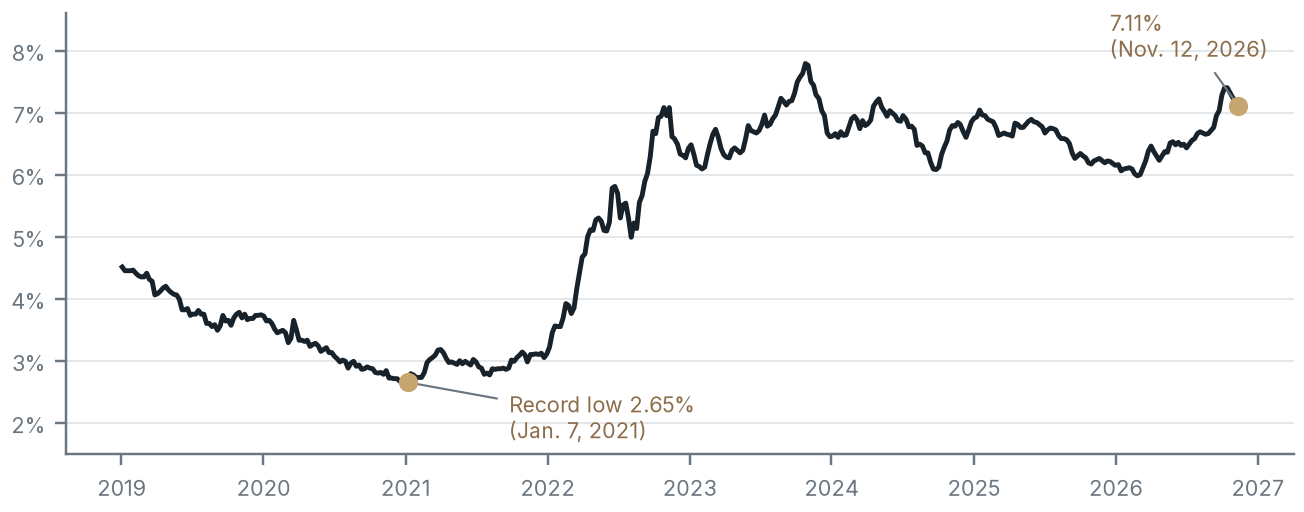
Chart Summary and Key Values
Line chart of the 30-year mortgage rate from 2019 to 2026
Source: Freddie Mac Primary Mortgage Market Survey, via FRED.
The chart shows how sudden the move was. Rates more than doubled within 2022 and have stayed in a 6% to 8% band since. For a buyer, the rate matters as much as the price: on a 30-year loan, each additional percentage point raises the monthly principal and interest payment by ~10% at today's levels. A household that could comfortably buy in 2021 may not qualify for the same house today, even with a raise.
Home prices kept rising anyway
Higher rates usually cool prices, but this time housing inventory was so thin that prices kept climbing. The S&P CoreLogic Case-Shiller U.S. National Home Price Index reached a record high in July 2026, up 1.9% from a year earlier.3 The Federal Housing Finance Agency's all-transactions index tells the same story, up ~60% from the first quarter of 2020 to the second quarter of 2026.4
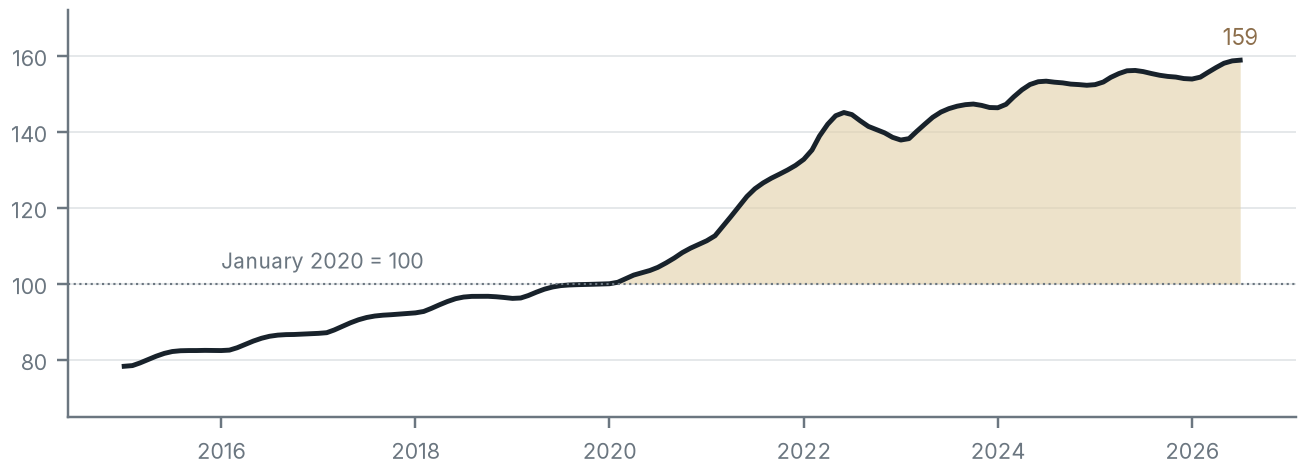
Chart Summary and Key Values
Line chart of national home prices indexed to January 2020
Source: S&P Dow Jones Indices, via FRED.
The shaded area marks the increase since early 2020. Price growth has slowed to low single digits, but prices have not given back the pandemic-era jump. The National Association of Realtors (NAR) reported a median existing-home price of $417,500 in September 2026, up 1.3% from a year earlier; on the broader Case-Shiller national index, prices were up 58.8% from January 2020 to July 2026.5
The monthly payment is up more than 80%
Price and rate together decide the payment. NAR's affordability data put the 2021 median single-family price at $357,100.6 With 20% down and the 2021 average rate of 2.96%, the monthly principal and interest on that house was ~$1,198. With 20% down on September 2026's $417,500 median at that month's average rate of 6.86%, it is ~$2,191.7 NAR's own 2021 figure, using its effective rate, was $1,206 a month.8

Chart Summary and Key Values
Bar chart comparing the 2021 and 2026 monthly payment
Calculated from NAR median prices and Freddie Mac rates.
That is an increase of ~83% in the core monthly payment, before property taxes and insurance, which have also risen in Texas. The down payment hurdle is higher too: 20% of today's median is ~$83,500, compared with ~$71,400 in 2021. For a renter trying to save, the target keeps moving.
Affordability indexes confirm the squeeze
NAR's Housing Affordability Index measures whether a median-income family can qualify for a mortgage on a median-priced home. A value of 100 means it has exactly enough income; higher is more affordable. The index averaged 148.2 in 2021, then fell to 108.8 in 2022, 96.9 in 2023 and 98.0 in 2024.9 The September 2026 reading was 105.4.10
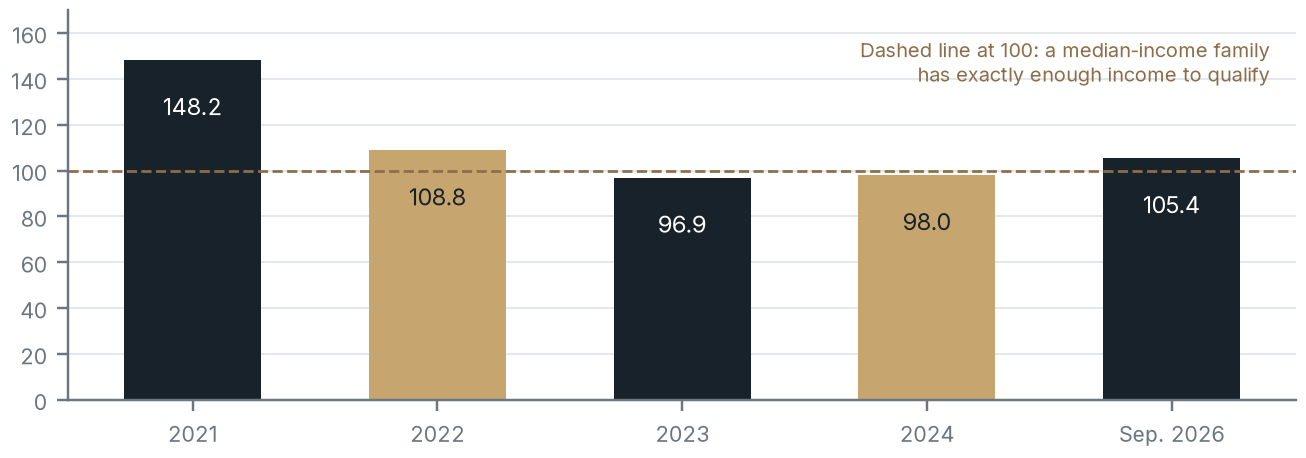
Chart Summary and Key Values
Bar chart of the NAR Housing Affordability Index
Source: National Association of Realtors; September 2026 via FRED.
The drop from 148 to ~100 means the typical family went from having ~48% more income than needed to qualify to having barely enough. Many households below the median, including most first-time buyers, fall short. The index has improved slightly in 2026, but the gap that opened in 2022 remains.
Owning has lost its monthly cost advantage
In 2021, owning was often the cheaper monthly option. Using Zillow's typical home value and typical rent for each market, and the same 20% down payment, the principal and interest on a typical home was ~$571 a month below the typical rent nationally in September 2021 and $578 below in Houston.11 By September 2026, at that month's average rate of 6.86%, the same calculation puts principal and interest ~$11 a month below the typical rent nationally and ~$49 below in Houston.12
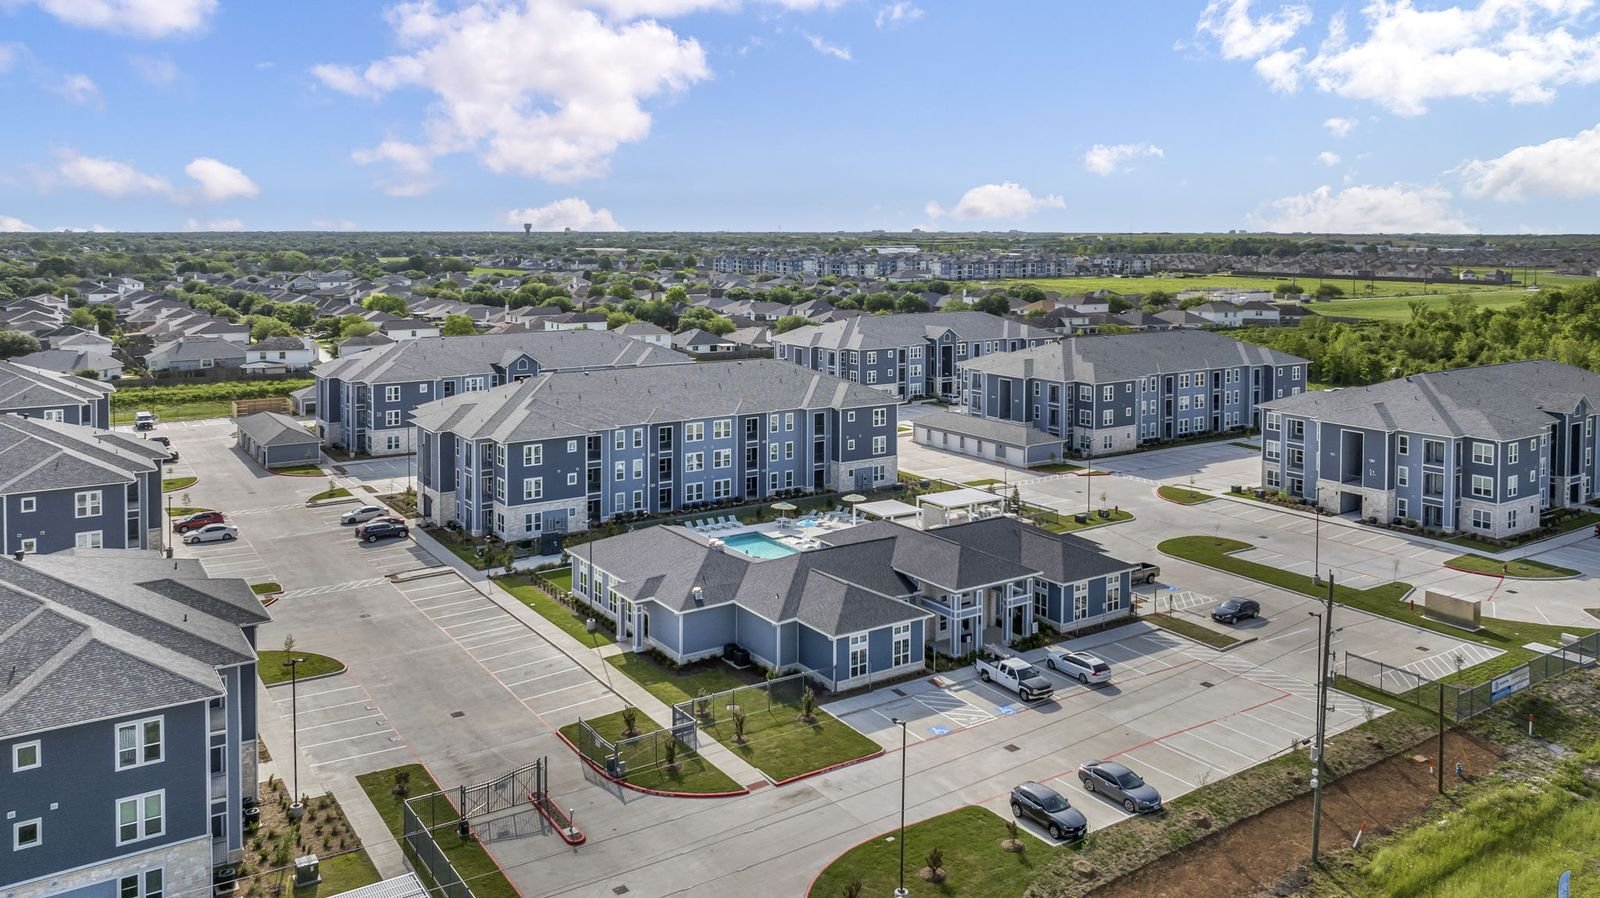
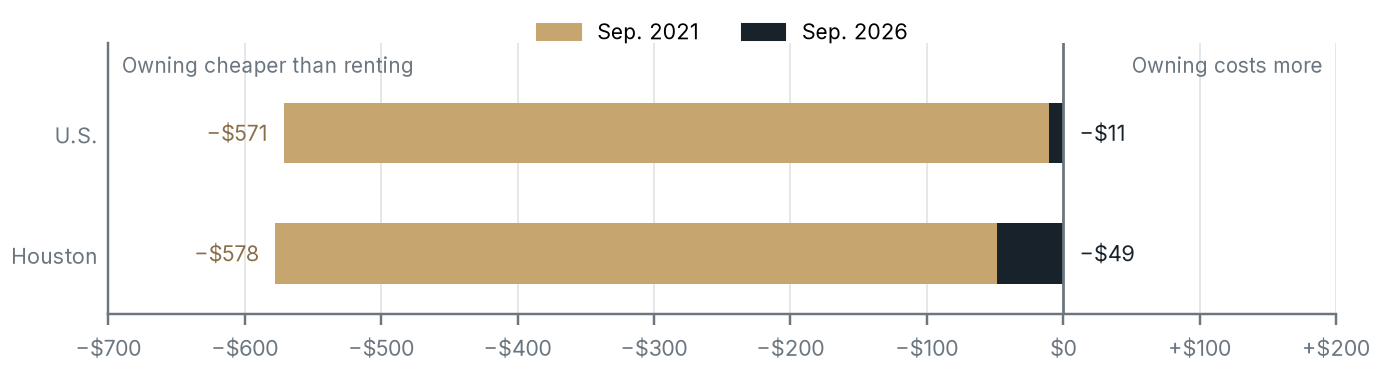
Chart Summary and Key Values
Bar chart of the owning premium over renting in the U.S. and Houston
Source: Zillow Home Value Index and Zillow Observed Rent Index; Freddie Mac.
Each row shows both years: gold for 2021 and navy for 2026. The monthly swing is ~$560 nationally and ~$530 in Houston, so the cost advantage owning had in 2021 has disappeared. The comparison is also conservative, because it leaves out property taxes, insurance and maintenance, which apply only to owners. Property taxes alone reverse the Houston result: at the Lincoln Institute's 1.27% effective rate for a median-valued Houston homestead, a typical Houston home worth ~$303,000 would owe ~$320 a month in property tax, ~$270 a month more than the $49 principal-and-interest advantage, by our approximate calculation.13 Add the down payment, ~$73,000 on Zillow's typical home nationally and $61,000 in Houston at 20% (below the $83,500 above because Zillow's typical home value is lower than NAR's median sale price), and the decision for many households is not close.14 Renting is the practical choice, and for many families it is the only one.
Locked-in owners and fewer home sales
Owners who refinanced or bought in 2020 and 2021 hold mortgages that can't be replicated at today's rates. FHFA's National Mortgage Database shows that 49.1% of outstanding mortgages carried a rate below 4% in the second quarter of 2026, and 65.6% were below 5%, down from 64.2% and 84.9% at the end of 2021.15
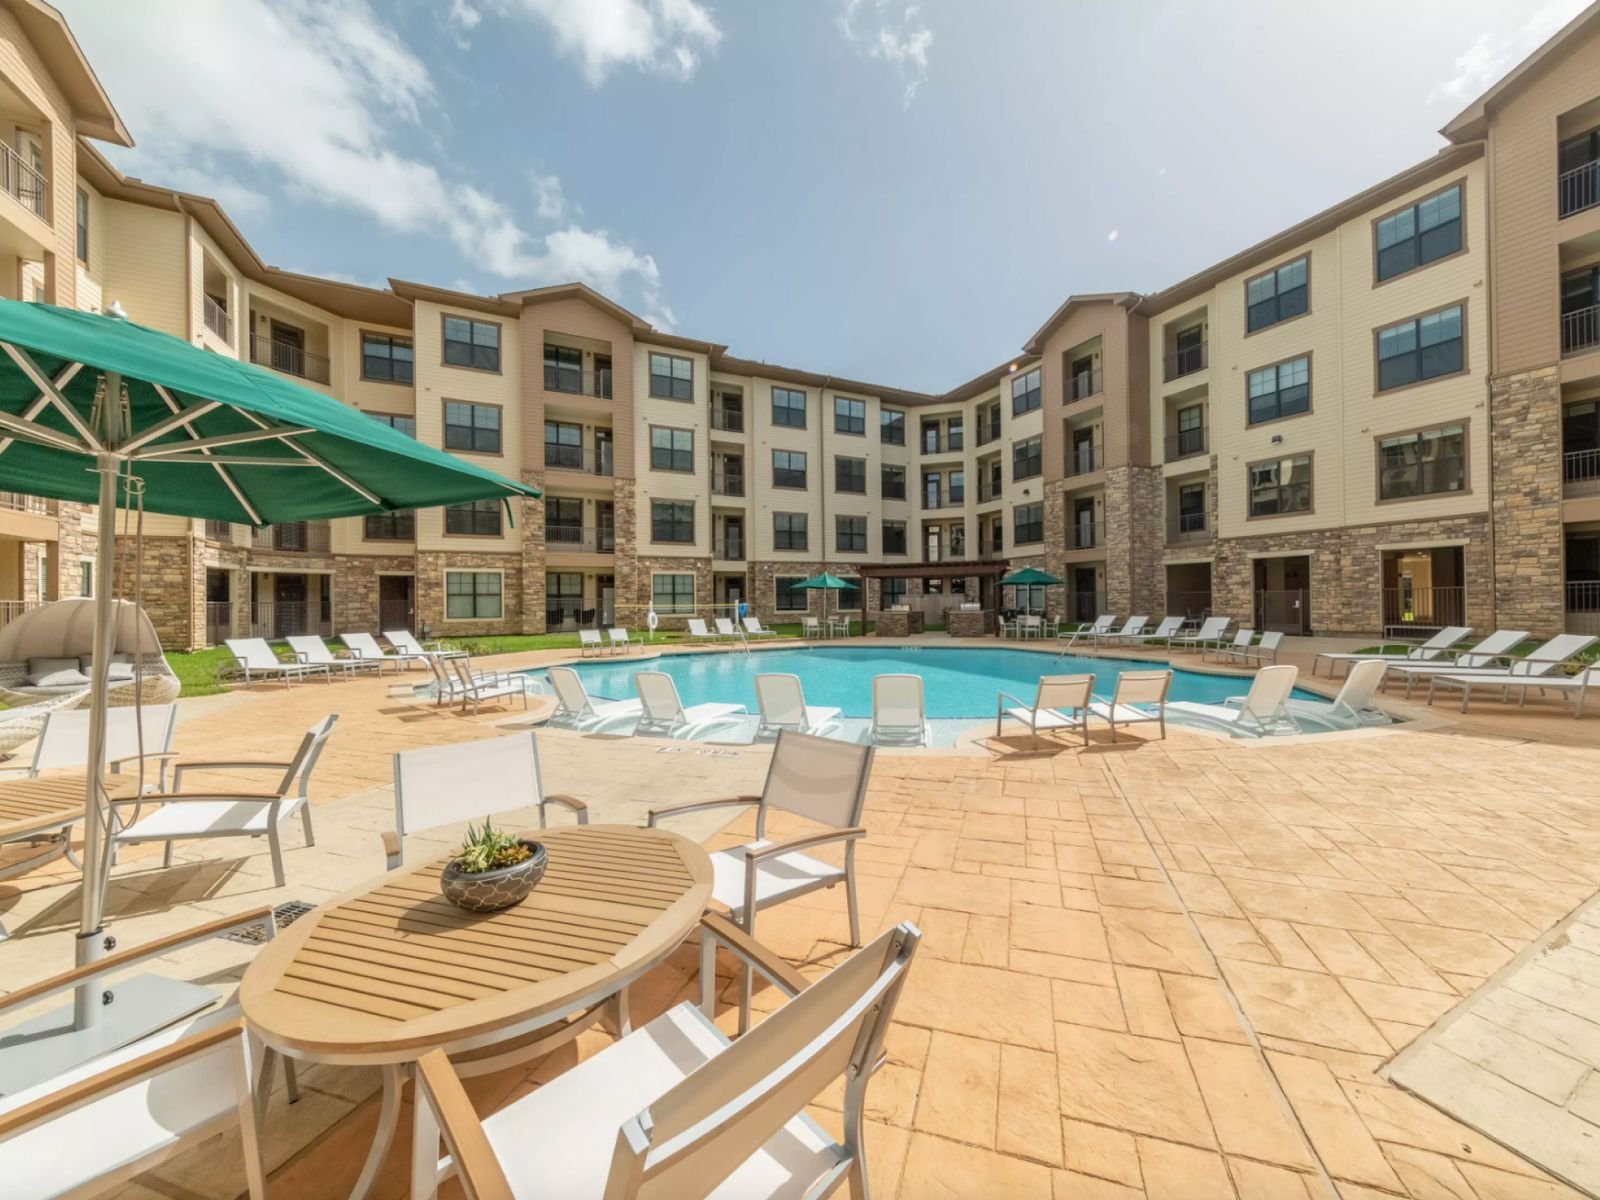
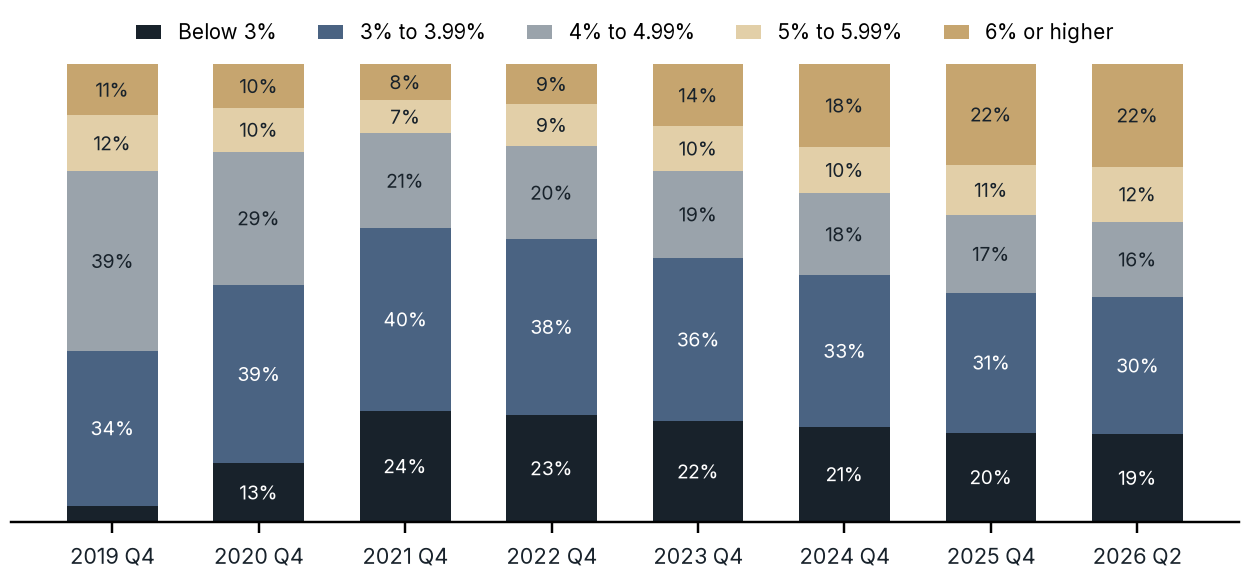
Chart Summary and Key Values
Stacked bar chart of mortgages by interest rate bucket
Source: Federal Housing Finance Agency, National Mortgage Database.
The navy layers at the bottom of each bar are the loans below 4%. They are shrinking slowly as owners sell, but they remain about half of all mortgages. An owner with a 3% loan who moves would pay ~2.4 times that rate on a new loan, so many simply stay. NAR found that sellers had owned their home for a record 11 years before selling.16 Fewer owners selling means fewer starter homes for sale. Existing-home sales ran at a seasonally adjusted annual rate of 3.99 million in September 2026, compared with 6.12 million for all of 2021.17 Lower turnover keeps would-be buyers in the rental pool.
First-time buyers are older and fewer
NAR's 2025 Profile of Home Buyers and Sellers found that first-time buyers fell to a record low 21% of all buyers, and the median first-time buyer is now 40 years old, also a record.18 Before 2008, first-time buyers were historically ~40% of the market, the typical first-time buyer in the 1980s was in their late 20s, and today's first-time buyers cite high rent and student loans as the costs that made saving for a down payment hardest.19
More renter households
The Census Bureau's Housing Vacancy Survey estimates ~46.3 million renter-occupied households in the third quarter of 2026, up from 43.2 million at the end of 2019 and near the highest level on record, set in the second quarter.20 The homeownership rate was 65.5%, which the Census Bureau described as not statistically different from 65.0% in the second quarter, and below the 66.0% of the third quarter of 2022.21
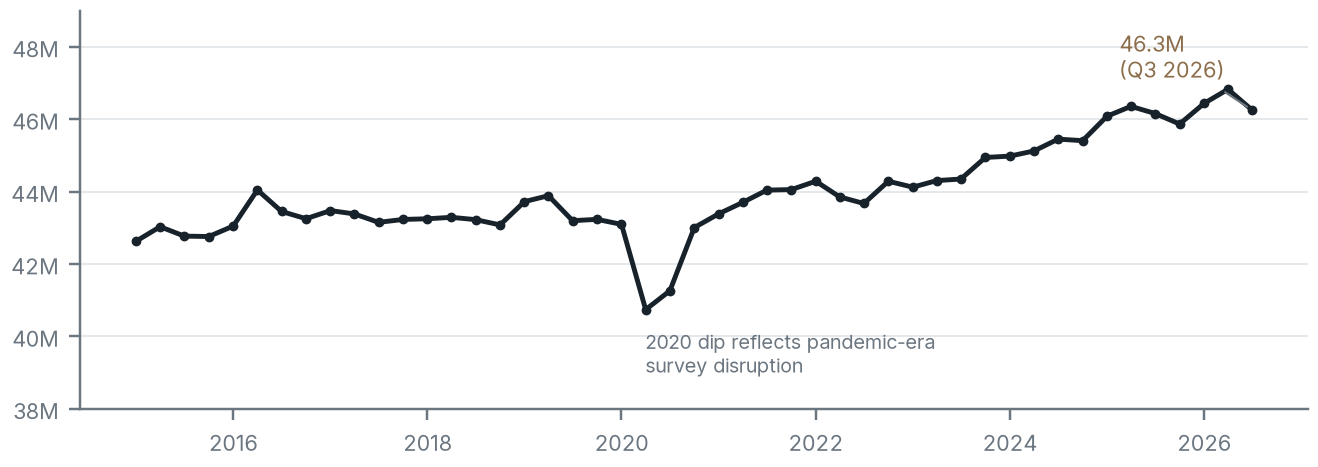
Chart Summary and Key Values
Line chart of U.S. renter households
Source: U.S. Census Bureau, Housing Vacancy Survey, via FRED.
After roughly flat years from 2016 to 2019, renter households have climbed since 2021, and the gains continued as rates rose. Some of the growth reflects new households forming, and some reflects households that might otherwise have bought. Either way, more households need a rental unit. The survey also reports a national rental vacancy rate of 7.6%, up from 7.1% a year earlier and above the 2021 to 2022 lows of ~5.6%.22 The increase reflects the large wave of new apartments completed in 2024 and 2025, which is still being absorbed. We return to this below.
Texas metros keep adding people and jobs
Demand for rental housing starts with people and paychecks, and Houston and Dallas-Fort Worth continue to add both. According to the Census Bureau's Vintage 2025 estimates, the Dallas-Fort Worth-Arlington metro grew from ~7.67 million residents in 2020 to 8.48 million in July 2025, and the Houston-Pasadena-The Woodlands metro grew from ~7.17 million to 7.90 million.23 Together, that is more than 1.5 million new residents in five years, and our Houston Multifamily Development Outlook covers the Houston market in more depth.
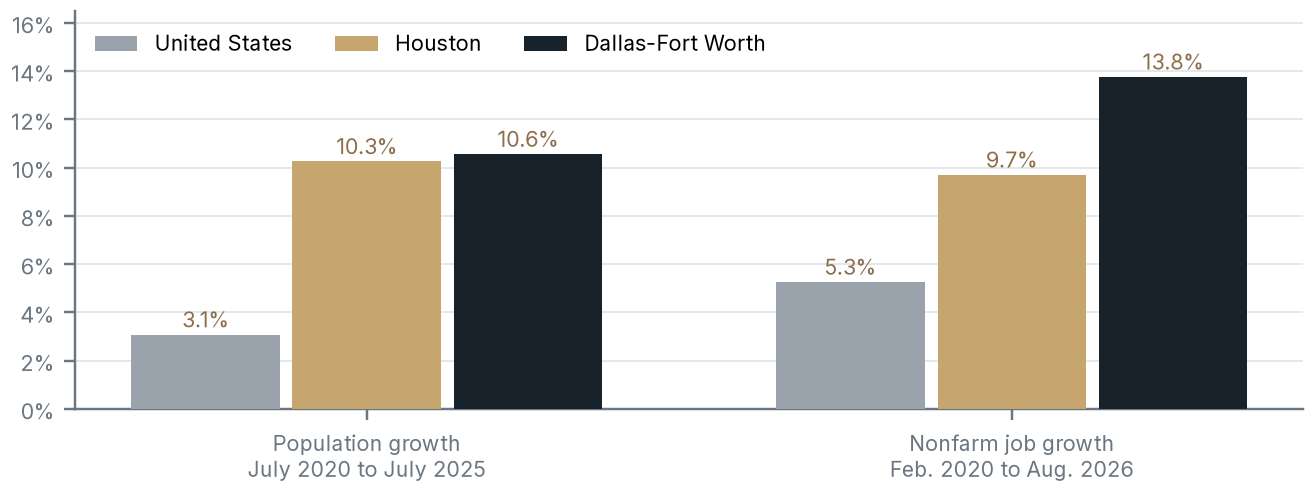
Chart Summary and Key Values
Grouped bar chart of population and job growth in DFW, Houston and the U.S.
Sources: U.S. Census Bureau, Vintage 2025 Population Estimates; U.S. Bureau of Labor Statistics, Current Employment Statistics.
The chart compares each metro's population growth from July 2020 to July 2025, and its job growth from February 2020 to August 2026, with the national figures for the same periods.24 Within DFW, Grand Prairie, a city between Dallas and Fort Worth with a large aerospace and logistics base, grew from 196,100 at the 2020 Census to an estimated 209,434 in July 2025, up 6.8%.25
The Bureau of Labor Statistics reports 4.36 million nonfarm jobs in the Dallas-Fort Worth metro in August 2026, up ~47,000 (1.1%) from a year earlier, and 3.51 million in Houston, up ~40,000 (1.2%); since February 2020, DFW has added ~528,000 jobs and Houston ~310,000.26 Job growth has slowed from the post-pandemic pace, but it remains positive in both metros.
The supply side: a thinner pipeline
High rates affect developers as well as buyers. Construction loans are typically floating-rate and priced off short-term benchmarks; the bank prime rate stands at 7.00%, compared with 3.25% throughout 2021.27 Fewer projects pencil at those rates, and lenders spent most of the past four years pulling back. The pipeline has not closed: starts firmed in 2026 and Houston permits rebounded in 2025, but the national under-construction count is still down by a third from its peak. The Multifamily Supply Cycle Explained: Starts, Deliveries and Absorption covers how permits, starts and deliveries connect, and The 2027–28 Supply Cliff: Six-Market Scorecard compares markets.
Starts, completions and the under-construction count
The Census Bureau reports that starts in buildings with five or more units averaged an annual rate of ~530,000 in 2022, the highest since the mid-1980s, then fell to ~337,000 in 2024 and 395,000 in 2025.28 Starts have firmed somewhat in 2026, averaging ~431,000 from January through August, but the August rate was 344,000.29 Permits for five-plus unit buildings averaged ~476,000 so far in 2026, down ~27% from 656,000 in 2022.30
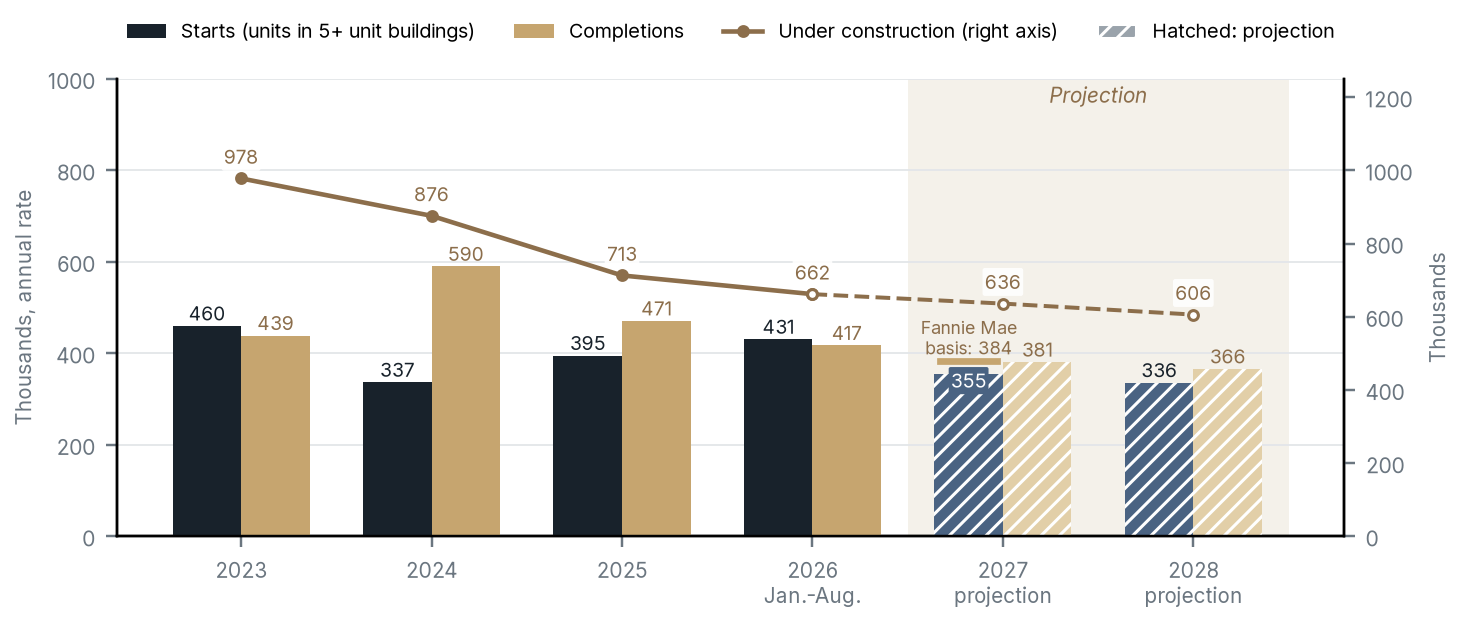
Chart Summary and Key Values
Bar and line chart of multifamily starts, completions and under construction, with projections
Projections are Ascendant estimates based on the Mortgage Bankers Association forecast; the gold marker on 2027 starts shows the result using the Fannie Mae forecast instead. Sources: U.S. Census Bureau, New Residential Construction, via FRED; Mortgage Bankers Association; Fannie Mae.
The completion bars (gold) lag the start bars (navy) by about two years. Completions peaked at a 705,000 annual rate in August 2024 and averaged ~590,000 for 2024, the wave now being absorbed.31 By August 2026 the completion rate had fallen to 302,000, and total housing completions, including single-family, were down 27.1% from a year earlier.32 The line shows the under-construction count: ~666,000 units in August 2026 (the chart's 662,000 is the January-to-August average), down a third from the July 2023 peak of ~1,001,000.33
The hatched bars and the dashed line are projections, not reported data. On our projection, the number of units under construction would fall to ~606,000 in 2028, which means fewer units delivering over the next two years.34 The two published forecasts differ, and applying Fannie Mae's forecast instead would put 2027 starts in five-plus unit buildings at ~384,000 rather than 355,000, so the chart shows that range for 2027.35
The national under-construction count is down by a third from its July 2023 peak.
Most of these apartments are built to rent. The Census Bureau's series on units started for rent in buildings with two or more units peaked at ~523,000 in 2022, fell to ~332,000 in 2024 and was ~393,000 in 2025.36
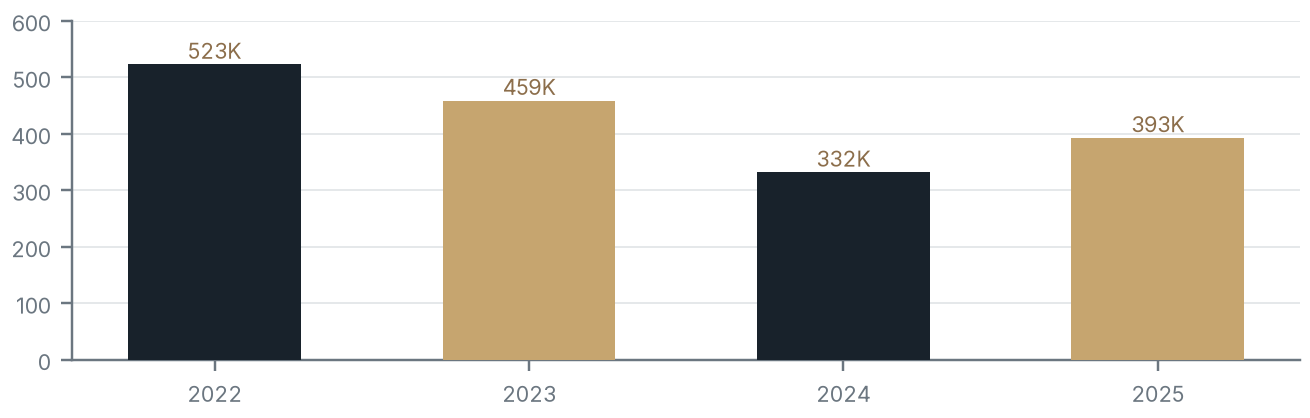
Chart Summary and Key Values
Bar chart of multifamily units started for rent, 2022 to 2025
Source: U.S. Census Bureau, Quarterly Starts by Purpose and Design, via FRED.
Lending standards: tighter again
The Federal Reserve's Senior Loan Officer Opinion Survey asks banks whether they are tightening or easing standards on commercial real estate construction and land development loans. Banks tightened or held standards steady in every survey from April 2022 through April 2026, with tightening peaking at 73.8% in April 2023; after a brief pause, the October 2026 survey showed tightening again.37 In that survey, banks reported tightening standards, on net, for all commercial real estate loan categories, including construction and land development, nonfarm nonresidential and multifamily loans.38
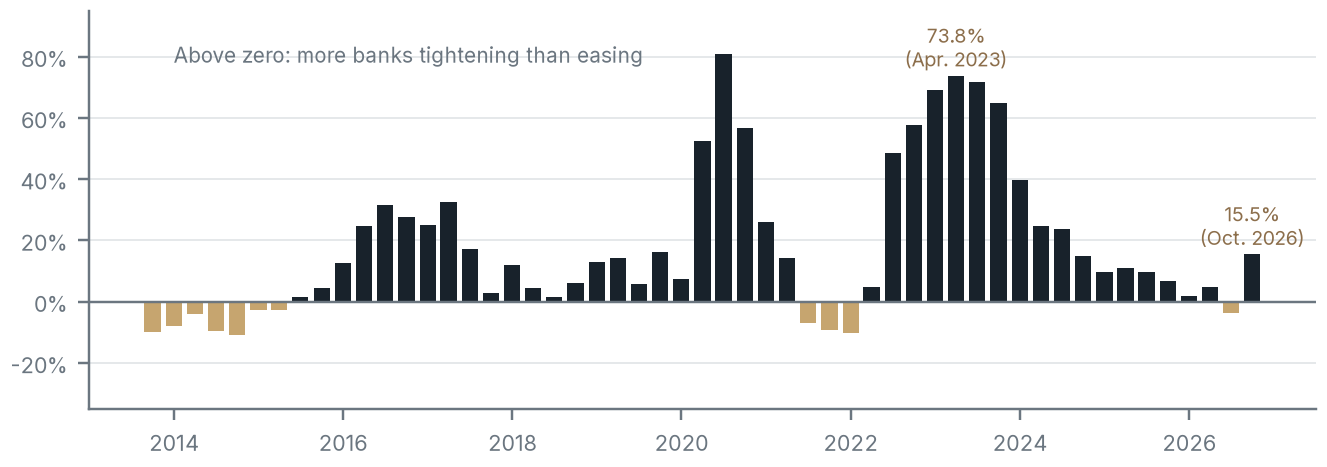
Chart Summary and Key Values
Bar chart of net tightening in construction lending standards
Source: Federal Reserve Board, Senior Loan Officer Opinion Survey, via FRED.
The long run of navy bars from 2022 to 2026 is why projects that might have started in 2023 to 2025 did not. The brief easing in mid-2026 has already reversed. Even if lending loosens further, a project that starts in 2027 typically will not deliver until 2029.
Houston and DFW permits
The same pullback is visible in the two Texas metros. Houston issued permits for ~27,200 units in five-plus unit buildings in 2022 and ~13,800 in the 12 months through August 2026, down ~49%, while DFW went from ~32,700 to ~22,500, down ~31%.39 Most of that drop came in 2023; since then DFW has held at ~22,000 to 24,000 a year, while Houston fell to ~11,500 in 2024, rebounded to ~16,400 in 2025 and eased to ~13,800 in the latest 12 months.40 Census permit counts are not directly comparable with apartment-data providers' figures, such as RealPage's counts for DFW, or the Newmark and CoStar starts and Northmarq permit figures cited in our Houston Multifamily Development Outlook: permits record units authorized in all buildings with five or more units, including condominiums and some student and senior housing, across the full Census metro area, while RealPage tracks starts and deliveries of professionally managed apartment communities within its own market boundaries.
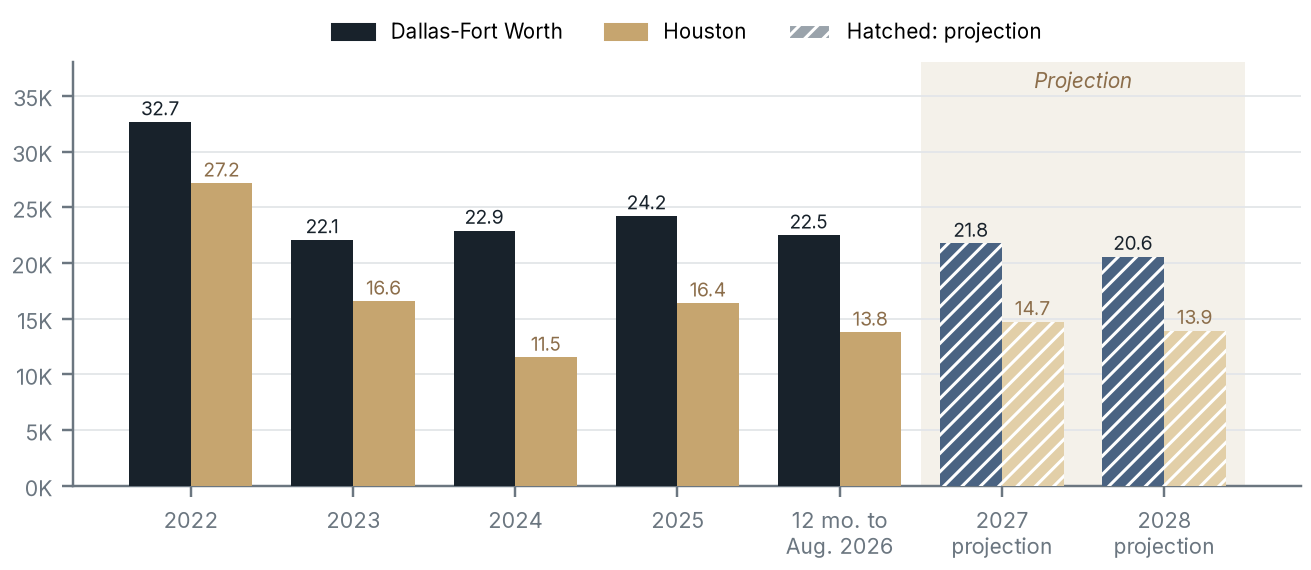
Chart Summary and Key Values
Grouped bar chart of DFW and Houston multifamily permits, with projections
Projections apply the Mortgage Bankers Association national forecast for multifamily starts to each metro's 2025 permits. Sources: U.S. Census Bureau, Building Permits Survey; Mortgage Bankers Association.
Permits lead starts by a few months, and starts lead deliveries by about two years, so this chart is an early look at 2028 supply in both metros. The hatched bars apply the same national forecast declines, 10.2% from 2025 to 2027 and 15.0% from 2025 to 2028, to each metro's 2025 permits; they assume each metro tracks the national forecast, so they are a guide to direction rather than a local forecast.41

Build-to-Rent: serving families priced out of buying
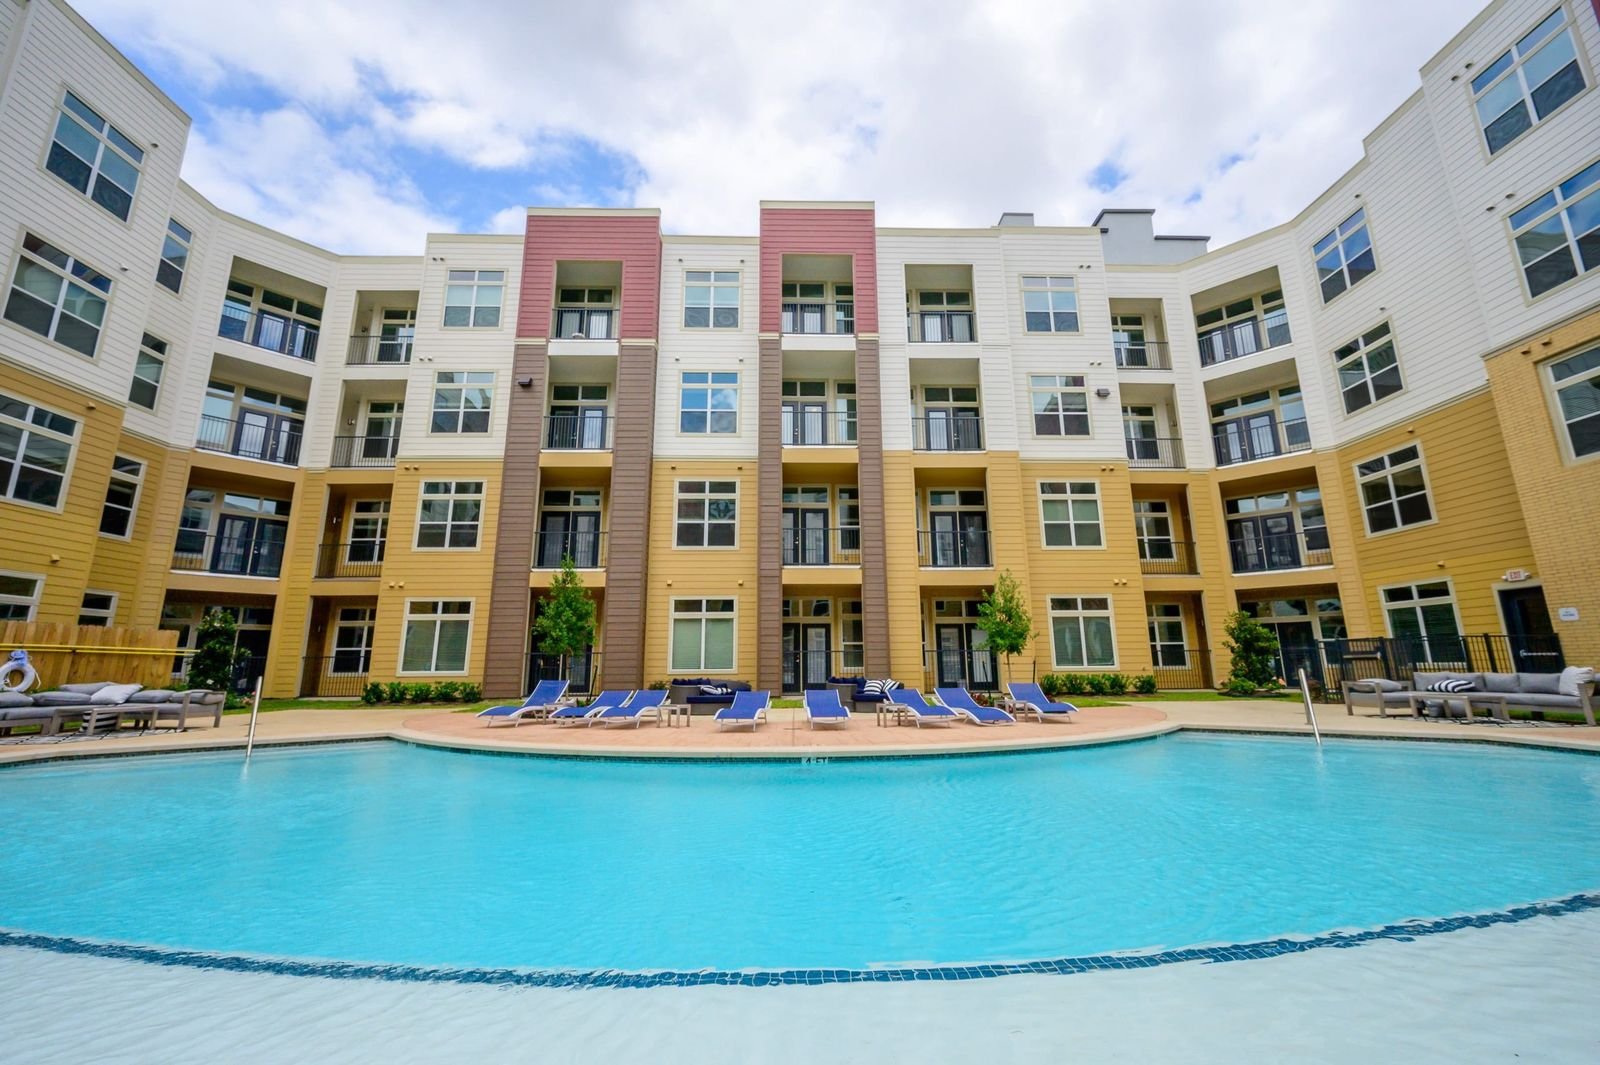
Build-to-Rent (BTR) communities are single-family houses or townhomes built to be leased rather than sold. They give renters a garage, a yard and more space, and they serve exactly the households the affordability data describes: families in their 30s who would have bought a starter home a generation ago.
The National Association of Home Builders (NAHB), analyzing Census Bureau data on starts by purpose of construction, estimates ~84,000 single-family built-for-rent starts in 2024 and 68,000 in 2025, down 19%.42 NAHB puts first-quarter 2026 starts at ~14,000 and second-quarter starts at ~15,000, compared with ~18,000 a year earlier.43 What Is Build-to-Rent? A Guide for Multifamily Investors covers the product in more depth.
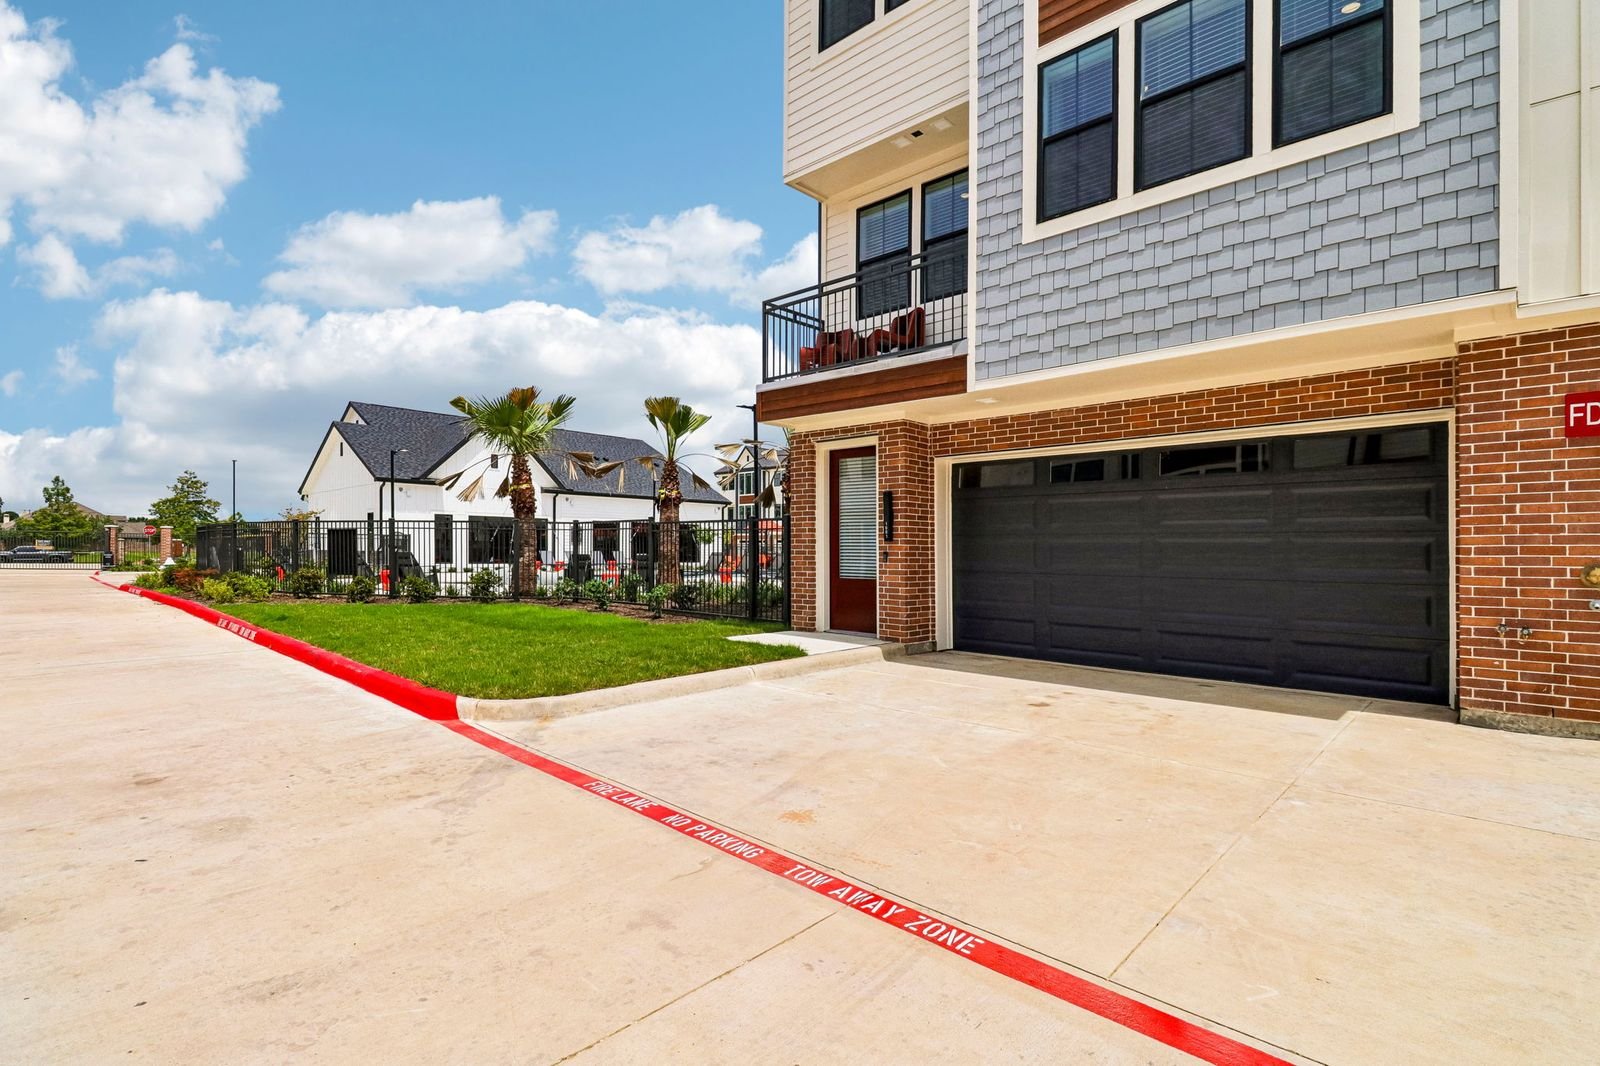
BTR remains a small share of total single-family starts, roughly 7% over the past year, but it fills a gap in the market.43 A household that cannot clear a down payment of ~$61,000 on a typical Houston home (20% of Zillow's typical value), or does not want a 7%-plus mortgage, can still rent a three-bedroom townhome with a garage in a good school district. Ascendant builds both garden-style and BTR communities in the Houston area for this reason.
Historical precedent: what past cycles suggest
Housing markets do not repeat exactly, but the combination of expensive ownership, steady renter demand and falling new supply has happened before. Two episodes help frame today's setup, and each one shows the same basic mechanism.
Early 1980s: record rates and a shift toward renting
Mortgage rates peaked at 18.63% in October 1981 in Freddie Mac's survey and averaged 16.6% for the year.44 The homeownership rate fell from 65.6% in 1980 to 63.8% by 1986, so the renter share of households rose from 34.4% to 36.2%, and it stayed near 36% through 1990.45 Rent of primary residence in the Consumer Price Index rose 8.8% in 1980 and 8.7% in 1981.46 Overall consumer prices rose ~13.5% and ~10.3% in those years, so rents fell after inflation.47
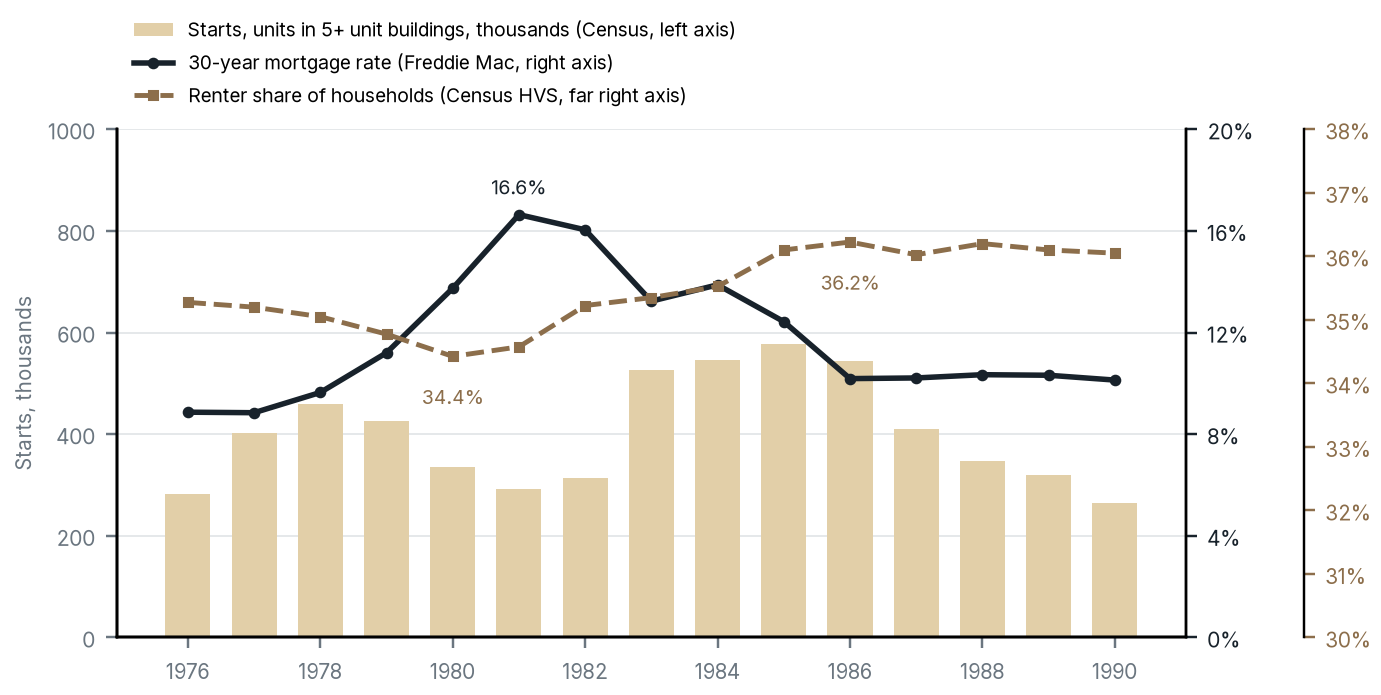
Chart Summary and Key Values
Combination chart of multifamily starts, mortgage rates and renter share, 1976 to 1990
Sources: Freddie Mac; U.S. Census Bureau, New Residential Construction and Housing Vacancy Survey; via FRED.
In the chart, the navy line shows the mortgage rate peaking in 1981, the dashed line shows the renter share climbing through 1986, and the bars show the building response that followed. Multifamily starts jumped from ~293,000 in 1981 to between 527,000 and 577,000 a year from 1983 to 1985, helped by tax incentives in that era.48 The Tax Reform Act of 1986 then scaled back many of those incentives, including by lengthening depreciation periods and limiting passive losses.49 As the surge of new units delivered, the national rental vacancy rate rose from ~5.6% in 1983 to ~7.7% in 1987 and 1988.50 Rent growth slowed to ~4% in 1987 and 1988.51 The lesson for today: high ownership costs pushed households toward renting, but rents did not outpace inflation, and the building surge that followed left the market oversupplied by the late 1980s.
2009 to 2015: a construction collapse, then a tighter market
After the financial crisis, starts in five-plus unit buildings fell from ~266,000 in 2008 to ~100,000 in 2009 and 103,000 in 2010.52 Household formation shifted toward renting as foreclosures and tight mortgage credit kept many families from buying. With little new supply, the national rental occupancy rate rose from 89.4% in 2009 to 93.0% in 2015, and CPI rent growth accelerated from 0.2% in 2010 to 3.6% in 2015.53
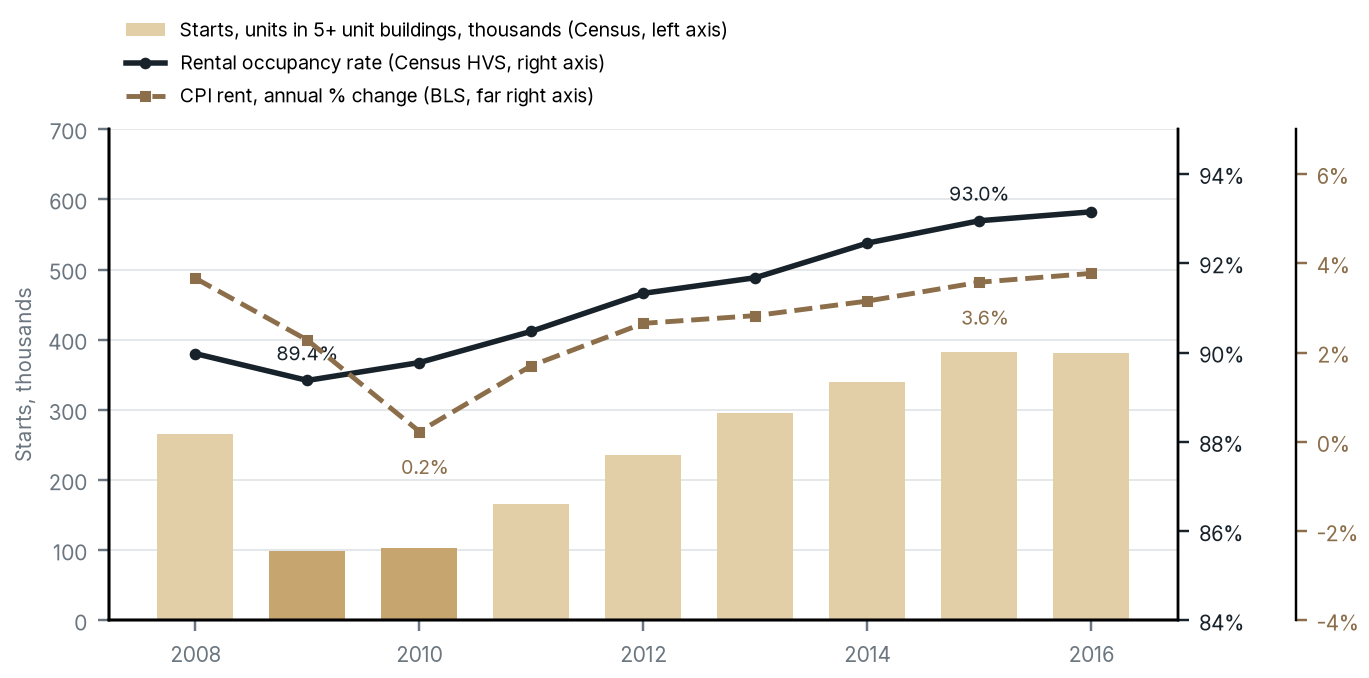
Chart Summary and Key Values
Combination chart of multifamily starts, rental occupancy and rent growth, 2008 to 2016
Sources: U.S. Census Bureau, New Residential Construction and Housing Vacancy Survey; Bureau of Labor Statistics; via FRED.
The darker gold bars mark the trough. Occupancy and rent growth turned within a year or two, and the market stayed tight even as starts recovered, because new supply took years to catch up with the backlog of demand. Developers who started projects in 2010 to 2012 delivered into that improving market.
Drawing the parallel
In both episodes, expensive or unavailable ownership pushed households toward renting, but the outcome depended on supply. After 2009, little new construction led to higher occupancy and faster rent growth within a few years; in the 1980s, a building surge outran demand. Today, the national under-construction count is falling, metro permits are well below their peaks, and population and jobs in Houston and DFW are still growing. That is closer to the post-2009 pattern, although the timing in any one submarket can differ.
What this means for development
In our view, deliveries are falling while the number of renter households keeps rising, which points toward higher occupancy and firmer rents in 2027 and beyond, after the current wave of completions is absorbed. A project that breaks ground in the next 12 to 18 months would typically deliver in 2028, when today's low start counts become low delivery counts.
What if rates fall? In our view, the case does not depend on rates staying high. It rests on new units delivering into a thin pipeline: the communities that will compete for renters in 2027 and 2028 are mostly the ones already under construction, and lower rates cannot add to that count quickly, because a new apartment community takes roughly two years to build. Lower rates would let some renters buy, which trims demand at the margin, but with about half of outstanding mortgages below 4%, most locked-in owners would still have little reason to move.54 Lower rates would also reduce construction and permanent financing costs and tend to support property values, which helps projects that are already underway.
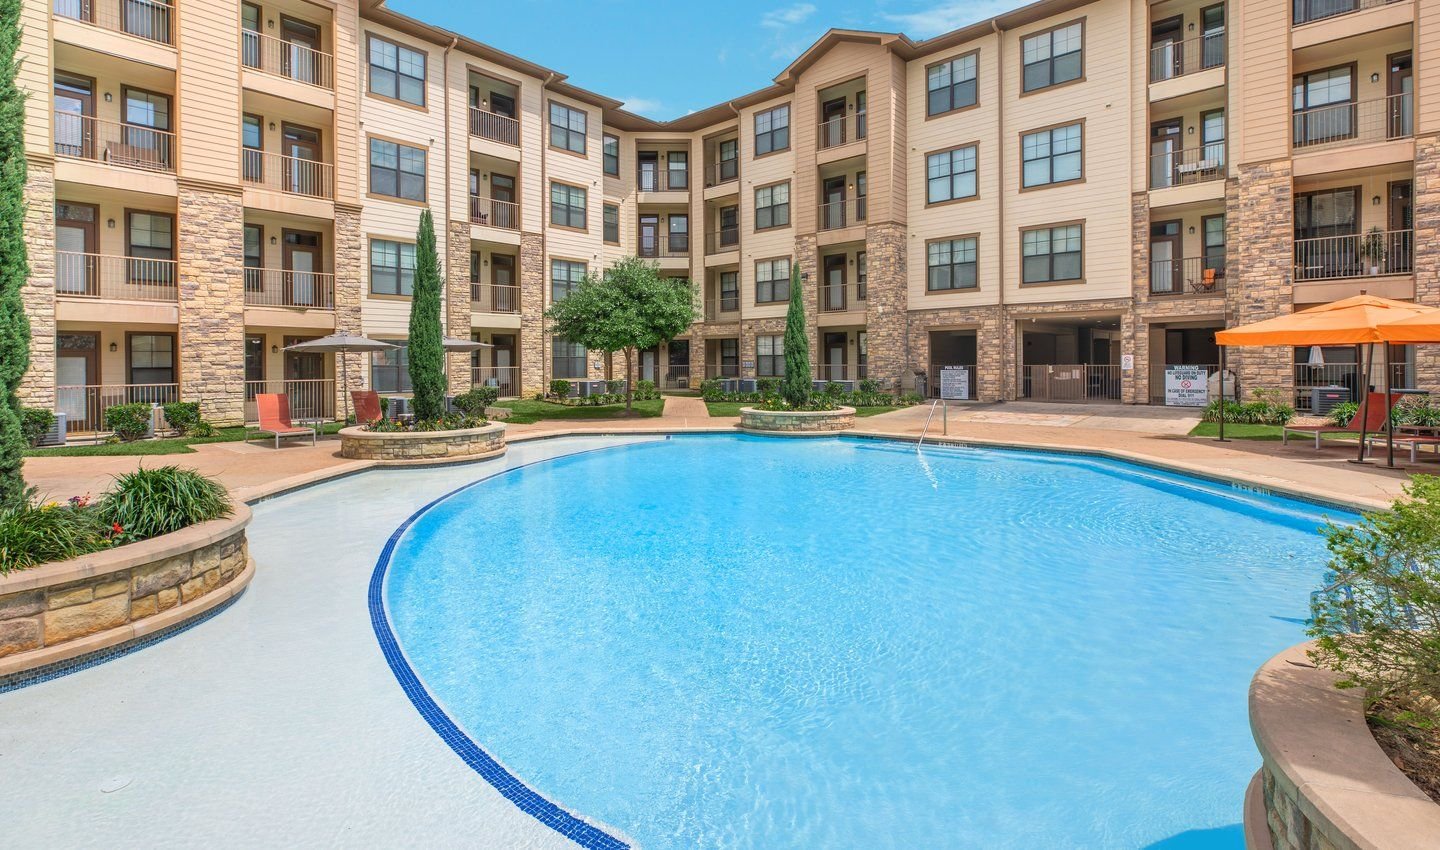
In our view, product matters. The renter pool is growing at both ends: young adults moving in for jobs, and families staying in the rental market longer. Garden-style, mid-rise and BTR communities serve different parts of it. Households priced out of buying are older, more often have children, and want space. Garden-style communities with larger units, and BTR townhomes with garages and yards, serve that renter. We build both in suburban Houston, where land costs allow more space per unit and where school districts and job centers draw families.
Starting into a soft market takes discipline. Rents in both metros remain slightly below a year ago, with Matthews reporting effective rents down 1.0% year over year in the second quarter of 2026 in both Dallas-Fort Worth and Houston, even as leasing has picked up; our Where Renters Are Coming From Deep Dive covers the leasing data.55 In our view, the right discipline is to underwrite current rents and current concessions rather than projected recoveries, so a project can absorb a slower improvement.
What could go wrong
The case above rests on supply thinning while demand holds. Several developments could weaken it or delay it:
- Supply may not fall as far as projected. Starts firmed to an average of ~431,000 from January through August 2026.29 Houston permits also rebounded in 2025, and if lending eases, more projects could start and deliver into the same window.40
- Vacancy is still rising. The national rental vacancy rate reached 7.6% in the third quarter of 2026.22 With rents in both metros still below a year ago, absorbing the 2024 and 2025 delivery wave could take longer than expected.
- Rates could fall faster. The 30-year rate fell for four straight weeks to 7.11%.1 A larger decline would let more renters buy, trimming demand at the margin.
- Population growth is slowing. The Census Bureau estimates that net international migration fell from ~2.7 million in 2024 to ~1.3 million in 2025 and could drop to ~321,000 in the year to July 2026 if current trends continue.56 International migration has been a large source of growth in both metros.
- Operating costs can offset rent gains. Property taxes and insurance have risen sharply in Texas; Insurance and Property Taxes in Texas Multifamily: Why Operating Costs Have Become the Swing Factor covers those costs.
The bottom line
Higher rates have made buying a home more than 80% more expensive on a monthly basis than in 2021, kept owners in place and pushed the typical first-time buyer to age 40. Renter households are near a record level, and Houston and DFW continue to add residents and jobs. Meanwhile, the national construction pipeline is down by a third from its peak, and metro permits are well below 2022 levels. Past cycles suggest that this combination can lead to tighter rental markets (higher occupancy and higher rents) once the current supply is absorbed, as long as new construction does not overshoot demand. In our view, that supports starting well-located, family-oriented garden and BTR communities in the next 12 to 18 months, underwritten to today's rents, so they deliver as new supply thins. Timing in any submarket can differ.
Sources
- Freddie Mac, Primary Mortgage Market Survey, week of November 12, 2026, https://www.freddiemac.com/pmms ↩
- Freddie Mac, 30-Year Fixed Rate Mortgage Average in the United States (MORTGAGE30US), weekly, via Federal Reserve Bank of St. Louis (FRED), https://fred.stlouisfed.org/series/MORTGAGE30US ↩
- S&P Dow Jones Indices, S&P CoreLogic Case-Shiller U.S. National Home Price Index (CSUSHPINSA), via FRED, https://fred.stlouisfed.org/series/CSUSHPINSA ↩
- Federal Housing Finance Agency, All-Transactions House Price Index for the United States (USSTHPI), via FRED, https://fred.stlouisfed.org/series/USSTHPI ↩
- National Association of Realtors, "Existing-Home Sales Increased 1.5% in September, According to NAR Report", https://www.nar.realtor/newsroom/existing-home-sales-increased-1-5-in-september-according-to-nar-report; S&P CoreLogic Case-Shiller U.S. National Home Price Index (see note 3); the 58.8% is an Ascendant calculation from the index values for January 2020 (212.355) and July 2026 (337.306). ↩
- National Association of Realtors, Housing Affordability Index (annual median price, effective rate, monthly payment and index values), https://www.nar.realtor/research-and-statistics/housing-statistics/housing-affordability-index ↩
- Ascendant calculation: 30-year fixed loan with 20% down, using the NAR September 2026 median price (see note 5) and Freddie Mac's September 2026 average weekly rate of 6.86% (see note 2); principal and interest only. ↩
- National Association of Realtors, Housing Affordability Index (see note 6). ↩
- National Association of Realtors, Housing Affordability Index (see note 6). ↩
- National Association of Realtors, Housing Affordability Index (Fixed) (FIXHAI), via FRED, https://fred.stlouisfed.org/series/FIXHAI ↩
- Zillow Research, Zillow Home Value Index (ZHVI, all homes, typical value) and Zillow Observed Rent Index (ZORI), metro data, https://www.zillow.com/research/data/; Freddie Mac, MORTGAGE30US (see note 2), 2.90% in September 2021; Ascendant calculation: monthly principal and interest on the Zillow typical home value with 20% down and a 30-year fixed loan, minus the Zillow typical rent for the same month, excluding property taxes, insurance, maintenance and closing costs. ↩
- Zillow, ZHVI and ZORI (see note 11); Freddie Mac, MORTGAGE30US (see note 2), average of the September 2026 weekly rates, 6.86%; Ascendant calculation (method in note 11). ↩
- Lincoln Institute of Land Policy and Minnesota Center for Fiscal Excellence, 50-State Property Tax Comparison Study for Taxes Paid in 2025, Appendix Table 5b, https://www.lincolninst.edu/publications/other/50-state-property-tax-comparison-study-2025/; Zillow, ZHVI (see note 11), Houston typical home value of $302,832 in September 2026; Ascendant approximation: value × 1.27% ÷ 12, less the $49 principal-and-interest advantage, excluding insurance. ↩
- Zillow, ZHVI (see note 11); Ascendant calculation at 20% of the September 2026 typical home value. NAR's median sale price (see note 5) is higher, which gives the $83,500 figure in the text. ↩
- Federal Housing Finance Agency, National Mortgage Database, outstanding mortgage statistics, national, quarterly, https://www.fhfa.gov/data/nmdb ↩
- National Association of Realtors, 2025 Profile of Home Buyers and Sellers, Highlights, https://www.nar.realtor/sites/default/files/2025-11/2025-profile-of-home-buyers-and-sellers-highlights-11-04-2025.pdf ↩
- National Association of Realtors, September 2026 existing-home sales (see note 5); National Association of Realtors, "Annual Existing-Home Sales Hit Highest Mark Since 2006", January 20, 2022, https://www.globenewswire.com/news-release/2022/01/20/2370344/0/en/Annual-Existing-Home-Sales-Hit-Highest-Mark-Since-2006.html ↩
- National Association of Realtors, "First-Time Home Buyer Share Falls to Historic Low of 21%, Median Age Rises to 40", https://www.nar.realtor/press-releases/first-time-home-buyer-share-falls-to-historic-low-of-21-median-age-rises-to-40 ↩
- National Association of Realtors, 2025 Profile of Home Buyers and Sellers, Highlights (see note 16). ↩
- U.S. Census Bureau, Quarterly Residential Vacancies and Homeownership, Third Quarter 2026, October 28, 2026, https://www.census.gov/housing/hvs/current/index.html; U.S. Census Bureau, Housing Vacancy Survey: renter-occupied housing units (ERNTOCCUSQ176N), homeownership rate (RHORUSQ156N) and rental vacancy rate (RRVRUSQ156N), via FRED, https://fred.stlouisfed.org/series/ERNTOCCUSQ176N ↩
- U.S. Census Bureau, Housing Vacancy Survey (see note 20). ↩
- U.S. Census Bureau, Housing Vacancy Survey (see note 20). ↩
- U.S. Census Bureau, Vintage 2025 Population Estimates, Metropolitan and Micropolitan Statistical Areas, https://www2.census.gov/programs-surveys/popest/datasets/2020-2025/metro/totals/cbsa-est2025-alldata.csv ↩
- U.S. Census Bureau, Vintage 2025 Population Estimates, metro areas (see note 23) and national and state totals, https://www2.census.gov/programs-surveys/popest/datasets/2020-2025/state/totals/NST-EST2025-ALLDATA.csv; U.S. Bureau of Labor Statistics, Current Employment Statistics, All Employees: Total Nonfarm, not seasonally adjusted, for Dallas-Fort Worth-Arlington, TX (DALL148NA), https://fred.stlouisfed.org/series/DALL148NA, Houston-Pasadena-The Woodlands, TX (HOUS448NA), https://fred.stlouisfed.org/series/HOUS448NA, and the United States (PAYNSA), https://fred.stlouisfed.org/series/PAYNSA, via FRED. ↩
- U.S. Census Bureau, QuickFacts: Grand Prairie city, Texas, https://www.census.gov/quickfacts/grandprairiecitytexas ↩
- U.S. Bureau of Labor Statistics, Current Employment Statistics (see note 24). ↩
- Board of Governors of the Federal Reserve System, Bank Prime Loan Rate (DPRIME), via FRED, https://fred.stlouisfed.org/series/DPRIME ↩
- U.S. Census Bureau, New Residential Construction: units in buildings with 5 units or more, starts (HOUST5F), completions (COMPU5MUSA), under construction (UNDCON5MUSA) and permits (PERMIT5), via FRED, https://fred.stlouisfed.org/series/HOUST5F ↩
- U.S. Census Bureau, Monthly New Residential Construction, August 2026, https://www.census.gov/construction/nrc/index.html; U.S. Census Bureau, New Residential Construction, via FRED (see note 28). ↩
- U.S. Census Bureau, New Residential Construction, via FRED (see note 28). ↩
- U.S. Census Bureau, New Residential Construction, via FRED (see note 28). ↩
- U.S. Census Bureau, Monthly New Residential Construction, August 2026 (see note 29). ↩
- U.S. Census Bureau, New Residential Construction, via FRED (see note 28). ↩
- Ascendant calculation from U.S. Census Bureau completions and under-construction data (see note 28) and the Mortgage Bankers Association, Mortgage Finance Forecast, September 16, 2026, housing starts in buildings with two or more units of 413,000 in 2025, 371,000 in 2027 and 351,000 in 2028, https://www.mba.org/docs/default-source/research-and-forecasts/forecasts/2026/mortgage-finance-forecast-sep-2026.pdf ↩
- Ascendant calculation: the 2025 count of starts in five-plus unit buildings (see note 28) multiplied by the change in Fannie Mae's forecast for starts in buildings with two or more units from 2025 (415,000) to 2027 (403,000); Fannie Mae, Economic and Strategic Research Group, Housing Forecast, October 12, 2026, multifamily (two or more units) starts of 415,000 in 2025, 438,000 in 2026 and 403,000 in 2027, https://www.fanniemae.com/media/document/pdf/housing-forecast-102026 ↩
- U.S. Census Bureau, Housing Units Started for Rent in Buildings with 2 Units or More (HOUSTPFR2UMQ), via FRED, https://fred.stlouisfed.org/series/HOUSTPFR2UMQ ↩
- Board of Governors of the Federal Reserve System, Senior Loan Officer Opinion Survey on Bank Lending Practices, October 2026, https://www.federalreserve.gov/data/sloos/sloos-202610.htm; Board of Governors of the Federal Reserve System, Net Percentage of Domestic Banks Tightening Standards for Commercial Real Estate Loans: Construction and Land Development Loans (SUBLPDRCSC), via FRED, https://fred.stlouisfed.org/series/SUBLPDRCSC ↩
- Board of Governors of the Federal Reserve System, Senior Loan Officer Opinion Survey, October 2026 (see note 37). ↩
- U.S. Census Bureau, Building Permits Survey, metropolitan and CBSA annual and year-to-date files, units in buildings with 5 units or more, https://www2.census.gov/econ/bps/ ↩
- U.S. Census Bureau, Building Permits Survey (see note 39): DFW 22,074 (2023), 22,912 (2024), 24,213 (2025) and 22,489 (12 months to August 2026); Houston 16,558, 11,520, 16,390 and 13,772. ↩
- Ascendant calculation from U.S. Census Bureau, Building Permits Survey (see note 39) and the Mortgage Bankers Association forecast (see note 34). ↩
- National Association of Home Builders, Eye on Housing, "Weaker Conditions for Single-Family Built-for-Rent Housing", March 12, 2026, https://eyeonhousing.org/2026/03/weaker-conditions-for-single-family-built-for-rent-housing/ ↩
- National Association of Home Builders, Eye on Housing, "Second Quarter Declines for Single-Family Built-to-Rent", August 21, 2026, https://eyeonhousing.org/2026/08/second-quarter-declines-for-single-family-built-to-rent/; NAHB, Eye on Housing, first-quarter 2026 built-for-rent analysis (see note 42). ↩
- Freddie Mac, MORTGAGE30US (see note 2). ↩
- U.S. Census Bureau, Housing Vacancy Survey, homeownership rate (see note 20); renter share is 100 minus the homeownership rate, annual average. ↩
- U.S. Bureau of Labor Statistics, Consumer Price Index: Rent of Primary Residence, U.S. city average (CUUR0000SEHA), via FRED, https://fred.stlouisfed.org/series/CUUR0000SEHA; annual-average changes for 1980 and 1981. ↩
- U.S. Bureau of Labor Statistics, Consumer Price Index for All Urban Consumers: All Items, U.S. city average, annual averages, https://www.bls.gov/cpi/ ↩
- U.S. Census Bureau, New Residential Construction, via FRED (see note 28). ↩
- Congress.gov, H.R. 3838, Tax Reform Act of 1986 (Public Law 99-514), https://www.congress.gov/bill/99th-congress/house-bill/3838 ↩
- U.S. Census Bureau, Housing Vacancy Survey, rental vacancy rate (RRVRUSQ156N), annual averages (see note 20). ↩
- U.S. Bureau of Labor Statistics, CPI rent of primary residence (see note 46), annual-average changes of 4.1% in 1987 and 3.8% in 1988. ↩
- U.S. Census Bureau, New Residential Construction, via FRED (see note 28). ↩
- U.S. Census Bureau, Housing Vacancy Survey, rental vacancy rate (see note 20), with occupancy calculated as 100 minus the vacancy rate, annual average; U.S. Bureau of Labor Statistics, CPI rent of primary residence (see note 46). ↩
- Federal Housing Finance Agency, National Mortgage Database (see note 15). ↩
- Matthews, "Dallas-Fort Worth, TX Multifamily Market Report Q2 2026", August 13, 2026, https://www.matthews.com/insights/dallas-fort-worth-multifamily-market-report-q2-2026; Matthews, "Houston, TX Multifamily Market Report Q2 2026", August 12, 2026, https://www.matthews.com/insights/houston-multifamily-q2-2026 ↩
- U.S. Census Bureau, "U.S. Population Growth Slows Due to Historic Decline in Net International Migration", January 27, 2026, https://www.census.gov/newsroom/press-releases/2026/population-growth-slows.html ↩
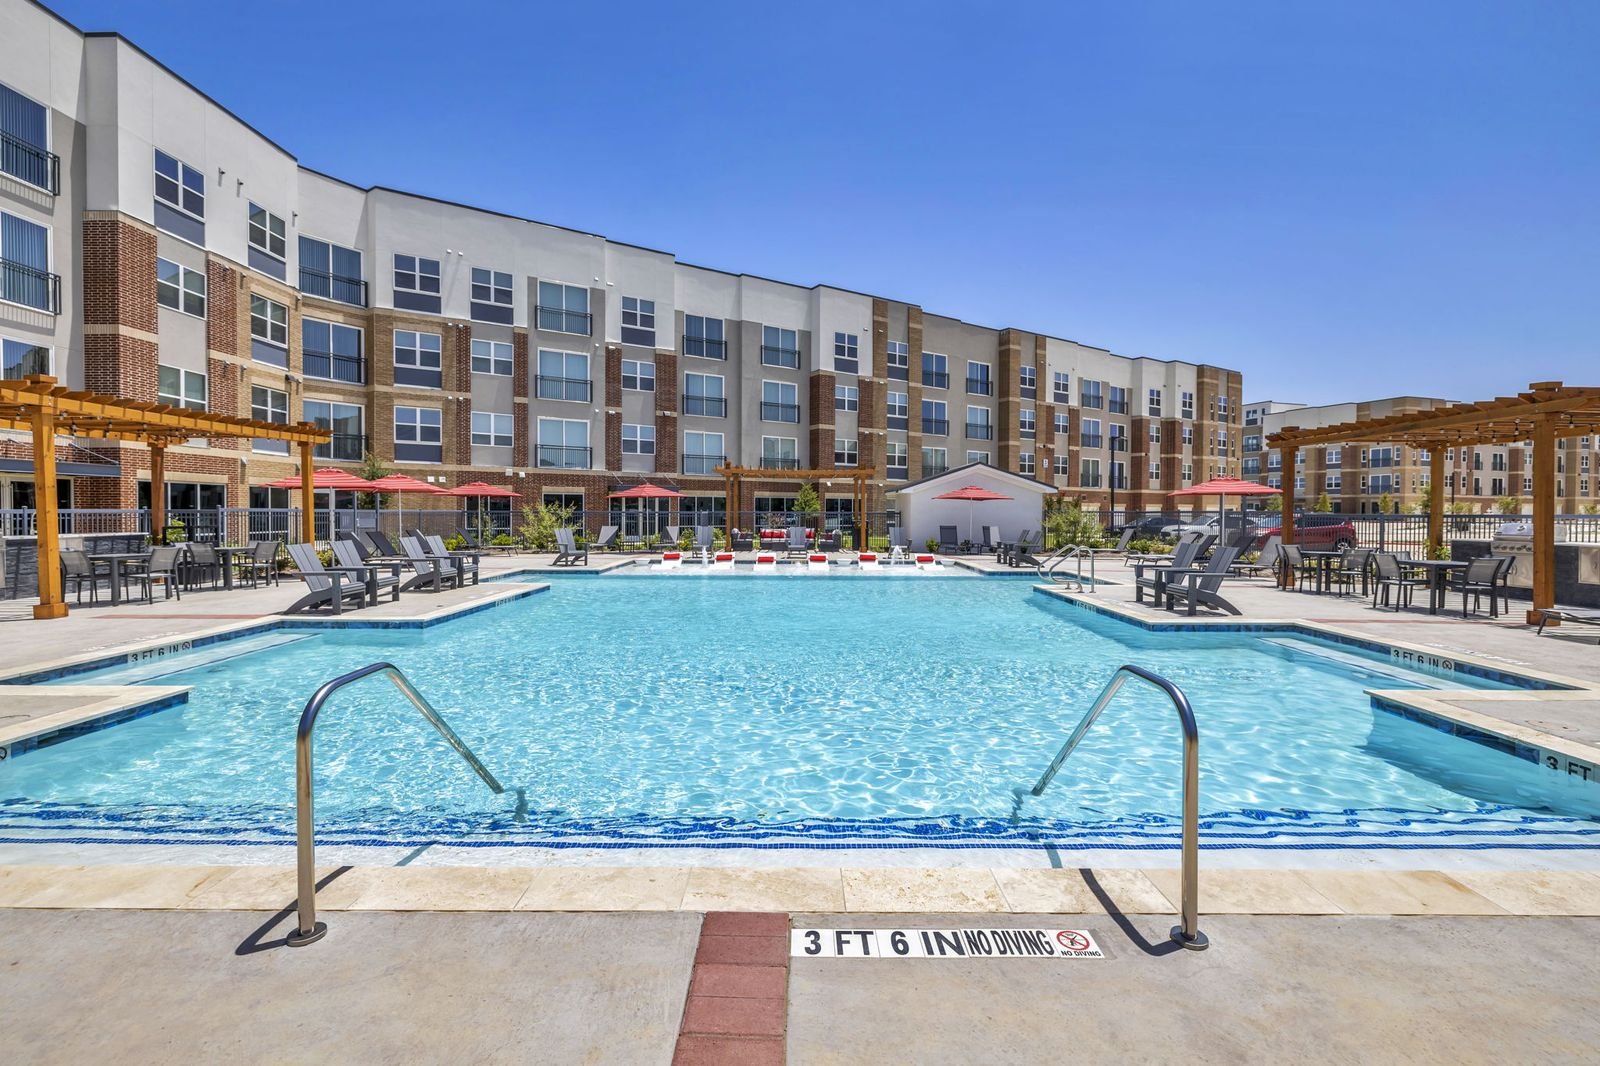
Important disclosures
This article is for educational purposes only and is not an offer to sell or a solicitation of an offer to buy any security. Any offering by Ascendant Development or its affiliates is made only to verified accredited investors under Rule 506(c) of Regulation D through definitive offering documents, which should be read in full, including the risk factors. Real estate development involves risk, including the possible loss of principal, and is illiquid. Nothing here is tax, legal or investment advice; consult your own advisors. Forward-looking statements are not guarantees. Hypothetical examples are for illustration only and are not projections or the terms of any offering. Photographs show completed or existing Ascendant projects. They are shown to illustrate the firm's work and do not represent any specific current offering.