
Key takeaways
- The Fed is tightening to chase the last fraction of a point of inflation, into an energy shock that is already fading; on its own projections, the hiking path buys the last half point over several years.
- Since 1960, PCE inflation has been at or below 2% in only ~34% of months, and the 2026 overshoot comes mostly from tariffs, energy and AI-related price pressures, not an overheated labor market.
- Rates are landing on housing, real estate and small business while AI investment, a major driver of growth, is largely insulated; the economy needs growth on more than one leg.
- The paper recommends one decisive cut of 150–200 bp to ~1.75%–2.50%, a stated hold and a published inflation-tranche framework with tripwires.
- Healthy inflation is rising pay, steady jobs and a predictable Fed, not 2% at any cost.
Executive Summary
The Federal Reserve is tightening policy to chase the last fraction of a point of inflation, and it is doing so into an energy shock that is already fading. This paper argues that the Fed is aiming at the wrong target with the wrong tool. The goal of economic policy is rising real incomes and steady jobs, not a particular inflation number. A 2% target is a reasonable long-run anchor, but it is not a line worth a housing recession, lost jobs or a lost cohort of new apartment supply. The deeper problem is balance. AI investment and the manufacturing that supplies it have become a major driver of growth, and the economy is too reliant on them. Rate hikes are shrinking the sectors that would help carry the economy if that engine slows: housing, real estate and small business. The economy needs growth on more than one leg.
As of mid-November 2026, the federal funds target range stood at 3.75%–4.00% after a September hike, with two officials dissenting in October in favor of another increase.1 That midpoint, 3.875%, sits ~0.7 point above the Fed's own median estimate of the longer-run neutral rate, 3.2%.2 The Fed's own projections show headline PCE inflation falling to 2.3% in 2027 and core PCE to 2.5%, with unemployment flat at 4.1%, yet they keep the policy rate at 4.1% through 2027. On the Fed's own numbers, the hiking path buys the last half point over several years. That is the mosquito, and rate hikes are the sledgehammer.
Six findings anchor the case:
- 2% is the exception, not the rule. Since 1960, year-over-year PCE inflation has been at or below 2% in only ~34% of months and within a quarter point of 2% in only ~12%, and the Fed has missed in both directions, undershooting for most of 2012–2020.3
- The 2026 overshoot comes mostly from relative-price shocks, not an overheated labor market. A sitting Fed official, Vice Chair for Supervision Michelle Bowman, estimates that tariffs, energy and AI-related price pressures each account for roughly one-fourth of above-target core inflation, and she judges that the labor market "does not appear to be tight."4
- Rates are landing on the wrong part of the economy. Equipment investment grew at a 20.9% annual rate in the third quarter while residential investment fell 3.3%.5 Builder sentiment is at its lowest since 2012, and residential construction employment has declined year over year for 20 straight months.6
- AI investment is carrying a large share of growth. By Jason Furman's mechanical accounting, information-processing equipment and software, ~4% of GDP, accounted for ~92% of U.S. GDP growth in the first half of 2025, although he estimated that lower rates and other activity might have made up about half of that without the AI boom.7 In October, several of the manufacturing industries reporting growth were part of the data-center supply chain, while the building-materials industry contracted.8 The economy is too reliant on that driver: if AI investment slows, it needs housing, real estate and small business ready to carry more of the load, and policy is shrinking them.
- Higher rates can raise rents. Federal Reserve research finds that rents rise after contractionary policy shocks, and mortgage lock-in freezes the existing housing stock.9 The apartment completions pipeline is forecast to bottom ~35% below its 2024 peak in 2027.10
- Predictability is itself a form of support. Research consistently finds that policy uncertainty delays hard-to-reverse investment, and real estate development is the textbook case.11
This is a minority view. As of mid-November 2026, most Fed officials and markets leaned toward more tightening. This paper argues from where policy lands first: housing, construction and small business. It engages the strongest objections directly in Section 14 and proposes explicit tripwires that would justify tightening. The aim is not looser policy for its own sake. It is a steadier policy that protects the income side of the economy while a supply shock fades.
1. The Wrong Fight
Before the Iran war began on Feb. 28, 2026, core CPI inflation was running at 2.5% year over year.12 Eight months later, the Fed is in a hiking phase. It raised its target range in September for the first time since July 2023, and by Nov. 10 markets had all but fully priced another hike in December, with ~88% odds of 25 bp and ~11% odds of 50 bp.13 The trigger was a surge in energy prices after the disruption of oil flows through the Strait of Hormuz, layered on top of tariff effects and a burst of AI-related demand for specialized equipment and power.
The Fed's case for tightening is not frivolous. Inflation has run above 2% for more than five years, headline PCE inflation was 3.6% in September, and core PCE was 3.1%.14 Officials fear that another shock, arriving before the last one has fully passed, could unmoor expectations. Those concerns deserve a serious answer, and this paper offers one.
The answer starts with what monetary policy can and cannot do. Rate hikes do not pump oil, reopen shipping lanes or reverse tariffs. They work by slowing demand, mostly in the sectors most sensitive to borrowing costs: housing, commercial real estate and small business. In 2026, those are precisely the sectors that are already contracting, while the sector driving growth, AI-related capital spending, is financed largely from cash flow and public capital markets. The result is a two-speed economy in which hikes land on the slow lane.
The paper makes six arguments. First, the 2% target is a convention that has rarely held, and the difference between 2% and 2.5% is small. Second, inflation is better judged in tranches, against whether jobs and incomes are growing. Third, the 2026 spike is substantially a supply shock, and hiking into supply shocks has a poor record. Fourth, the burden of tightening is falling on housing, real estate and small firms, the sectors that would help carry growth if AI investment slows, while the sectors that are thriving are largely insulated from rates. Fifth, more supply is a better cure for high rents and high home prices than demand destruction. Sixth, a clear, committed path gives businesses the predictability they need to invest and hire.
2. Conditions as of Mid-November 2026
Inflation is elevated but cooling at the margin, expectations in markets remain close to target, and labor costs are not accelerating. Meanwhile, the price of credit that matters most for housing has risen sharply. The 30-year mortgage averaged 7.11% in the week of Nov. 12, up from 6.24% a year earlier.15 Builder confidence fell to 29 in October, the lowest reading since June 2012, and 43% of builders cut prices.16
| Indicator | Latest reading | What it tells us |
|---|---|---|
| Fed funds target range | 3.75%–4.00% (midpoint 3.875%) | Hiked Sept. 16; held Oct. 28 with two dissents for a hike |
| FOMC median neutral rate | 3.2% (longer run) | Policy sits ~0.7 point above the Fed's own neutral |
| PCE inflation, y/y (Sept.) | 3.6% headline; 3.1% core | Above target, energy-led |
| PCE inflation, Q3 annualized | 2.1% headline; 2.5% core | Down from 5.0% and 3.3% in Q2 |
| Unemployment (Oct.) | 4.1% | Stable; Fed projects 4.1% through 2029 |
| Average hourly earnings, y/y (Oct.) | 3.1% | Below headline inflation: real pay slipping |
| 10-year breakeven inflation (Nov. 13) | ~2.2% | Market expectations near target |
| Michigan inflation expectations (Nov. prelim.) | 4.3% one-year; 3.4% long-run | Both fell from October |
| 30-year fixed mortgage (Nov. 12) | 7.11% | Up from 6.24% a year earlier |
| NAHB Housing Market Index (Oct.) | 29 | Lowest since June 2012 |
Table Summary and Key Values
Column headings: Indicator, Latest reading, What it tells us.
Table Summary and Key Values
A snapshot of the policy rate, the Fed's neutral estimate, inflation, jobs, wages, inflation expectations, mortgage rates and builder sentiment in mid-November 2026. Policy sits ~0.7 point above the Fed's own neutral estimate while quarterly inflation has slowed to 2.1% annualized.
Source: Federal Reserve Board; BEA; BLS; University of Michigan; Freddie Mac; NAHB; FRED.
Exhibit 2 shows the core of the Fed's own forecast. Its median projections have headline PCE inflation at 2.3% and core at 2.5% in 2027, falling to 2.0% by 2029, with unemployment at 4.1% every year.17 Yet the projected policy rate stays at 4.1% in 2026 and 2027, well above the 3.2% neutral rate. The Fed expects inflation to return close to target on its own as the shock passes. The question is why it should hold policy restrictive while that happens, given the costs documented in this paper.
Exhibit 3 places the current moment in context. From March 2022 to July 2023, the Fed raised its target range by 525 bp, to 5.25%–5.50%. From September 2024 to December 2025, it cut 175 bp, to 3.50%–3.75%.18 In September 2026, it hiked again and signaled more. Borrowing benchmarks followed: the 2-year Treasury yield fell from ~5.2% in October 2023 to ~3.4% in early 2026, then climbed back toward ~4.9%.19 For a business planning a multi-year project, that is not a policy path. It is whiplash.
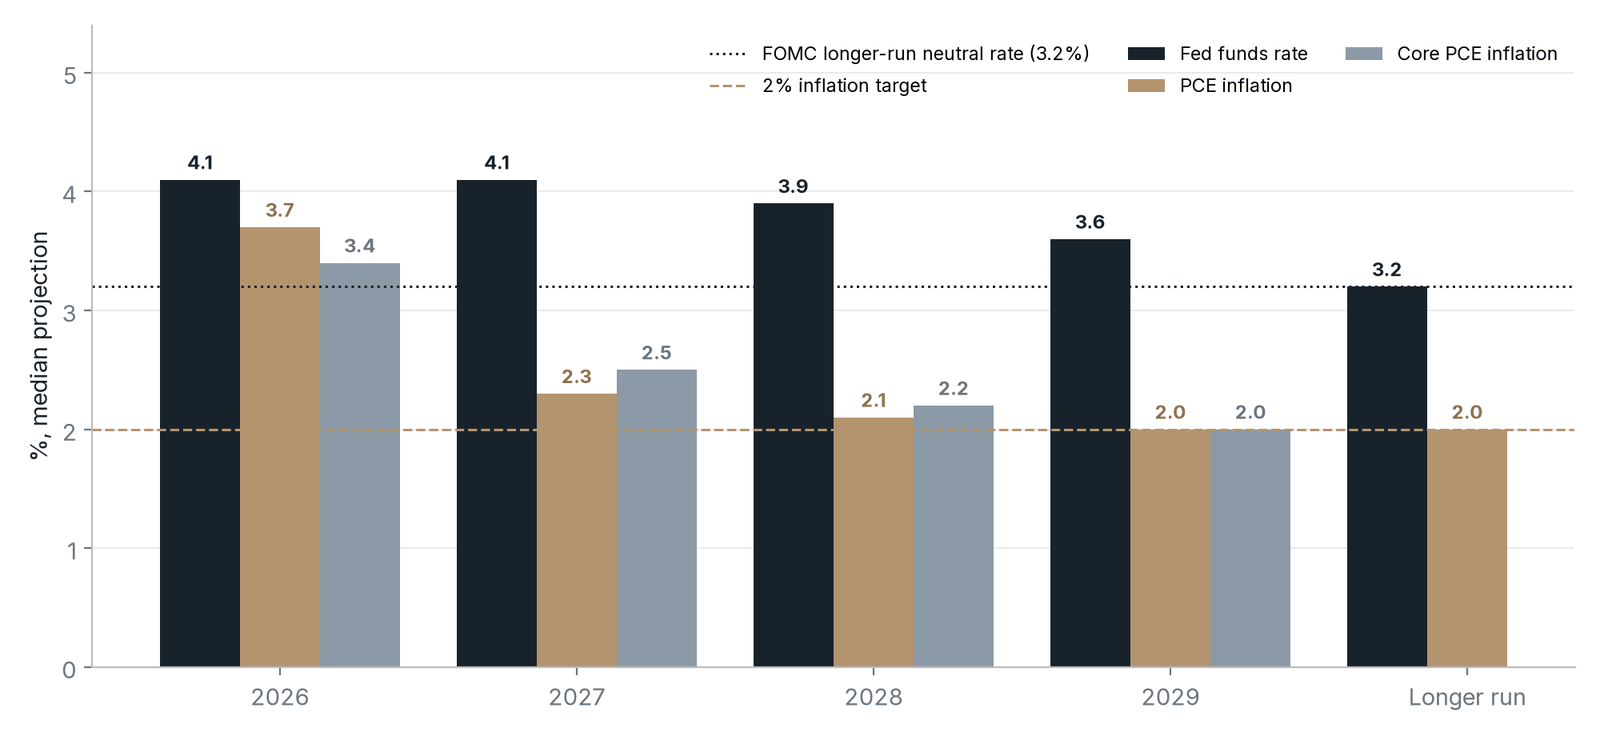
Chart Summary and Key Values
The Fed's Own Forecast: Inflation Near 2% Next Year, Policy Still Above Neutral. Grouped bars of the Federal Reserve's September 2026 median projections for the fed funds rate, PCE inflation and core PCE inflation, with the 3.2% longer-run neutral rate and the 2% target marked.
Chart Summary and Key Values
Grouped bars of the Federal Reserve's September 2026 median projections for the fed funds rate, PCE inflation and core PCE inflation, with the 3.2% longer-run neutral rate and the 2% target marked.
- Fed funds rate: 4.1% (2026), 4.1% (2027), 3.9% (2028), 3.6% (2029), 3.2% longer run
- PCE inflation: 3.7% (2026), 2.3% (2027), 2.1% (2028), 2.0% (2029), 2.0% longer run
- Core PCE inflation: 3.4% (2026), 2.5% (2027), 2.2% (2028), 2.0% (2029)
- Unemployment projected at 4.1% in each year 2026–2029
September 2026 Summary of Economic Projections, medians; inflation is Q4-over-Q4; unemployment projected at 4.1% in each year 2026–2029
Source: Federal Reserve Board, Summary of Economic Projections, Sept. 16, 2026.
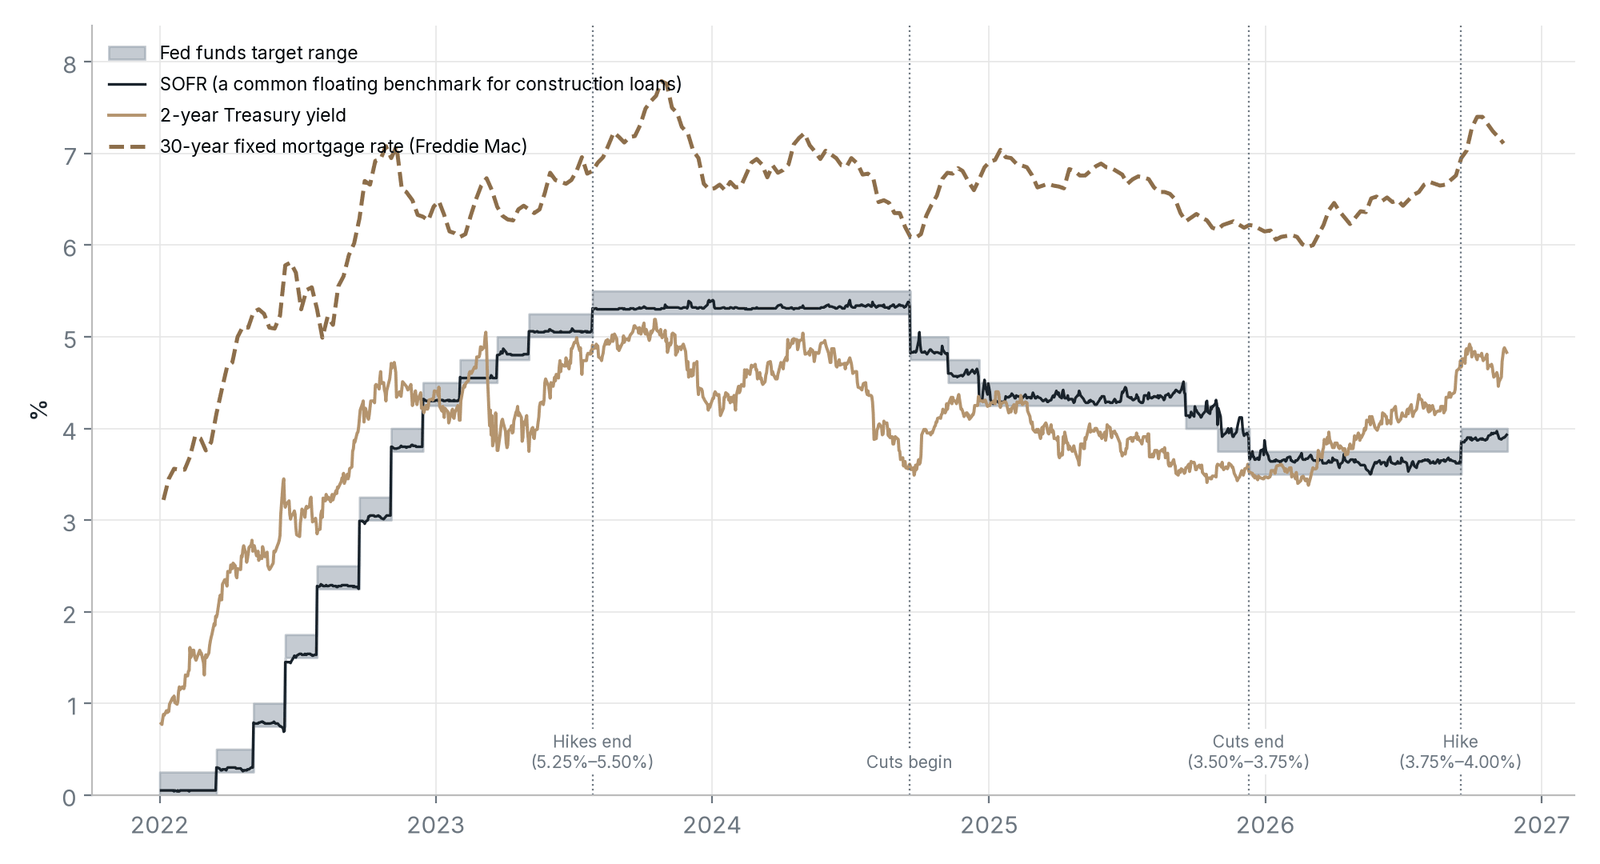
Chart Summary and Key Values
Policy Whiplash: Hikes, 175 bp of Cuts, Then Hikes Again. Line chart of the fed funds target range against SOFR, the 2-year Treasury yield and the 30-year fixed mortgage rate, January 2022 to November 2026.
Chart Summary and Key Values
Line chart of the fed funds target range against SOFR, the 2-year Treasury yield and the 30-year fixed mortgage rate, January 2022 to November 2026.
- Hikes took the target range to 5.25%–5.50% by July 2023
- Cuts began in September 2024 and ended at 3.50%–3.75% after 175 bp
- A September 2026 hike lifted the range to 3.75%–4.00%
- The 30-year fixed mortgage rate peaked at 7.79% in October 2023 and was 7.11% on Nov. 12, 2026
Fed funds target range vs. key borrowing benchmarks, Jan 2022–Nov 2026
Source: Federal Reserve Board (DFEDTARU, DFEDTARL, DGS2), Federal Reserve Bank of New York (SOFR), Freddie Mac PMMS (MORTGAGE30US), via FRED.
3. Why the Fed Targets 2%
The Fed's commitment to 2% rests on serious arguments, and any critique should begin by stating them fairly.
Credibility and anchored expectations. If households and firms believe inflation will average 2%, wage and price setting stays calm and temporary shocks fade. Changing the target while missing it risks looking like moving the goalposts.20 Fed Chairman Kevin Warsh, sworn in in May 2026, has made this commitment central, describing 2% PCE inflation at Jackson Hole as "a firm, fixed target."21

A buffer above zero. A positive target leaves room to cut rates in a recession before hitting the zero lower bound.22
Measurement bias. Measured inflation has historically overstated true changes in the cost of living, so a measured 2% has meant something closer to 1%–1.5% in underlying terms.23
International consistency and public preference. The ECB, the Bank of England, the Bank of Canada and the Bank of Japan all center on 2%. Survey research also finds that people strongly dislike inflation, even when their wages keep pace, because they attribute pay gains to their own effort and price gains to forces beyond their control.24
The framework itself. The Fed adopted 2% formally in January 2012.25 In 2020 it moved to flexible average inflation targeting, aiming for inflation "moderately above 2 percent for some time" after periods below it.26 In August 2025 it dropped that makeup language and returned to flexible inflation targeting, keeping 2%.27
These are reasonable arguments for 2% as an anchor. None of them is an argument that 2.5% inflation damages the economy, or that the last half point is worth a recession. That distinction is the heart of this paper.
4. Why the 2% Fixation Is Myopic
A convention, not a scientific optimum
The first explicit inflation target came from New Zealand, which set a 0%–2% band in its 1990 Policy Targets Agreement.28 The number's origin was informal. In 1988, New Zealand's finance minister said in a television interview that he wanted inflation of roughly 0%–1%, and the Reserve Bank later added room for measurement bias to arrive at a 0%–2% band.29 Other central banks followed, and 2% became the global convention. A convention can be useful. It is not a law of economics, and it is not worth a recession.
Rarely achieved, and missed in both directions
Since 1960, year-over-year PCE inflation has been at or below 2% in ~34% of months, with a median of ~2.6%.30 From 1970 through 2011, the four decades before the Fed formally adopted the target, the share was only ~19%. Over the full period since 1960, inflation landed within a quarter point of 2%, between 1.75% and 2.25%, in only ~12% of months. Since March 2021, it has not been at or below 2% in any of 67 months. Going back before 1960 does not flatter the target either. From 1914 to 1959, consumer prices fell in ~29% of months and rose faster than 5% in ~23%, and inflation sat in a 0%–2% range in only ~25%.31 The pre-1960 record is one of swings between inflation and deflation, not of steady 2%. Yet the Fed has also missed on the low side: from 2012 to 2020, PCE inflation was at or below 2% in ~89% of months, averaging ~1.4%. A target missed by up to a point for nine years without alarm is hard to treat as a line worth recession risk when the miss runs the other way.
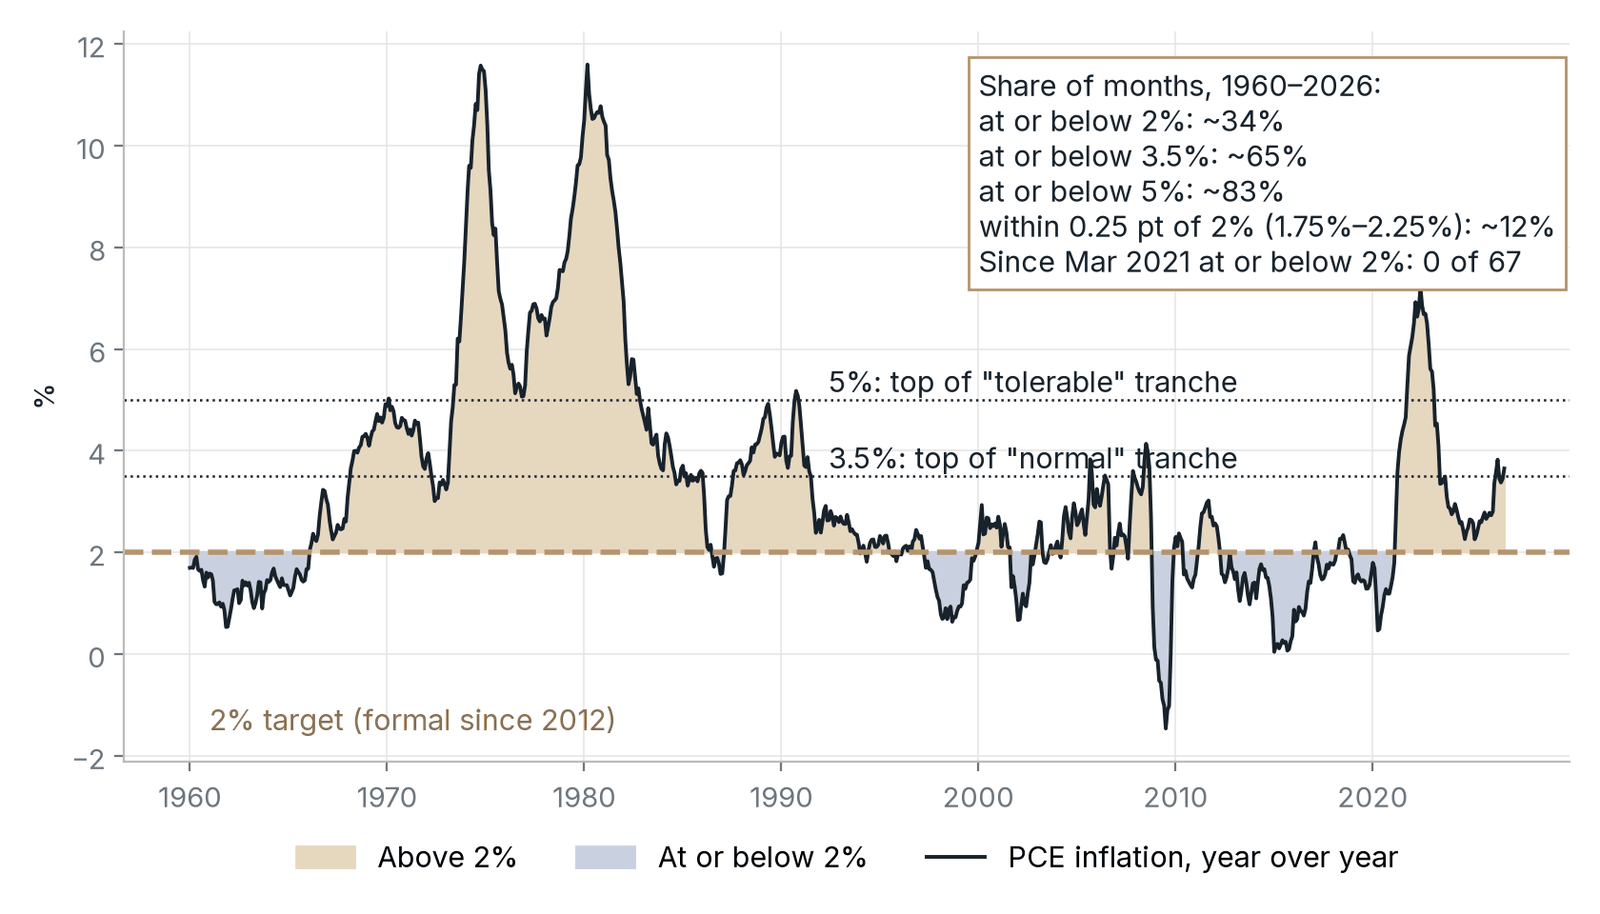
Chart Summary and Key Values
PCE Inflation vs. the 2% Target and Inflation Tranches, 1960–2026. Area chart of year-over-year PCE inflation since 1960, shaded above and below the 2% target, with lines at 3.5% (top of the "normal" tranche) and 5% (top of the "tolerable" tranche).
Chart Summary and Key Values
Area chart of year-over-year PCE inflation since 1960, shaded above and below the 2% target, with lines at 3.5% (top of the "normal" tranche) and 5% (top of the "tolerable" tranche).
- Share of months, 1960–2026: at or below 2%, ~34%; at or below 3.5%, ~65%; at or below 5%, ~83%
- Within 0.25 point of 2% (1.75%–2.25%): ~12% of months
- Since March 2021, 0 of 67 months at or below 2%
- Latest reading: 3.6% in September 2026
Year-over-year change in the PCE price index, monthly; latest Sep 2026 = 3.6%
Source: U.S. Bureau of Economic Analysis (BEA), PCE price index (PCEPI), via FRED, Federal Reserve Bank of St. Louis. Shares computed from the monthly series.
Precise about the wrong thing
The Boskin Commission estimated upward bias in the CPI at ~1.1 points a year in 1996, and Lebow and Rudd later put it near ~0.9 point.32 Statistical improvements since then have reduced the bias, and bias in the PCE index is smaller. But even a residual bias of a few tenths means that the difference between measured 2.0% and 2.5% is partly a statistical artifact. Precision about the last half point is precision about the wrong thing.
Blind to the source of inflation
A 2% fixation responds the same way to an oil shock as to an overheating labor market. It looks at one number instead of the whole economy, and it discounts long lags: hikes made today land in 2027 and 2028, by which time the Fed's own median expects headline PCE inflation of 2.3% and 2.1%.33 Rising real incomes and full employment are what households experience. A benchmark that is a means to those ends should not override them.
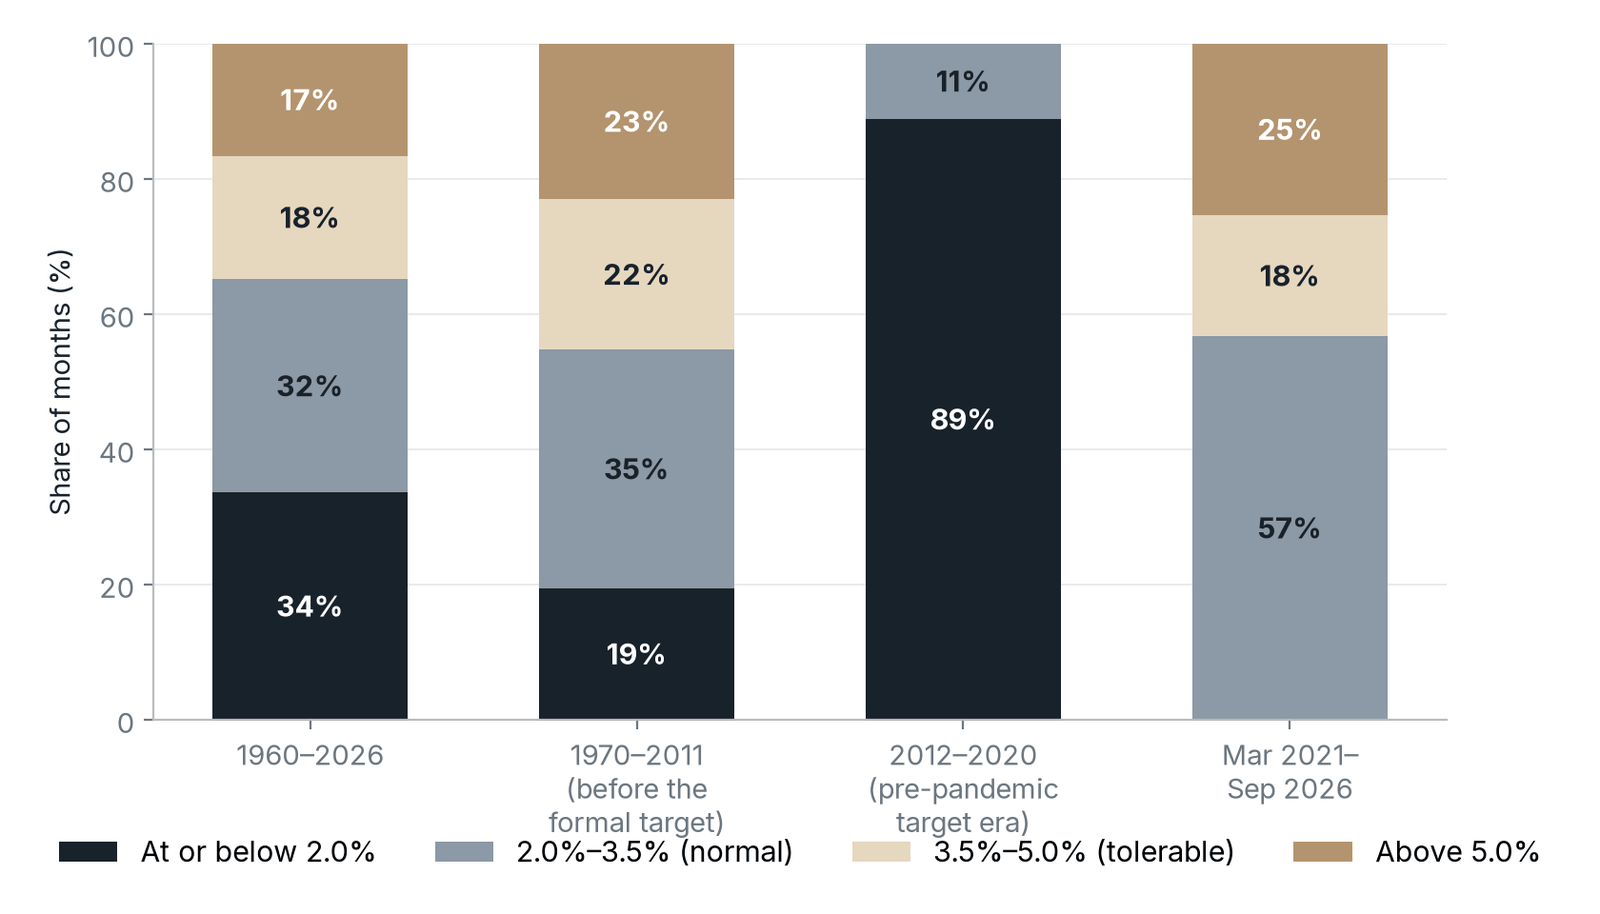
Chart Summary and Key Values
How Often Has Inflation Actually Been at 2%?. Stacked bars showing the share of months in each inflation tranche, by period.
Chart Summary and Key Values
Stacked bars showing the share of months in each inflation tranche, by period.
- 1960–2026: 34% at or below 2%, 32% at 2%–3.5%, 18% at 3.5%–5%, 17% above 5%
- 1970–2011 (before the formal target): 19%, 35%, 22%, 23%
- 2012–2020 (pre-pandemic target era): 89% at or below 2%, 11% at 2%–3.5%
- March 2021–September 2026: 0% at or below 2%, 57% at 2%–3.5%, 18% at 3.5%–5%, 25% above 5%
Distribution of monthly year-over-year PCE inflation readings by period and inflation tranche
Source: BEA PCE price index (PCEPI) via FRED, Federal Reserve Bank of St. Louis; shares computed from the monthly series. Shares may not sum to 100% due to rounding.
A meta-analysis of 67 studies puts the average lag from a policy change to its peak effect on prices at ~29 months.34 For housing, the chain is longer still: starts respond within months, larger apartment buildings take nearly two years to complete, and rent inflation for new tenants leads official CPI rent inflation by ~4 quarters, so a rate move made today reaches measured shelter inflation roughly three years later.35
5. Why 2.5% Is Almost as Good as 2%
One image captures the problem: the Fed is killing a mosquito with a sledgehammer. The mosquito is the gap between ~2.5% and 2%. The sledgehammer is restrictive policy aimed at the sectors that build supply and broaden income growth. Swing a sledgehammer at a mosquito on the kitchen table, and you usually miss the mosquito and break the table. Rate hikes do not reach energy prices or the AI buildout. They break housing, real estate and small business, the parts of the economy a balanced recovery would stand on.
The arithmetic is small. Half a point a year compounds to a price level only ~5% higher after a full decade, 128.0 versus 121.9 on a base of 100 (Exhibit 6). That is roughly $5 on every $100 of spending, spread across ten years.
The economy was already there. Before the war, core CPI was 2.5% and headline CPI had averaged ~2.5% over the prior three months.36 The Fed's own September projections have core PCE back at 2.5% in 2027.37 Treating that level as an emergency is the definition of a sledgehammer aimed at a mosquito.
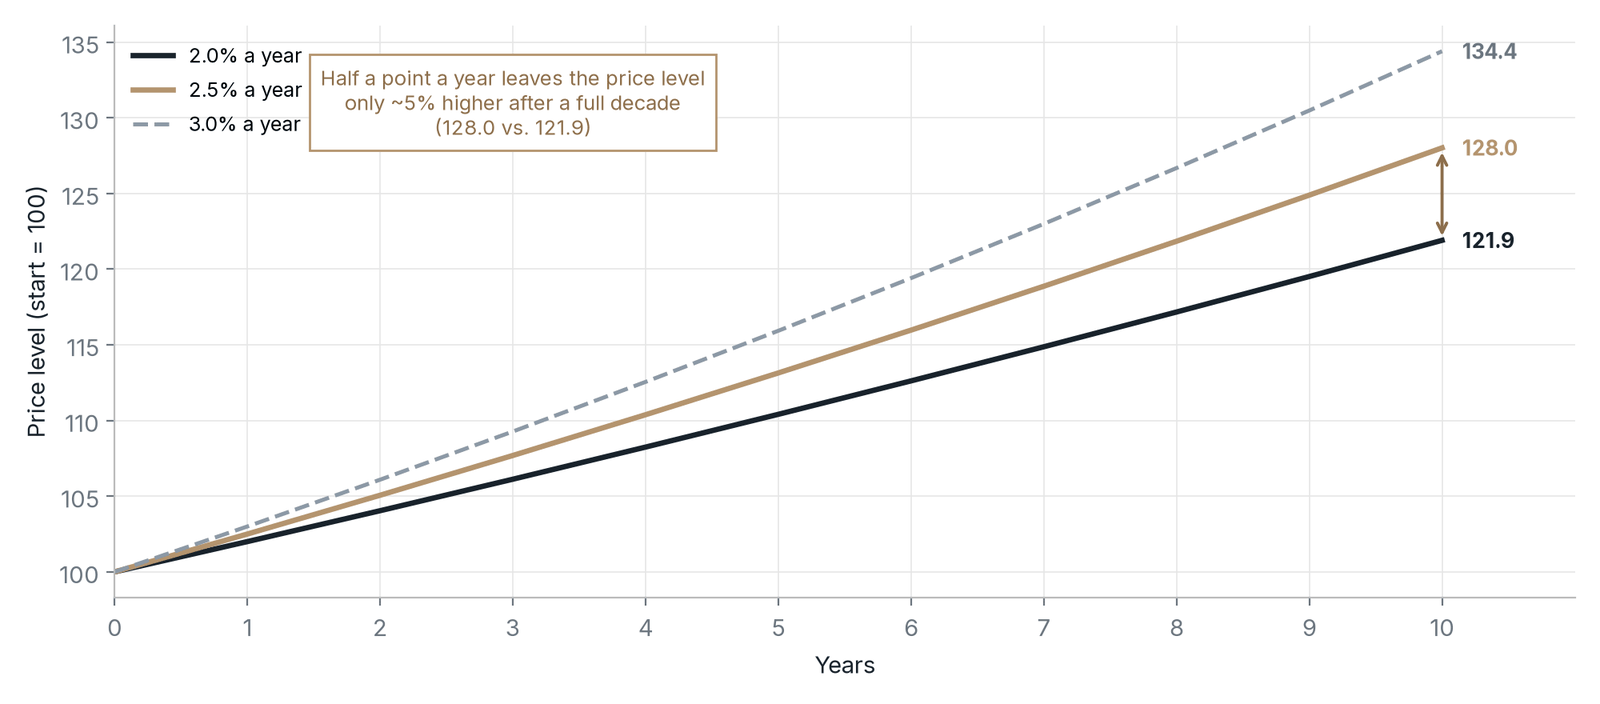
Chart Summary and Key Values
The Mosquito: What Half a Point of Inflation Adds Over a Decade. Lines showing a price level starting at 100 compounded for ten years at 2.0%, 2.5% and 3.0% a year.
Chart Summary and Key Values
Lines showing a price level starting at 100 compounded for ten years at 2.0%, 2.5% and 3.0% a year.
- After 10 years: 121.9 at 2.0%, 128.0 at 2.5%, 134.4 at 3.0%
- Half a point a year leaves the price level only ~5% higher after a full decade (128.0 vs. 121.9)
Price level compounded at a constant annual inflation rate, starting at 100
Source: Compound-growth arithmetic: 100 × (1 + inflation rate)^years. Illustrative only.
Respected central banks center on or near 2.5%. Australia's 2%–3% target has a 2.5% midpoint.38 Iceland has targeted 2.5% since 2001.39 Norway targeted 2.5% from 2001 until 2018, when it moved to 2%.40 Canada and New Zealand run 1%–3% control ranges around 2%, and Canada renewed its framework in November 2026.41 None of these economies is regarded as an inflation outlier.
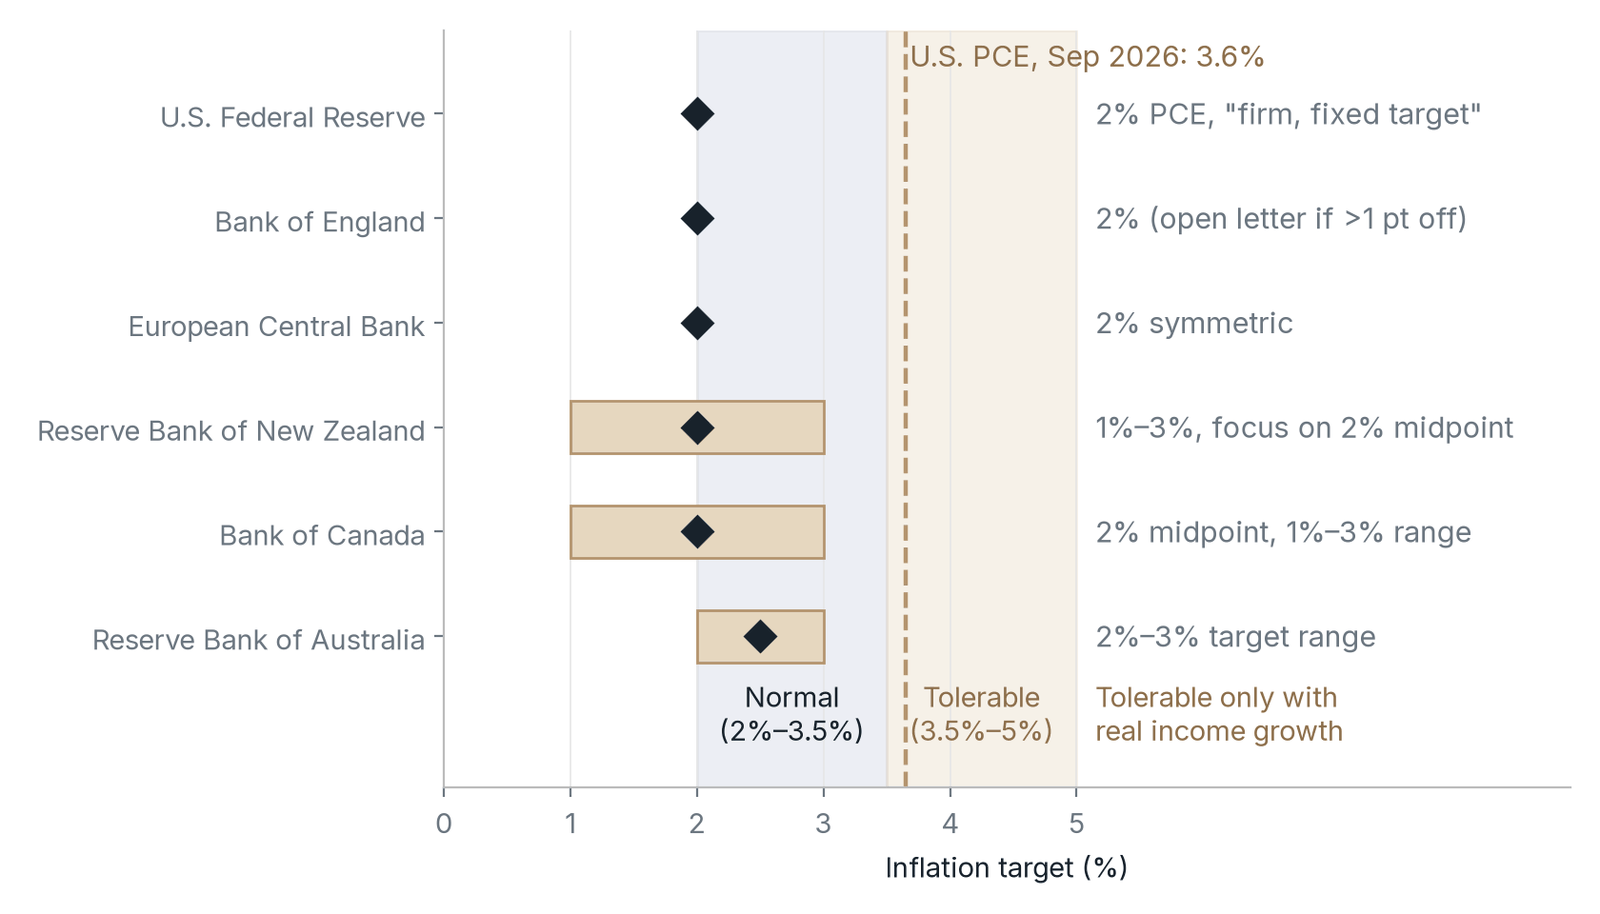
Chart Summary and Key Values
Peer Target Bands vs. Proposed Inflation Tranches. Dot-and-bar chart of official inflation targets and ranges at six central banks, set against the paper's proposed tranches and U.S. PCE inflation.
Chart Summary and Key Values
Dot-and-bar chart of official inflation targets and ranges at six central banks, set against the paper's proposed tranches and U.S. PCE inflation.
- Federal Reserve: 2% PCE, "firm, fixed target"
- Bank of England: 2% (open letter if more than 1 point off); ECB: 2% symmetric
- Reserve Bank of New Zealand: 1%–3%, focus on 2% midpoint; Bank of Canada: 2% midpoint, 1%–3% range
- Reserve Bank of Australia: 2%–3% target range (2.5% midpoint)
- Proposed tranches: normal 2%–3.5%; tolerable 3.5%–5% only with real income growth
- U.S. PCE inflation, September 2026: 3.6%
Diamond = official point target or midpoint; gold bar = official range; background = tranches proposed in this paper
Source: Reserve Bank of Australia; Bank of Canada (2026 framework renewal); Reserve Bank of New Zealand Remit; European Central Bank (2021 strategy); Bank of England remit; Federal Reserve Statement on Longer-Run Goals (Aug 2025); BEA PCE.
Serious economists have argued for higher targets. Blanchard, Dell'Ariccia and Mauro raised the case for a higher target after the 2008 crisis, and Laurence Ball has argued for 4%.42 Research cited by Cecchetti and Schoenholtz, who favor keeping 2%, found that with a 2% target and low neutral rates, policy rates would sit at zero ~30% of the time, versus ~20% under a 3% target.43 The point here is narrower than theirs: a modest overshoot of 2% is not a crisis.
The cost of removing the last half point is large. Laurence Ball's study of disinflations found sacrifice ratios that typically range from ~1 to ~3, meaning each point of lasting disinflation costs ~1%–3% of a year's output.44 Applied to today's economy, removing the last half point would cost on the order of $165–$495 billion of lost output and ~0.4–1.3 million job-years (Exhibit 8). Removing the full gap from 3.1% core PCE to 2.0% would cost roughly twice as much. These figures are illustrative, not forecasts. Post-pandemic disinflation proved cheaper than history suggested, but largely because supply healed, not because demand was crushed.45
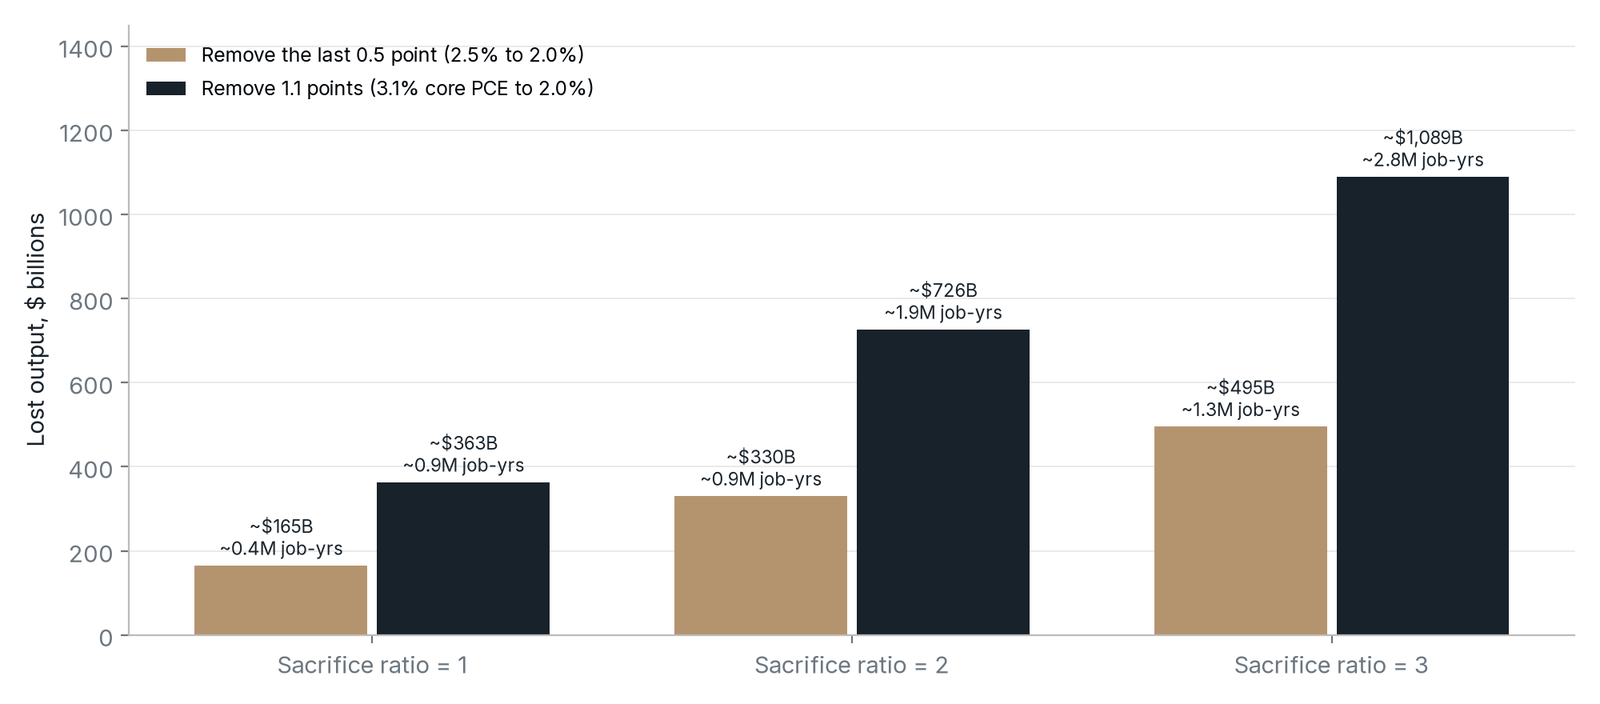
Chart Summary and Key Values
The Price of the Last Mile: Illustrative Output and Job Costs of Disinflation. Bars of illustrative cumulative lost output and job-years from removing the last half point of inflation (2.5% to 2.0%) or 1.1 points (3.1% core PCE to 2.0%), at sacrifice ratios of 1, 2 and 3.
Chart Summary and Key Values
Bars of illustrative cumulative lost output and job-years from removing the last half point of inflation (2.5% to 2.0%) or 1.1 points (3.1% core PCE to 2.0%), at sacrifice ratios of 1, 2 and 3.
- Sacrifice ratio 1: ~$165 billion (~0.4 million job-years) for 0.5 point; ~$363 billion (~0.9 million) for 1.1 points
- Sacrifice ratio 2: ~$330 billion (~0.9 million job-years); ~$726 billion (~1.9 million)
- Sacrifice ratio 3: ~$495 billion (~1.3 million job-years); ~$1,089 billion (~2.8 million)
Cumulative lost output = sacrifice ratio × points of disinflation × nominal GDP (~$33.0 trillion, Q3 2026 annual rate); job-years assume ~0.5 point of unemployment per 1% of output
Source: Ball (1994) sacrifice-ratio range; BEA nominal GDP (GDP) and BLS civilian labor force (~170.7 million) via FRED; jobs conversion uses Okun's law (~0.5 point of unemployment per 1% of output). Illustrative, not a forecast.
The benefit side is small. Nakamura, Steinsson, Sun and Villar built new data for the late-1970s Great Inflation and found no evidence that price dispersion, the main welfare cost of inflation in standard models, rose with inflation.46 If even double-digit inflation did not produce the predicted distortion, the cost of 2.5% versus 2% is small. Akerlof, Dickens and Perry documented downward nominal wage rigidity, the reluctance of employers to cut pay, and argued that a little inflation helps real wages adjust without layoffs.47
2% can remain the anchor. Treating 2.5% as an emergency, worth pink slips and a lost year of housing starts, is a sledgehammer aimed at a mosquito.
6. Inflation in Tranches: How Much Is Too Much?
A single point target invites a binary view: inflation is either on target or a problem. A better approach reads inflation in tranches, judged against whether jobs are robust and real incomes are rising. The framework below keeps 2% as the long-run anchor. It is a tolerance framework, not a new target.
The research supports a tolerance band of this kind with important caveats. Sarel, in an IMF study, found a structural break at ~8% inflation, below which inflation had no significant negative effect on growth.48 Bruno and Easterly found no robust growth-inflation relationship outside high-inflation crises.49 Other work puts the threshold for advanced economies much lower, at ~1%–3%.50 The grouping in Exhibit 10 is correlation, not causation: strong demand can lift both growth and inflation. That is exactly why tranche 3 is conditional on income growth.
| Tranche | PCE inflation | Share of months since 1960 | What history and research show | Proposed stance |
|---|---|---|---|---|
| 1 | At or below 2% | ~34% | The Fed's target; strongest real-wage gains | A long-run aspiration, not a trigger to tighten |
| 2 | 2%–3.5% | ~32% | Normal. Near peer bands; real GDP growth averaged ~3.0% | No hikes; cut toward or below neutral when rate-sensitive sectors are contracting |
| 3 | 3.5%–5% | ~18% | Tolerable with income growth; GDP growth averaged ~3.8%, but production-worker real wages grew only ~0.3% a year | Tolerate during supply shocks if jobs are robust and real incomes are rising or recovering as the shock fades |
| Danger | Above 5% | ~17% | Real hourly earnings fell ~1.3% a year on average; 4 of 7 years of falling real GDP | Tighten |
Table Summary and Key Values
Column headings: Tranche, PCE inflation, Share of months since 1960, What history and research show, Proposed stance.
Table Summary and Key Values
The four inflation tranches proposed in the paper, with the share of months since 1960 in each, what history and research show, and the proposed policy stance: a long-run 2% anchor, no hikes at 2%–3.5%, tolerance at 3.5%–5% during supply shocks only with robust jobs and real incomes rising or recovering, and tightening above 5%.
Source: BEA and BLS data via FRED; tranche shares are of monthly year-over-year PCE readings, Jan. 1960–Sept. 2026; outcome averages are annual, 1960–2025. Research: Sarel (1996); Khan and Senhadji (2001).
Income growth is judged on direction as well as level. When a supply shock pushes prices up faster than wages, real pay dips. What matters is whether it recovers as the shock fades, which happens once inflation falls below wage growth. In the third quarter, PCE inflation ran at a 2.1% annual rate.51 Average hourly earnings rose 3.1% over the year to October.52
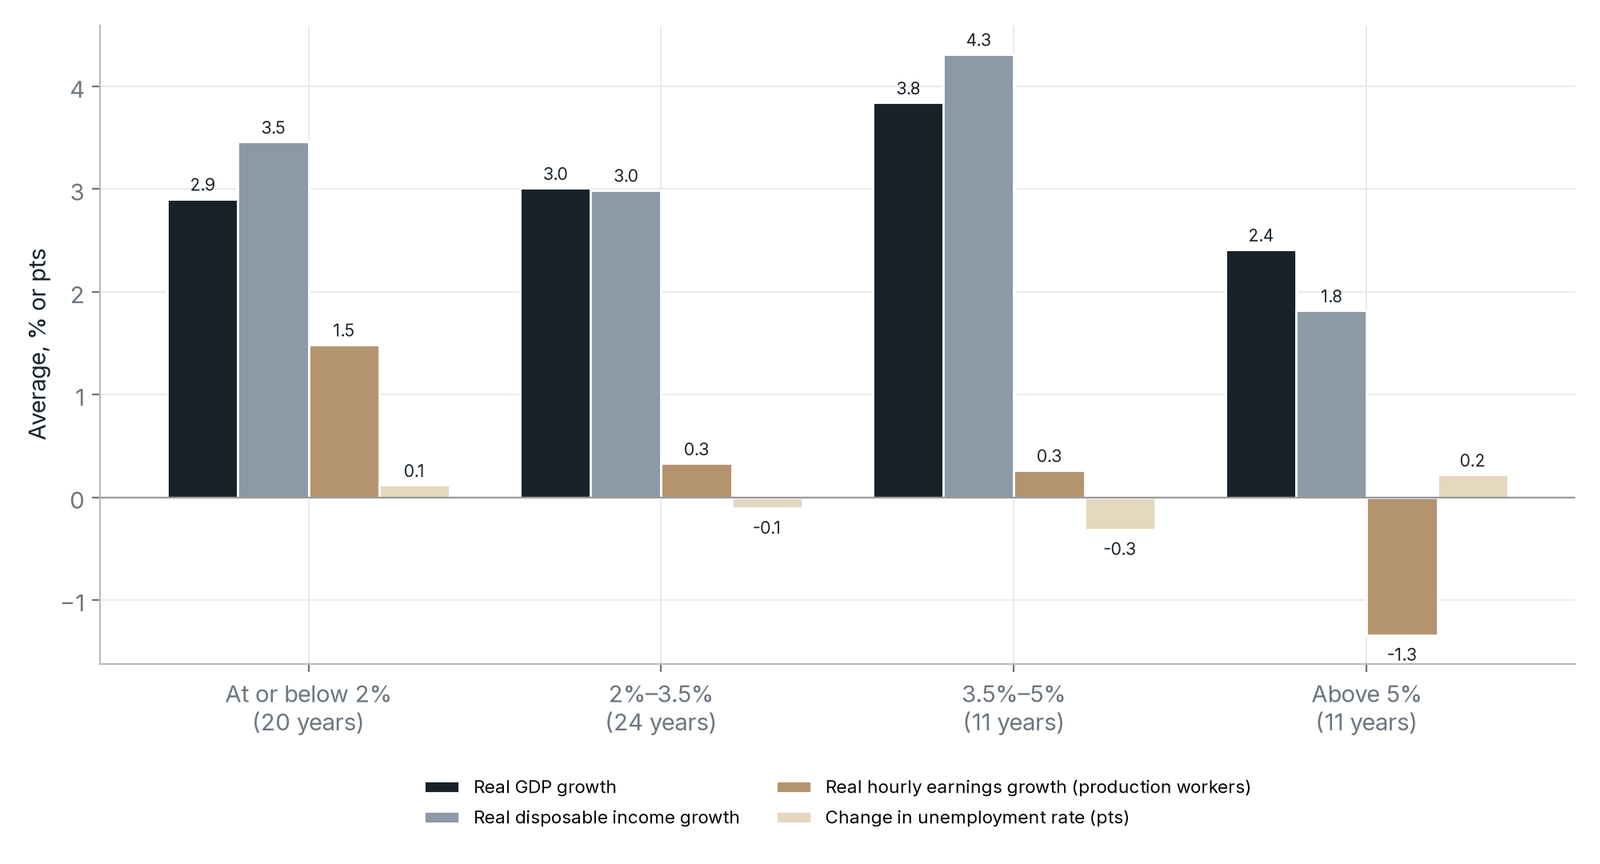
Chart Summary and Key Values
How the Economy Fared in Each Inflation Tranche, 1960–2025. Grouped bars of average annual outcomes by inflation tranche, 1960–2025: real GDP growth, real disposable income growth, real hourly earnings growth and change in the unemployment rate.
Chart Summary and Key Values
Grouped bars of average annual outcomes by inflation tranche, 1960–2025: real GDP growth, real disposable income growth, real hourly earnings growth and change in the unemployment rate.
- At or below 2% (20 years): GDP 2.9%, disposable income 3.5%, real hourly earnings 1.5%, unemployment +0.1 pt
- 2%–3.5% (24 years): 3.0%, 3.0%, 0.3%, −0.1 pt
- 3.5%–5% (11 years): 3.8%, 4.3%, 0.3%, −0.3 pt
- Above 5% (11 years): 2.4%, 1.8%, −1.3%, +0.2 pt
Annual averages grouped by that year's PCE inflation; correlation, not causation (strong demand can lift both growth and inflation)
Source: BEA (PCEPI, GDPC1, DSPIC96), BLS (UNRATE, AHETPI, CPIAUCSL), via FRED; annual averages grouped by each year's PCE inflation. Real hourly earnings from 1965.
The tranches also double as guidance. Announcing the range in advance, with a hold inside 2%–5% while incomes grow and tightening above 5% or if expectations loosen, tells businesses how the Fed will react before it reacts. Orphanides and Wilcox described this logic as the "opportunistic approach to disinflation": hold inflation in a range and let favorable shocks bring it down, rather than inducing a recession to get there.53
7. The Goal Is Income Growth, Not Demand Destruction
Inflation is most harmful when paychecks fail to keep up. By that test, the problem in 2026 is the income side. Average hourly earnings rose 3.1% over the year to October, below headline PCE inflation of 3.6% in September, so real pay is slipping.54 Rate hikes cannot fix that gap. They slow labor demand and wage growth, and they do nothing for oil supply. Real pay recovers when wage growth outpaces inflation. With hourly earnings up 3.1% and PCE inflation already running at a 2.1% annual rate in the third quarter, that recovery is under way as the energy shock fades.55 Hikes that slow wage growth only push it further out.
Wages are also not the source of the overshoot. Unit labor costs rose ~2.4% over the year to the third quarter of 2026, a pace consistent with ~2% inflation, and productivity has grown faster since 2019 than in the decade before.56 The FOMC's own October statement noted that "productivity growth is strong."57 Higher productivity is what allows wages to outpace prices sustainably, and lower financing costs support the investments behind it: construction, equipment and small-business expansion.
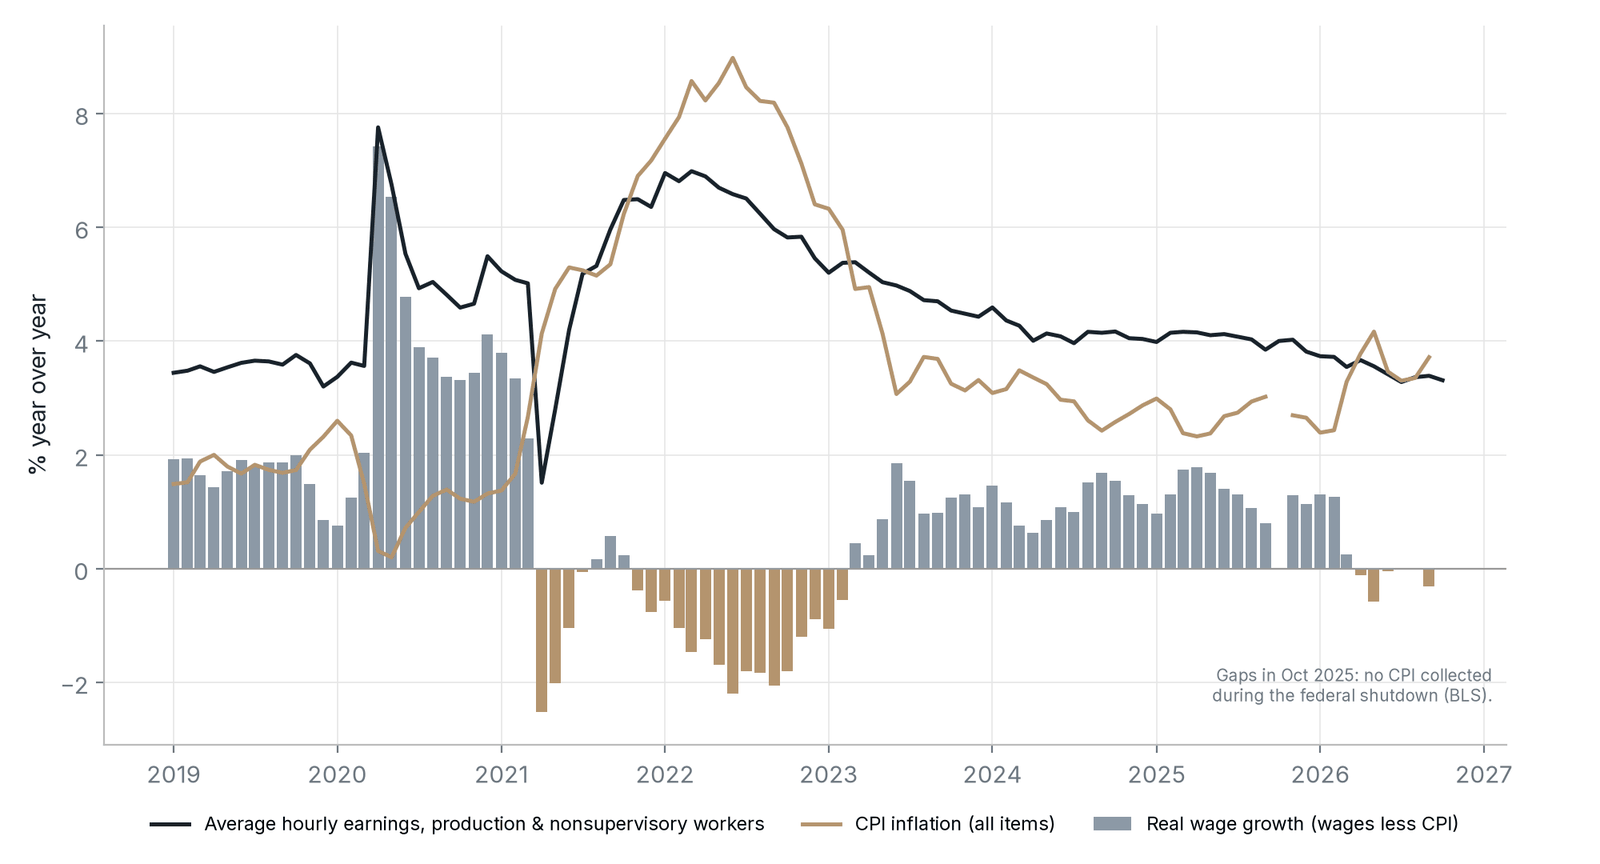
Chart Summary and Key Values
Wages vs. Prices: Real Pay Has Slipped Again in 2026. Lines of year-over-year growth in average hourly earnings for production and nonsupervisory workers and CPI inflation, with bars for real wage growth, January 2019 to October 2026.
Chart Summary and Key Values
Lines of year-over-year growth in average hourly earnings for production and nonsupervisory workers and CPI inflation, with bars for real wage growth, January 2019 to October 2026.
- Average hourly earnings of production and nonsupervisory workers: +3.3% year over year in October 2026
- CPI inflation: 3.7% year over year in September 2026, so real wage growth turned negative again
- No CPI was collected in October 2025 during the federal shutdown, leaving a gap in the series
Year-over-year growth, monthly, Jan 2019–Oct 2026 (CPI through Sep 2026 for the year-over-year rate)
Source: U.S. Bureau of Labor Statistics (BLS), Current Employment Statistics (AHETPI) and CPI-U (CPIAUCSL), via FRED; real wages = nominal earnings growth less CPI inflation.
There is precedent for betting on productivity. In 1996, with a "substantial minority" of the FOMC favoring tighter policy, Chairman Alan Greenspan persuaded the Committee to hold the funds rate at 5.25%, judging that information technology was lifting productivity. Revised data proved him right: productivity growth rose from 1.6% in the third quarter of 1995 to 2.5% a year later, and core inflation drifted lower through 1996 and 1997.58 Unemployment fell from an average of 5.4% in 1996 to 4.2% in 1999.59
Demand destruction is the costly way to cut inflation. Each 1-point rise in the unemployment rate means ~1.7 million more people out of work, given a labor force of ~170 million.60 Getting inflation down by crushing demand trades the cost of higher prices for the much larger cost of lost income. The 2022–2025 disinflation shows the alternative: PCE inflation fell from 7.2% in June 2022 to ~2.3% by early 2025 while unemployment rose only modestly, from 3.6% to ~4.2%.61 Bernanke and Blanchard attribute most of the early pandemic inflation to supply and price shocks, while labor-market tightness became the more persistent driver later.62 In 2026, by contrast, the labor market is not tight.
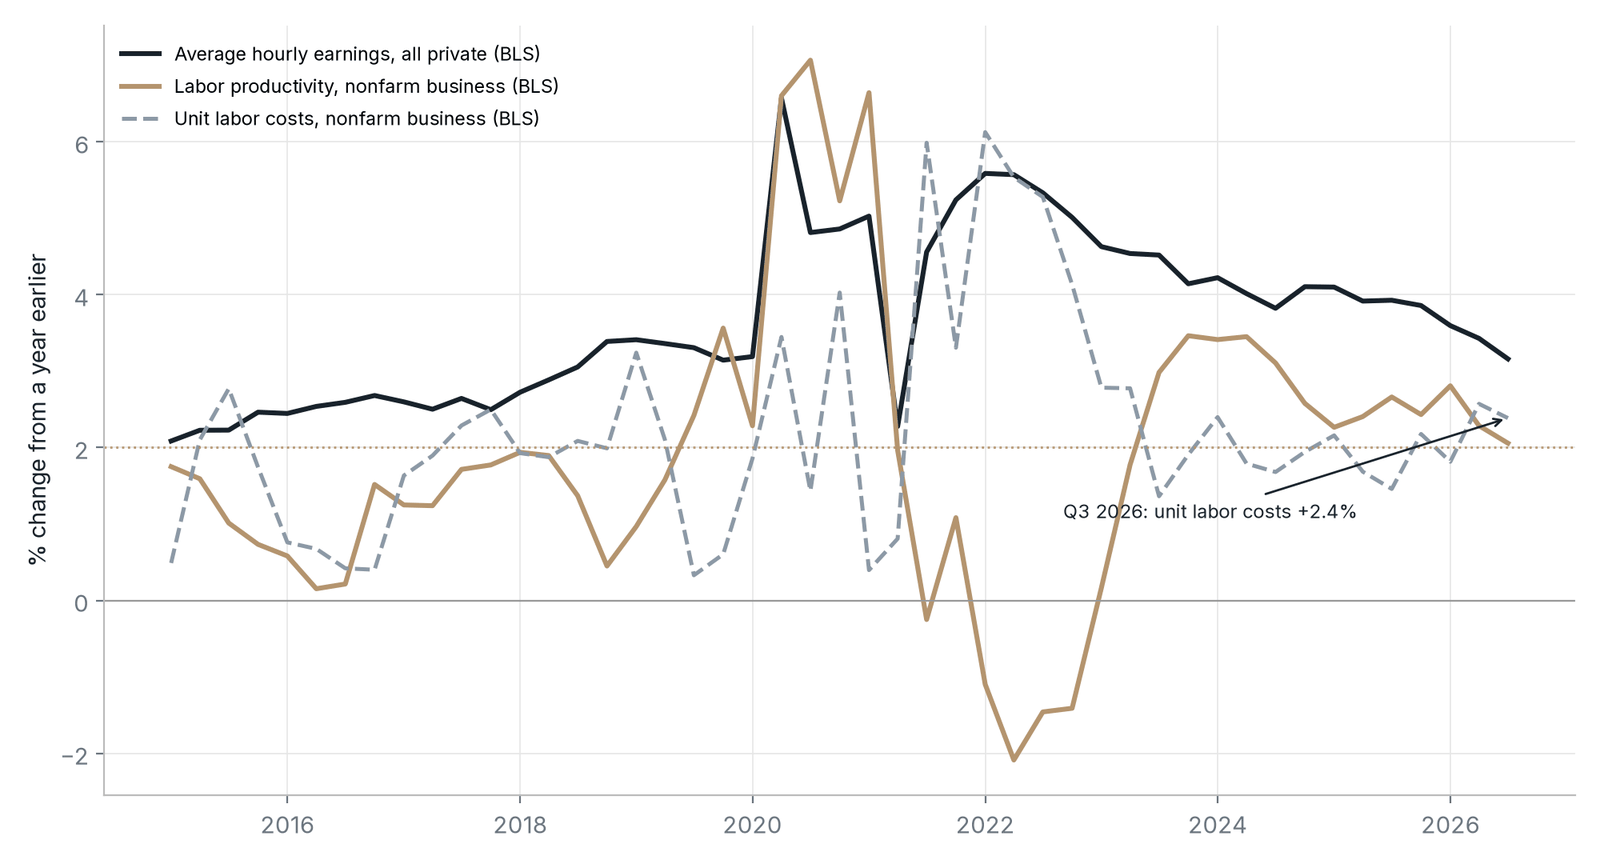
Chart Summary and Key Values
Productivity Is Paying for Wage Gains. Lines of year-over-year growth in average hourly earnings, labor productivity and unit labor costs, 2015 to Q3 2026, with a dotted 2% line.
Chart Summary and Key Values
Lines of year-over-year growth in average hourly earnings, labor productivity and unit labor costs, 2015 to Q3 2026, with a dotted 2% line.
- Q3 2026: unit labor costs +2.4% from a year earlier
- Productivity growth has run near or above 2% since 2023, helping pay for wage gains
- Average hourly earnings growth has eased toward ~3% from its 2022 peak of ~5.5%
Year-over-year growth, quarterly, 2015–Q3 2026; dotted line = 2%
Source: BLS Productivity and Costs (OPHNFB, ULCNFB) and Current Employment Statistics (CES0500000003, quarterly average), via FRED.
8. A Supply Shock, and the Record of Hiking Into One
What a sitting Fed official says
In a Nov. 10, 2026 speech, Vice Chair for Supervision Michelle Bowman said that tariffs, energy and AI-related price pressures "each accounted for roughly one-fourth" of above-target core PCE inflation over the 12 months to September, with the remaining quarter reflecting persistent effects of earlier shocks.63 She said tariff effects "should further wane," energy pressures "should unwind when the Middle East conflict resolves," and the labor market "does not appear to be tight." She also concluded that "the benefit of additional policy tightening has to be carefully weighed against its costs for interest-rate-sensitive sectors." Bowman is not a dove on every point: she estimated October core PCE inflation at 3.3%, flagged signs of broadening and said she is "more attentive to the inflation side." But by her own estimate, roughly three-quarters of the overshoot comes from relative-price shocks, not an overheated labor market.
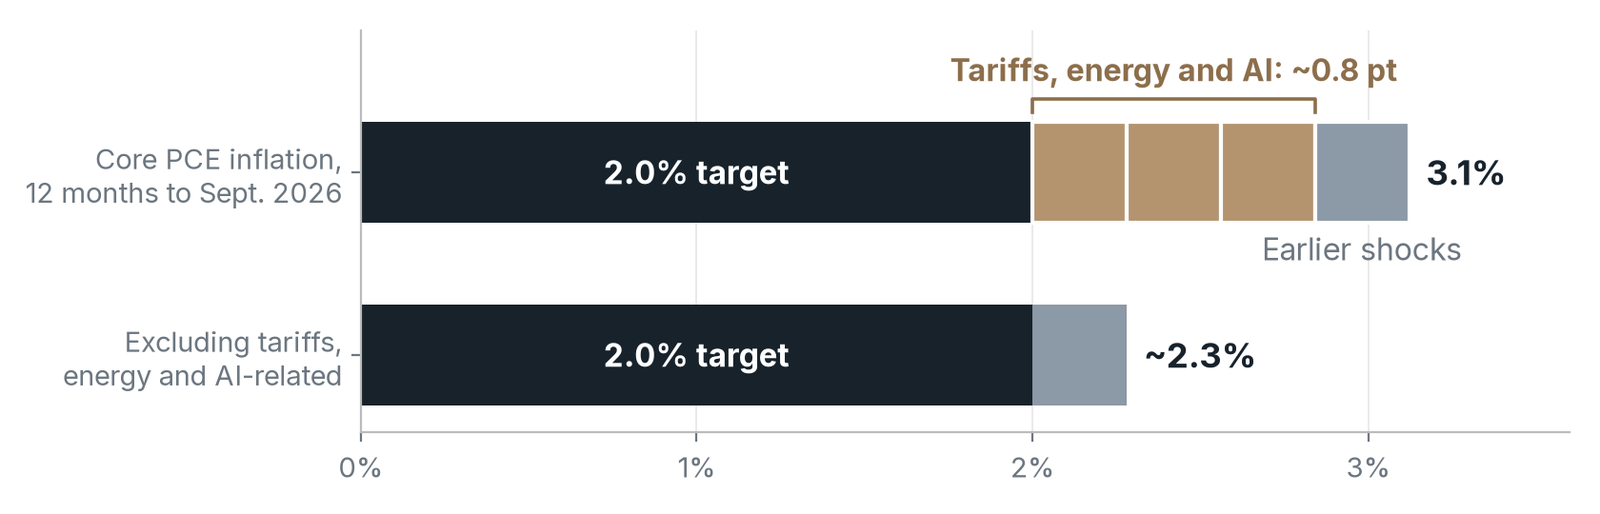
Chart Summary and Key Values
Three-Quarters of the Core Overshoot Comes from Relative-Price Shocks. Horizontal bars splitting core PCE inflation for the 12 months to September 2026 into the 2% target and the pieces of the overshoot that Vice Chair for Supervision Bowman identifies.
Chart Summary and Key Values
Horizontal bars splitting core PCE inflation for the 12 months to September 2026 into the 2% target and the pieces of the overshoot that Vice Chair for Supervision Bowman identifies.
- Core PCE inflation: 3.1%, ~1.1 points above the 2% target
- Tariffs, energy and AI-related pressures: ~0.8 point combined, roughly one-fourth of the overshoot each
- Excluding them: ~2.3%
Core PCE inflation, 12 months to Sept. 2026, split into the 2% target and the four roughly equal pieces of the overshoot that Vice Chair for Supervision Bowman identifies
Source: BEA core PCE price index (PCEPILFE) via FRED; Michelle W. Bowman, speech at the Council on Foreign Relations, Nov. 10, 2026. Pieces are approximate quarters of the ~1.1-point overshoot, as Bowman describes them.
The shock is already fading
Quarterly PCE inflation fell from a 5.0% annual rate in the second quarter to 2.1% in the third, and core from 3.3% to 2.5%.64 Brent crude, which traded above $110 a barrel in late October, fell sharply in early November on hopes of a U.S.-Iran agreement, and Gulf crude flows have recovered to near pre-conflict levels.65 One-year inflation expectations in the Michigan survey fell from 4.7% to 4.3% in November.66 Oil remains volatile, and a renewed escalation would change this picture. But the direction of the impulse matters for policy, because hikes made now take effect in 2027 and 2028.
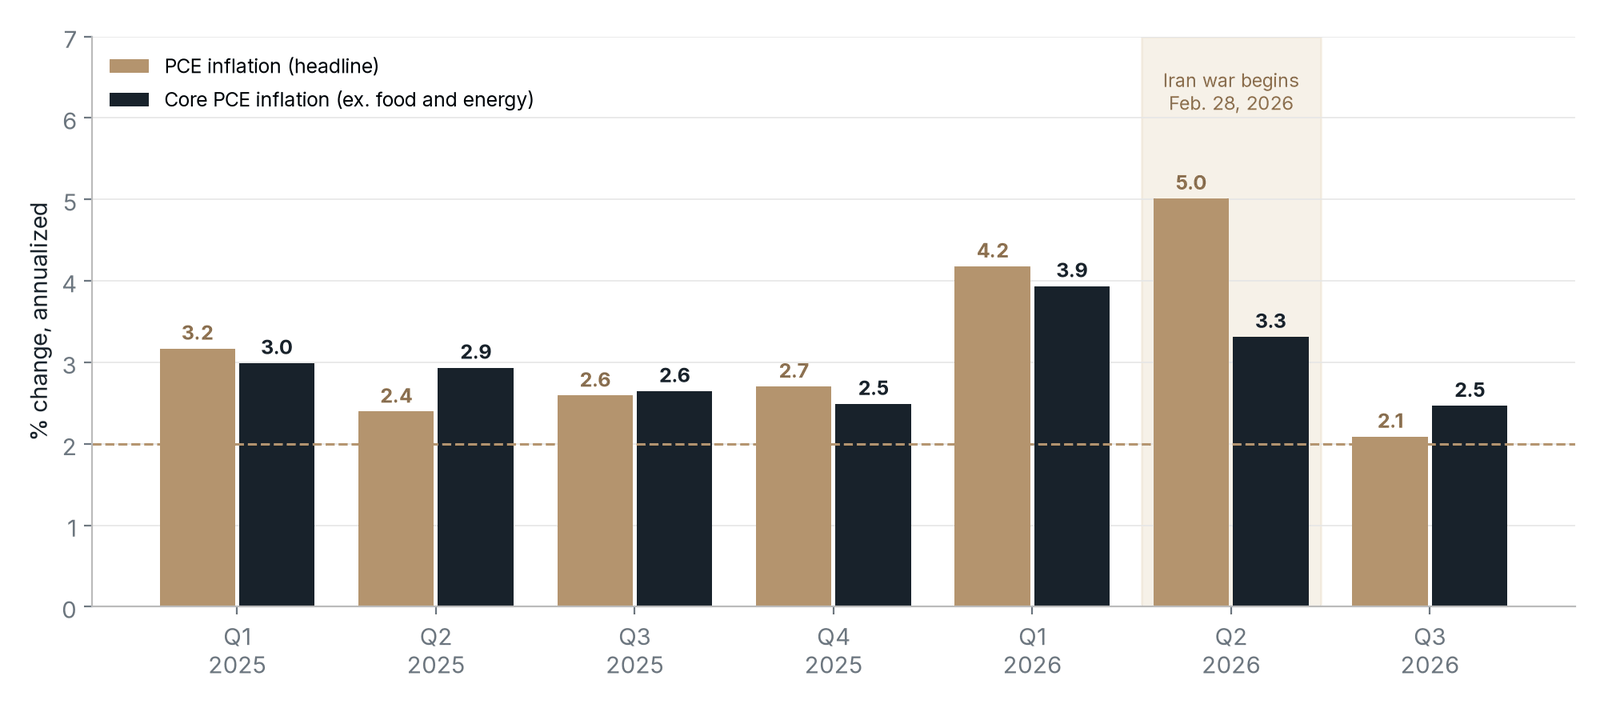
Chart Summary and Key Values
The Energy Impulse Is Already Fading in the Quarterly Data. Bars of quarterly PCE and core PCE inflation at an annual rate, Q1 2025 to Q3 2026, with the Iran war (Feb. 28, 2026) marked.
Chart Summary and Key Values
Bars of quarterly PCE and core PCE inflation at an annual rate, Q1 2025 to Q3 2026, with the Iran war (Feb. 28, 2026) marked.
- Headline PCE: 3.2%, 2.4%, 2.6%, 2.7% (2025 quarters); 4.2% (Q1 2026); 5.0% (Q2 2026); 2.1% (Q3 2026)
- Core PCE: 3.0%, 2.9%, 2.6%, 2.5% (2025 quarters); 3.9% (Q1 2026); 3.3% (Q2 2026); 2.5% (Q3 2026)
PCE price index, quarter-over-quarter percent change at an annual rate, Q1 2025–Q3 2026
Source: U.S. Bureau of Economic Analysis, PCE price index (PCEPI) and core PCE (PCEPILFE), via FRED; quarterly averages, annualized (matches BEA's Q3 2026 advance estimate of 2.1% and 2.5%).
The tariff piece is partly reversing
In February 2026, the Supreme Court held in Learning Resources v. United States that tariffs imposed under the International Emergency Economic Powers Act were unlawful, and refunds of roughly $100 billion had been processed by the end of July.67 Tariffs are a one-time shift in the price level. Hiking to offset one trades lasting losses of output and income for a temporary inflation bump, and one of Bowman's three "quarters" is now fading.
History: much of the damage came from the response
Bernanke, Gertler and Watson studied the oil shocks of the 1970s and 1980s and concluded that a substantial part of the recessionary impact came from the Fed's systematic tightening in response, rather than from higher oil prices themselves.68 The European Central Bank offers modern cautionary tales. In July 2008 it raised rates to 4.25% in response to commodity-driven inflation and reversed within months as the crisis hit. In April and July 2011 it hiked again and reversed both moves by December 2011.69 Both episodes are widely viewed as policy errors. In 2026, the ECB hiked twice into the energy shock, in June and again in September, lifting its deposit rate to 2.50%, even as euro-area core inflation eased to 2.4% in August.70 The Bank of Canada and the Bank of England have since followed, raising rates on Oct. 28 and Nov. 5, although the Bank of England reported "limited evidence so far" of knock-on effects.71 The United States has the opportunity to avoid a mistake its peers may be repeating.
The doctrine: look through, with conditions
The Bank for International Settlements wrote in its 2026 Annual Economic Report that "the rationale to look through temporary supply shocks remains compelling – but only up to a point."72 It warned that central banks must watch for second-round effects and loosening expectations. Dallas Fed researchers, including Lutz Kilian, the economist behind the main critique of Bernanke, Gertler and Watson, estimated that a Hormuz-driven oil supply shortfall would raise 2026 fourth-quarter headline PCE inflation by 0.6 point and core by only 0.2 point if the disruption lasted one quarter, and by 1.1 and 0.3 point if it lasted three, with negligible effects on long-run expectations in either case.73
Senior officials have said the same. Vice Chair Philip Jefferson said in July that "if a shock is expected to reverse before monetary policy can take effect, looking through it may be the appropriate approach."74 On Nov. 13, Treasury Secretary Scott Bessent said the Fed "should understand that this is an energy supply shock."75 Bowman, for her part, noted that "the recent rise in mortgage rates appears to be dragging home construction and sales down further."76
Monetary theory points the same way. Aoki showed that when some prices are flexible and others sticky, optimal policy stabilizes inflation in the sticky-price sector and lets flexible prices, such as energy, adjust.77 Rubbo extends the result to production networks: the inflation measure a central bank should stabilize is not the consumer price index, and targeting consumer prices raises the welfare cost of shocks.78 Guerrieri, Lorenzoni, Straub and Werning showed that when demand shifts across sectors, the shift acts like a cost-push shock, and the optimum can have inflation running above target for a time.79 An economy shifting toward AI investment while energy prices spike is the kind of case these models describe.
9. Rates Are Hitting the Wrong Part of the Economy
The third quarter captured the two-speed economy in a single report. Real GDP grew at a 3.4% annual rate, led by a 20.9% surge in equipment investment, while residential investment fell 3.3%.80 Since the first quarter of 2022, real investment in information-processing equipment is up ~66% and software ~52%, while real residential investment is down ~17%.81
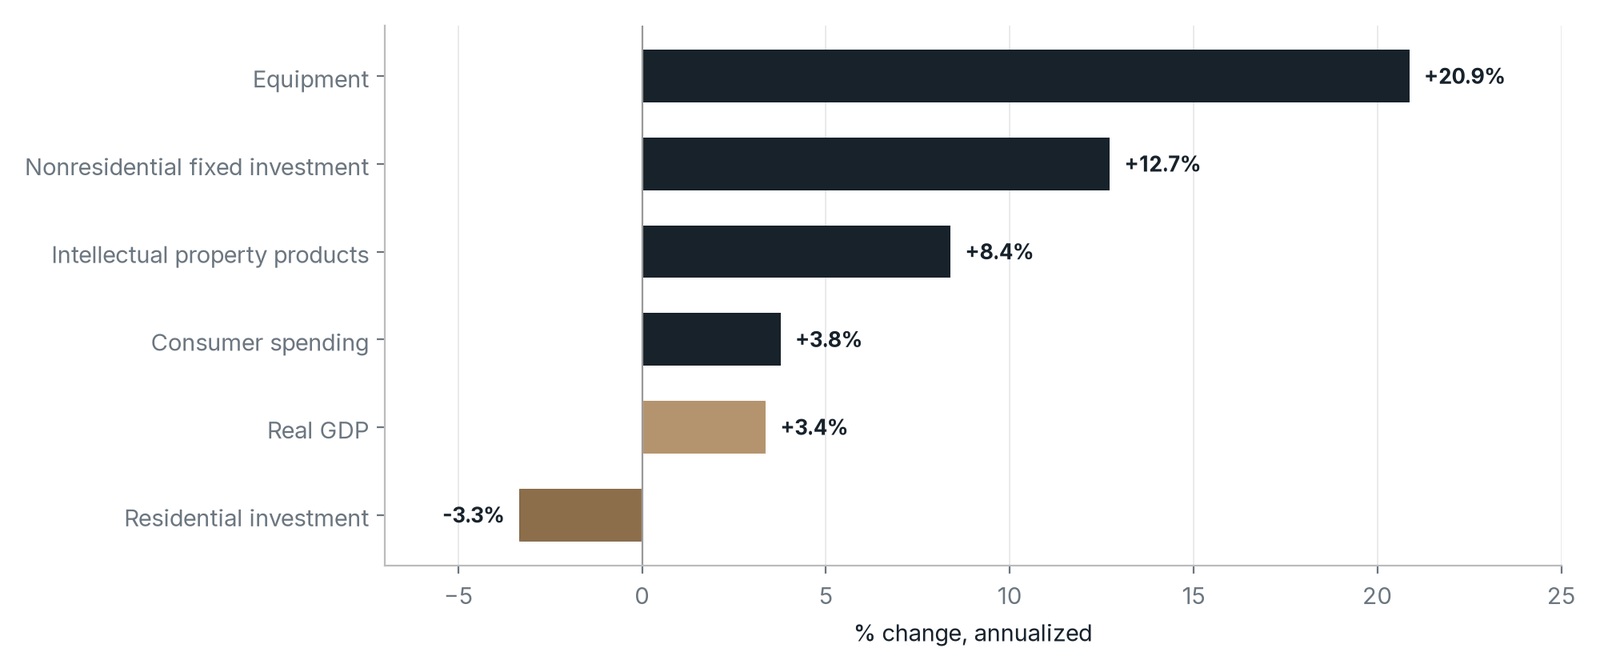
Chart Summary and Key Values
The Two-Speed Economy in One Quarter. Horizontal bars of real growth by GDP component in Q3 2026, percent change at an annual rate.
Chart Summary and Key Values
Horizontal bars of real growth by GDP component in Q3 2026, percent change at an annual rate.
- Equipment: +20.9%
- Nonresidential fixed investment: +12.7%
- Intellectual property products: +8.4%
- Consumer spending: +3.8%
- Real GDP: +3.4%
- Residential investment: −3.3%
Real growth by component, Q3 2026 (advance estimate), percent change at an annual rate
Source: U.S. Bureau of Economic Analysis, GDP advance estimate, Q3 2026 (GDPC1, PCECC96, PNFIC1, Y033RX1Q020SBEA, Y001RX1Q020SBEA, PRFIC1), via FRED.
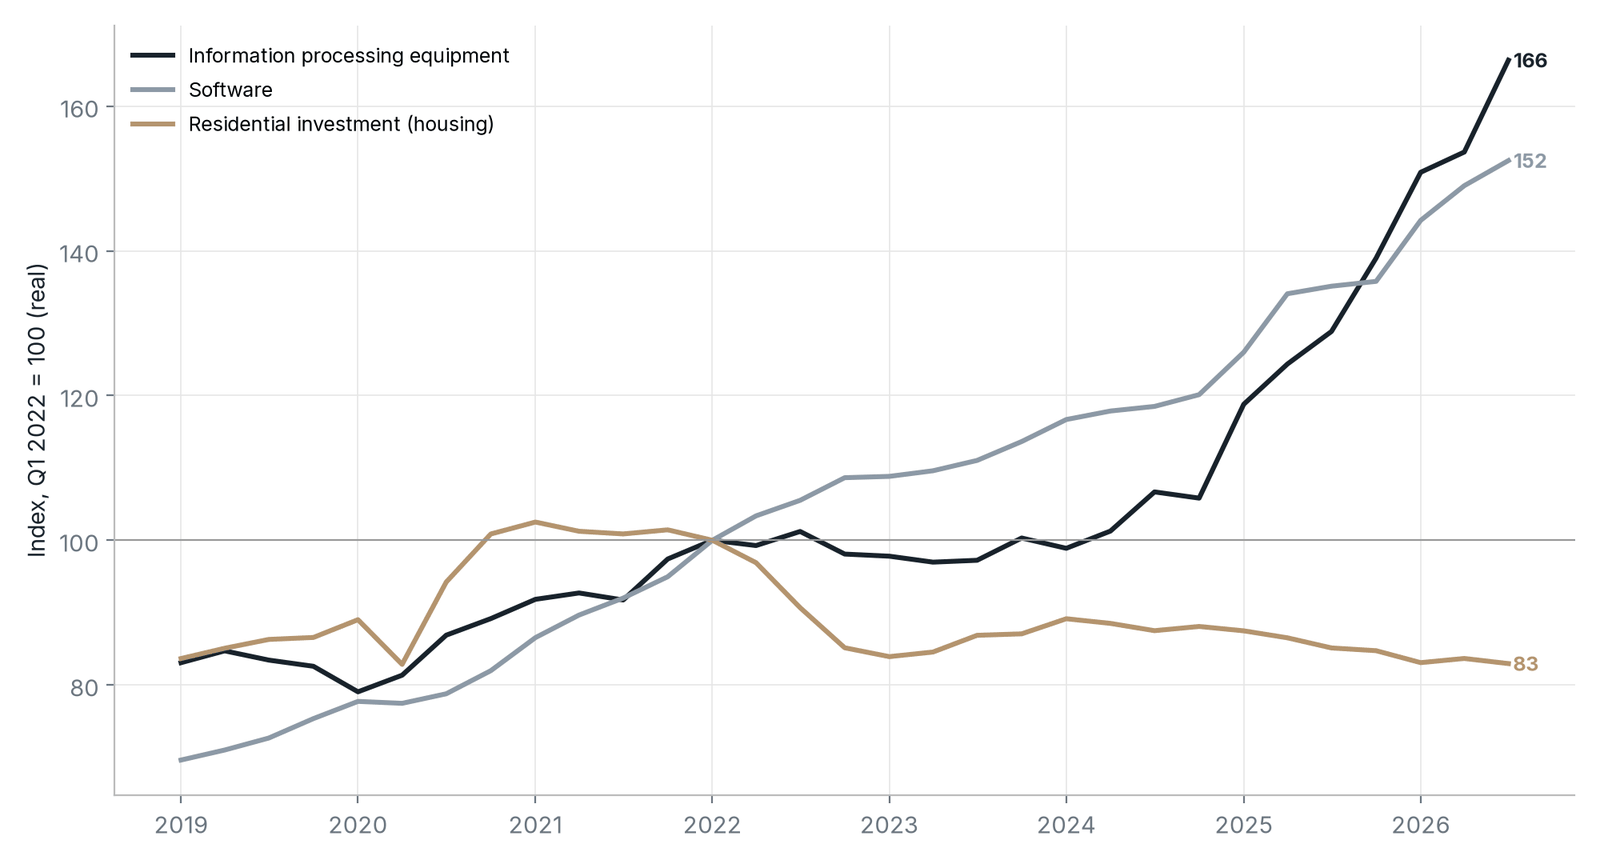
Chart Summary and Key Values
A Two-Speed Economy: Tech Capex vs. Housing. Lines of real investment indexed to Q1 2022 = 100 for information processing equipment, software and residential investment, through Q3 2026.
Chart Summary and Key Values
Lines of real investment indexed to Q1 2022 = 100 for information processing equipment, software and residential investment, through Q3 2026.
- Information processing equipment: 166
- Software: 152
- Residential investment (housing): 83
Real (inflation-adjusted) investment, indexed to Q1 2022 (the start of the Fed's 2022 hiking cycle), through Q3 2026
Source: BEA NIPA real investment series (Y034RX1Q020SBEA, B985RX1Q020SBEA, PRFIC1) via FRED; indexed to Q1 2022 = 100.
Tech investment reached a record ~5.3% of GDP in the third quarter of 2026, above the 2000 peak of ~4.5%.82 Hyperscaler capital spending is funded largely from cash flow and public capital markets, and Chairman Warsh himself noted at Jackson Hole that credit spreads sat "near the low ends of their historical ranges."83 The burden of hikes therefore falls on borrowers who reprice quickly: homebuilders, apartment developers, commercial real estate owners and small businesses.
The pattern is well documented. Gertler and Gilchrist found that after monetary tightenings, sales of small manufacturing firms fell much more sharply than those of large firms.84 Coibion, Gorodnichenko, Kueng and Silvia found that contractionary policy shocks raise inequality in earnings, spending and consumption.85 In the Federal Reserve Banks' most recent survey of small employer firms, 58% of applicants received less financing than they sought.86 Rate hikes are not a neutral tax on the whole economy; they tend to fall hardest on renters, young households and small firms.
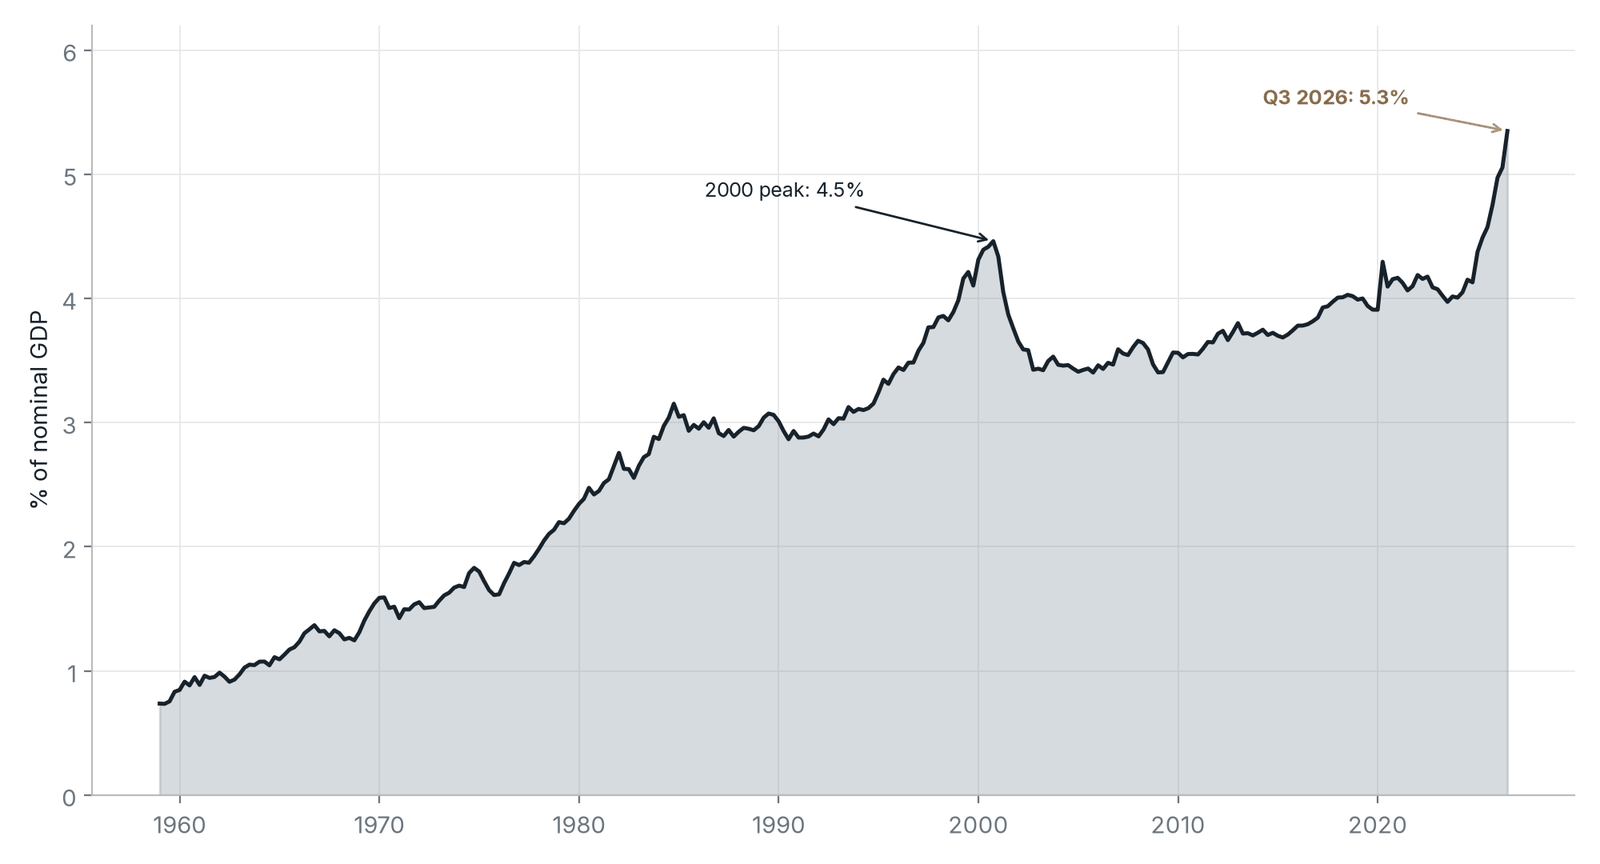
Chart Summary and Key Values
Tech Investment Is at a Record Share of the Economy. Area chart of business investment in information processing equipment plus software as a share of nominal GDP, quarterly since 1959.
Chart Summary and Key Values
Area chart of business investment in information processing equipment plus software as a share of nominal GDP, quarterly since 1959.
- Q3 2026: a record 5.3% of GDP
- Previous peak: 4.5% in 2000
Business investment in information processing equipment plus software, % of nominal GDP, quarterly
Source: BEA National Income and Product Accounts (Y034RC1Q027SBEA, B985RC1Q027SBEA, GDP) via FRED; shares of GDP computed from the nominal series. Broad tech categories, not an official AI-only measure.
Exhibit 18 shows how a 3.875% policy rate translates for Main Street. The prime rate, the benchmark for most variable-rate small-business loans, stood at 7.00%, the 30-year mortgage at 7.11%, and NFIB members reported an average short-term loan rate of 8.5% in October.87 The evidence of strain is broad (Exhibit 19).
The construction labor data make the point vividly. Residential construction shed 16,400 jobs in October, the largest monthly decline since March 2021, and is down 40,200 over the year.88 Nonresidential construction, which Associated Builders and Contractors describes as buoyed by the data-center boom, added 164,600 jobs over the same period.89 Banks tightened standards for construction and land development, multifamily and other commercial real estate loans in the October survey, and for small firms, while standards for large firms were basically unchanged.90 The share of mortgage balances moving into serious delinquency rose to 1.60% in the third quarter, from 1.28% a year earlier.91 In practice, tightening is making room for AI by shrinking housing.
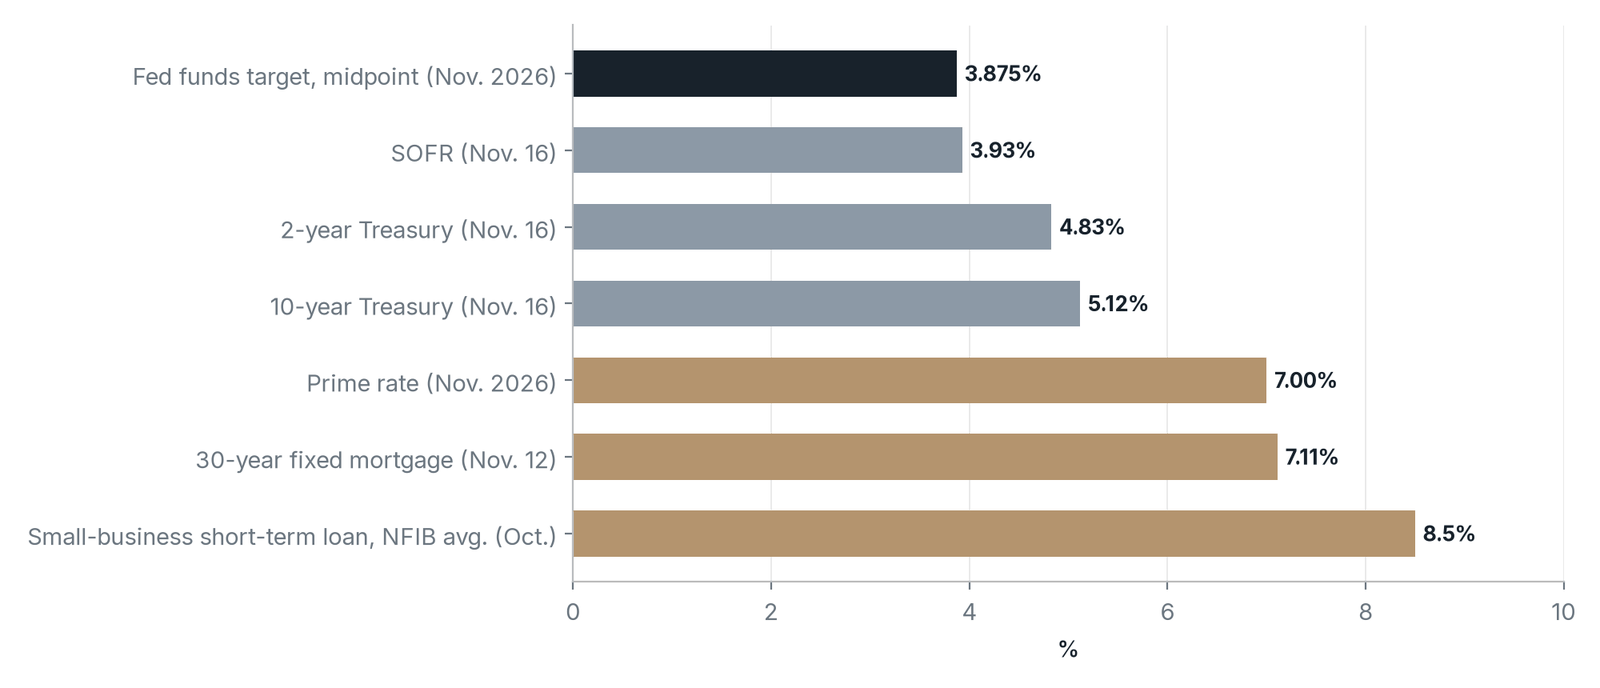
Chart Summary and Key Values
What a 3.875% Policy Rate Becomes on Main Street. Horizontal bars of selected borrowing rates in mid-November 2026.
Chart Summary and Key Values
Horizontal bars of selected borrowing rates in mid-November 2026.
- Fed funds target midpoint (Nov. 2026): 3.875%
- SOFR (Nov. 16): 3.93%
- 2-year Treasury (Nov. 16): 4.83%
- 10-year Treasury (Nov. 16): 5.12%
- Prime rate (Nov. 2026): 7.00%
- 30-year fixed mortgage (Nov. 12): 7.11%
- Small-business short-term loan, NFIB average (Oct.): 8.5%
Selected borrowing rates, mid-November 2026 (latest available reading for each)
Source: Federal Reserve Board (DFEDTARU/DFEDTARL, DGS2, DGS10, DPRIME) and Federal Reserve Bank of New York (SOFR) via FRED; Freddie Mac Primary Mortgage Market Survey, Nov. 12, 2026; NFIB Small Business Economic Trends, October 2026.
| Indicator | Latest reading |
|---|---|
| NAHB Housing Market Index (Oct.) | 29, lowest since June 2012; 43% of builders cut prices |
| Residential construction jobs (Oct.) | −16,400 for the month; −40,200 over 12 months, the 20th straight y/y decline |
| Nonresidential construction jobs (Oct.) | +164,600 over 12 months (+3.3%), including data-center and power work |
| Bank credit (Oct. SLOOS) | Standards tightened for all three CRE categories and for small firms |
| Mortgage stress (Q3) | 1.60% of balances newly seriously delinquent, up from 1.28% a year earlier |
| Small-business capex plans (Oct.) | 21%, a third straight decline |
| CMBS delinquency (Oct.) | 7.87% overall; multifamily 8.09%; office 12.33% |
Table Summary and Key Values
Column headings: Indicator, Latest reading.
Table Summary and Key Values
Latest readings for the rate-sensitive parts of the economy: builder sentiment at 29, residential construction job losses, nonresidential job gains, tighter bank standards, rising mortgage stress, falling small-business capex plans and CMBS delinquency.
Source: NAHB; AGC; Federal Reserve Board SLOOS; Federal Reserve Bank of New York; NFIB; Trepp.
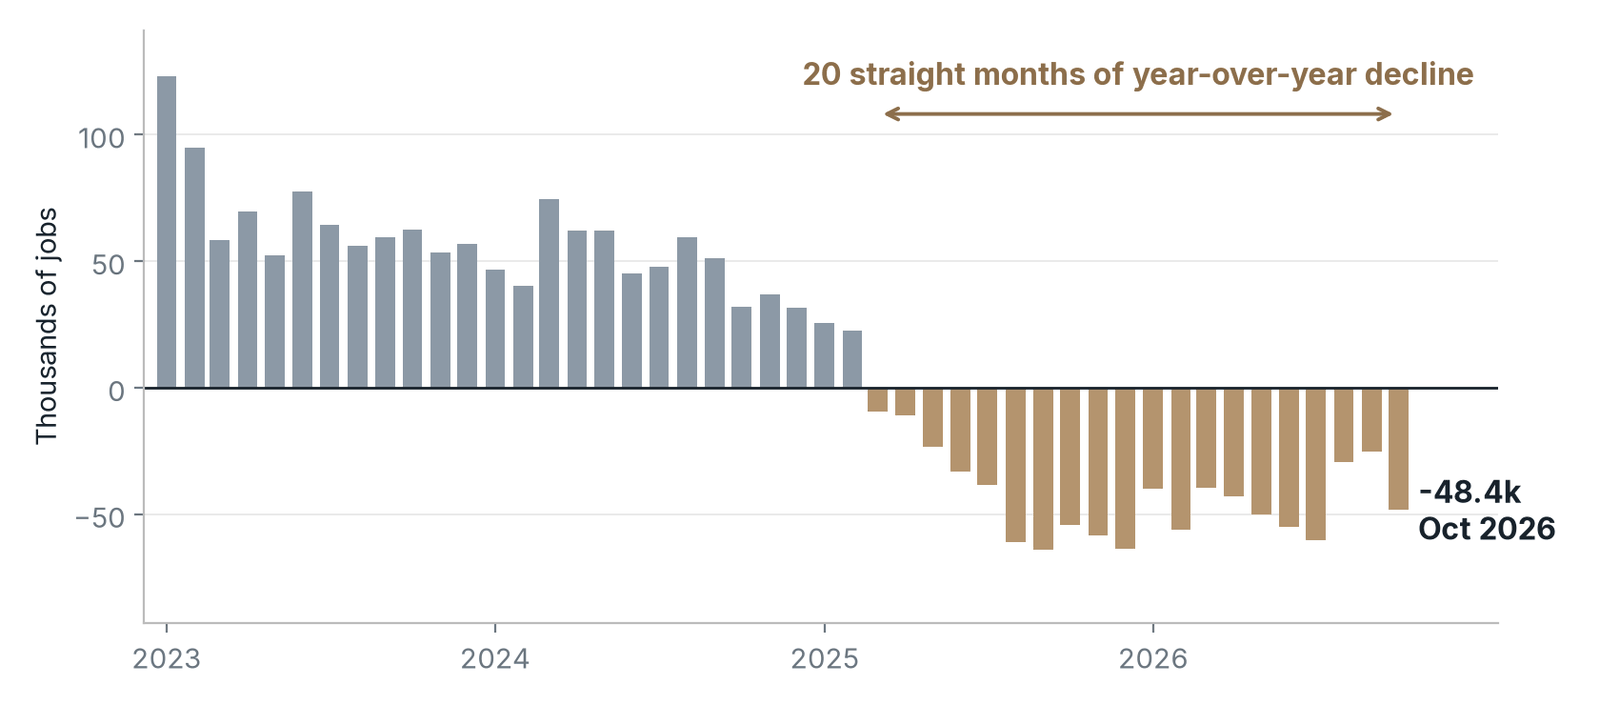
Chart Summary and Key Values
Residential Construction Has Shed Jobs for 20 Straight Months. Bars of the 12-month change in residential building and residential specialty trade contractor employment, January 2023 to October 2026.
Chart Summary and Key Values
Bars of the 12-month change in residential building and residential specialty trade contractor employment, January 2023 to October 2026.
- 20 straight months of year-over-year decline
- October 2026: −48.4 thousand (not seasonally adjusted)
- The seasonally adjusted 12-month decline reported by NAHB and AGC for October is −40,200
Residential building plus residential specialty trade contractor employment, change from 12 months earlier, thousands, Jan 2023–Oct 2026
Source: BLS Current Employment Statistics (CEU2023610001, CEU2023800101), not seasonally adjusted, via FRED. The seasonally adjusted 12-month decline reported by NAHB and AGC for October is −40,200.
10. One Engine Is Not Enough
Growth has become unusually concentrated. Jason Furman calculated that information-processing equipment and software, ~4% of GDP, accounted for ~92% of U.S. GDP growth in the first half of 2025, and that growth excluding them was ~0.1% at an annual rate.92 He called this a mechanical accounting exercise rather than a counterfactual: without the AI boom, lower interest rates and electricity prices might have made up roughly half of that growth elsewhere. Even so, AI investment has become a major driver of growth, and the economy is too reliant on it. That is a reason for caution, because the next leg of the AI buildout faces a growing policy and permitting risk.
Manufacturing's strength leans heavily on the same driver. In October, the ISM manufacturing index rose to 55.5, and the industries reporting growth included electrical equipment, machinery, and computer and electronic products, much of the data-center supply chain.93 One machinery purchasing manager said business was being driven by data centers and mission-critical infrastructure, along with municipal water projects, and a miscellaneous-manufacturing respondent said any commodity consumed by AI and data centers was in a crunch. The building-materials industry, nonmetallic mineral products such as cement and concrete, was one of only three industries contracting. If data-center construction slows, those factory orders slow with it.
That risk is bipartisan and predates the November elections. In Texas, Governor Abbott directed an audit and paused grid-connection approvals for large new data centers of 75 MW or more pending the review.94 On Nov. 3, outcomes favored limits on data-center development in 40 of 41 local ballot measures.95 By Nov. 13, the 2026 tally stood at 46 of 47.96 Roughly 40% of planned U.S. data-center capacity sits in states whose newly elected governors pledged pauses or stops.97 None of this means the buildout is stopping. It does mean that the economy cannot rely on one engine. If AI investment slows, housing and other rate-sensitive sectors need to be ready to carry growth and incomes, and restrictive policy makes that harder. The next section shows where that leaves each sector.
11. Who Is Thriving, Who Is Hurting
The U.S. economy is not uniformly strong or weak. It is split. A handful of sectors tied to AI investment are booming and largely insulated from interest rates. A wider group of sectors that run on borrowed money is contracting. Rate policy should be judged by what it does to each. Exhibit 21 maps each sector's condition and what each policy does to it.
What current policy does. The sectors that are thriving are the ones rate hikes barely touch. As Section 9 showed, hyperscalers fund much of their spending from cash flow and from bond markets where credit spreads sit near the low ends of their historical ranges. Rate hikes do little to slow the AI buildout, so they do little to cool the demand that is straining power, equipment and specialized labor. Most of the adjustment falls on the sectors that run on borrowed money and reprice quickly: builders, developers, real estate owners, small businesses and households with floating-rate debt. Current policy does little to the booming sector and hits the struggling ones hard.
| Sector | Condition now | Current policy: hikes and a high hold | Proposed policy: one decisive cut, then hold |
|---|---|---|---|
| Thriving | |||
| AI and data-center investment | Equipment investment +20.9% annualized in Q3; tech investment a record ~5.3% of GDP | Largely insulated: funded from cash flow and bond markets, with credit spreads near the low ends of their historical ranges | Little direct effect; gains a steadier economy around it and cheaper project finance for third-party data-center developers |
| AI-linked manufacturing (electrical equipment, machinery, computers) | ISM manufacturing index 55.5 in October; data centers cited as a driver | Insulated while data centers keep building; exposed if they slow | Keeps its non-AI customers (construction, consumers, small firms) healthier, a second source of orders if data-center demand slows |
| Nonresidential construction | +164,600 jobs over 12 months, including data-center and power work | Insulated for now | Lowers financing costs for power and grid projects |
| Building for AI, but rate-sensitive | |||
| Power and utilities | Rising capital spending on generation and grid to serve new data-center load | Raises the cost of debt-financed grid build-out, which flows into regulated electricity rates | Lowers that cost for utilities and their customers |
| Hurting | |||
| Homebuilding and residential construction | Builder sentiment 29, lowest since 2012; residential investment −3.3% in Q3; 20 straight months of year-over-year job losses | Direct hit: higher construction-loan costs, weaker buyers | Direct relief on construction loans priced off SOFR and prime; buyer relief depends on long rates |
| Multifamily and commercial real estate | Five-plus-unit starts at a 349,000 rate in Sept.; CMBS delinquency 7.87% (multifamily 8.09%); banks tightening | Direct hit: floating-rate loans, refinancing pressure, tighter credit | Direct relief on floating-rate and bridge debt; restarts the 2028–2029 supply pipeline |
| Small business | NFIB loan rates ~8.5%; capex plans down to 21%; 58% of credit applicants got less than they sought | Direct hit: prime-based loans at 7.00% | Prime falls to ~5.00%–5.50%; credit and investment plans can recover |
| Households, autos and durables | Real pay slipping; October-record auto payment of $823 at 6.81%; new-vehicle sales at a ~15.5 million rate; mortgage delinquency flows rising | Squeezes floating-rate debt and big-ticket purchases | Lowers card, home-equity and auto-loan rates; supports spending that factories depend on |
| Building-materials manufacturing | Nonmetallic mineral products (cement, concrete, glass) contracting in October | Follows housing down | Recovers with construction |
| Renters and first-time buyers | 30-year mortgage at 7.11%; lock-in freezing the existing stock | Keeps buyers renting; chokes off new rental supply | Restarts construction, the durable cure for rents |
| Regional and community banks | Tightened standards for all three CRE categories and for small firms | Rising CRE stress on their books | Eases borrower stress and credit losses |
Table Summary and Key Values
Column headings: Sector, Condition now, Current policy: hikes and a high hold, Proposed policy: one decisive cut, then hold.
Table Summary and Key Values
The sector scorecard: which sectors are thriving (AI and data-center investment, AI-linked manufacturing, nonresidential construction), which are building for AI but rate-sensitive (power and utilities), and which are hurting (housing, multifamily and commercial real estate, small business, households, building materials, renters, regional banks), with what current policy and the proposed policy each do.
Source: BEA (GDP, Q3 2026); ISM (Manufacturing PMI, Oct. 2026); AGC and ABC (construction employment, Oct. 2026); NAHB; Census and HUD (starts); Trepp (CMBS); NFIB; Federal Reserve Banks (Small Business Credit Survey); Federal Reserve Board (SLOOS, Oct. 2026; prime rate); Federal Reserve Bank of New York; Freddie Mac (PMMS); J.D. Power and GlobalData (October 2026 forecast); NADA (Oct. 2026 SAAR); Kevin Warsh, Jackson Hole, Aug. 28, 2026 (credit spreads). Prime rate after the cut assumes the usual 3-point spread over the top of the target range.
Why the healthy sectors are not safe. The sectors doing well today depend on one of two things: continued AI investment, or demand from the sectors policy is shrinking. AI-linked manufacturers need data centers to keep breaking ground, and the permitting and ballot-box risk described in Section 10 is growing. Food, furniture, vehicles and building materials need households and builders who can borrow. If housing, real estate and small business keep contracting, the demand they create for materials, appliances, vehicles and wages leaves the economy, and today's healthy sectors feel it next. Growth that leans this heavily on one driver is fragile growth.
What one decisive cut does. The proposed cut reaches the struggling sectors directly. Construction loans priced off SOFR and prime, small-business lines of credit, card and home-equity balances and commercial real estate bridge loans generally reprice within weeks. For the thriving sectors, the benefit is indirect but real: a broader customer base, cheaper financing for the power and grid projects AI needs, and a second engine if AI investment slows. Two cautions belong here. Relief for home buyers depends on long-term rates, which follow the 10-year Treasury more than the funds rate. And a lower rate held steady is stimulative every month it holds, by design. That is why the cut comes with published tripwires (Sections 14 and 15).
The goal is not to slow the AI economy or to favor one industry over another. It is growth on more than one leg: an AI buildout that continues, alongside housing, real estate and small business that can grow again.
12. Housing: More Units, Not Fewer Jobs
Housing is where the gap between the Fed's tool and the inflation problem is widest. Rent is the largest single piece of measured inflation, and the durable way to lower it is to add units. Higher rates work against that: they raise the cost of financing new construction, slow starts and, through mortgage lock-in, keep would-be buyers in the rental market. This section looks at what cured the last rent surge, how rates can push rents up and what the construction pipeline implies for the next two years.
Supply cured the last rent surge
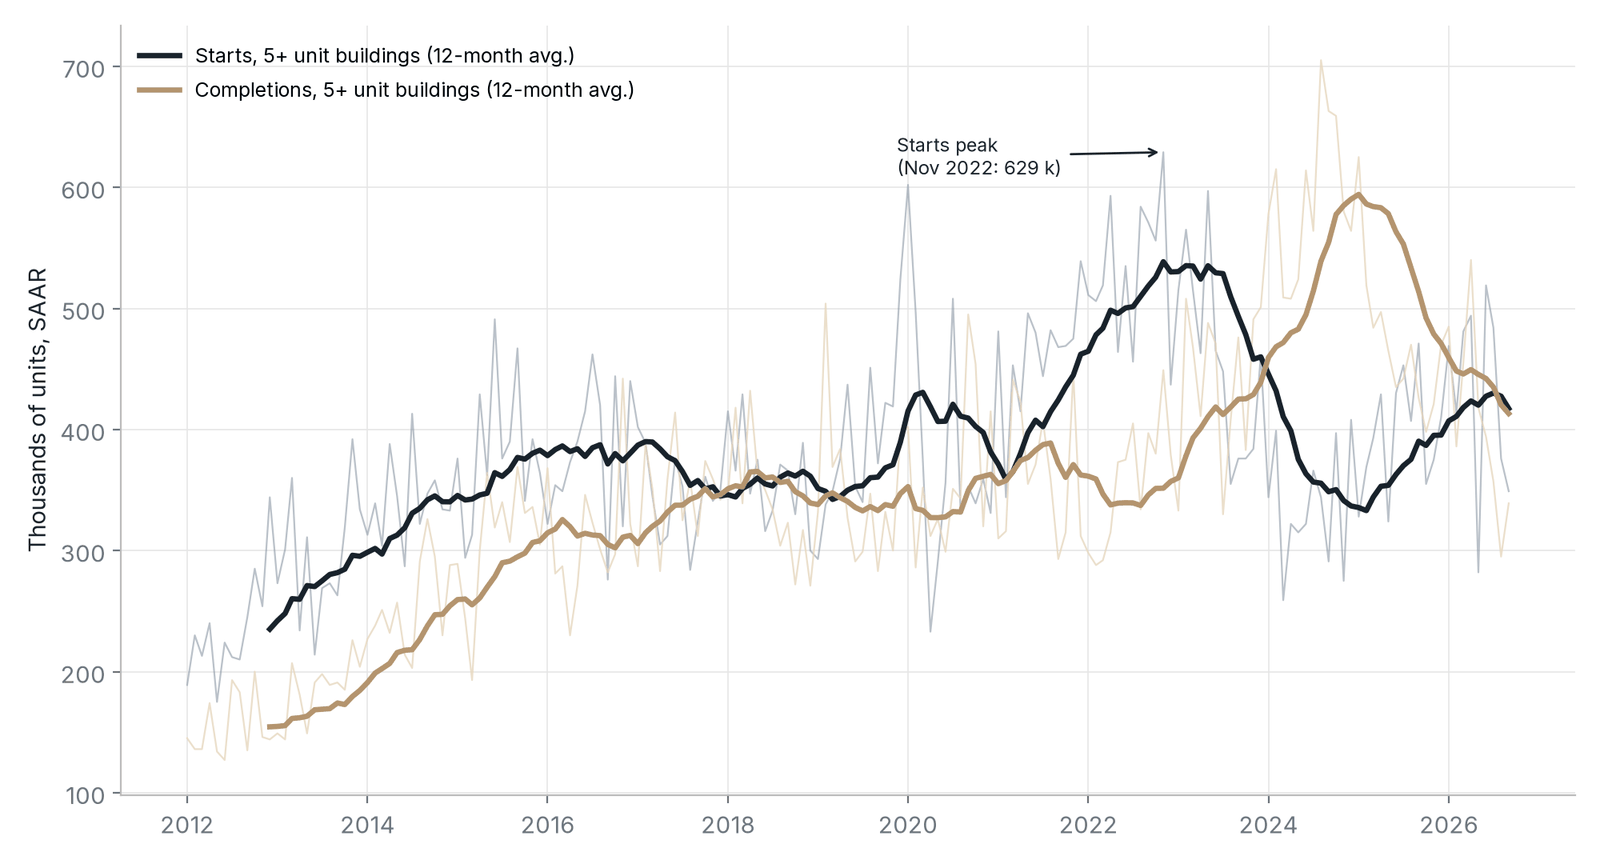
Chart Summary and Key Values
The Multifamily Supply Wave Has Passed Its Peak. Lines of multifamily (5+ unit) starts and completions at a seasonally adjusted annual rate, 12-month averages with monthly readings, January 2012 to September 2026.
Chart Summary and Key Values
Lines of multifamily (5+ unit) starts and completions at a seasonally adjusted annual rate, 12-month averages with monthly readings, January 2012 to September 2026.
- Starts peaked in November 2022 at a 629,000 annual rate (monthly)
- Completions peaked at a ~594,000 rate (12-month average) in early 2025 and have since fallen
- By September 2026, starts (~417,000) and completions (~413,000) had converged (12-month averages)
Multifamily (5+ units) starts and completions, seasonally adjusted annual rate, Jan 2012–Sep 2026 (thin lines = monthly)
Source: U.S. Census Bureau / HUD, New Residential Construction (HOUST5F, COMPU5MUSA), via FRED.
The rent relief of 2024–2026 came from a supply wave. Multifamily completions surged as projects started in 2021–2022 delivered, and market rents flattened as that supply arrived.98 Apartment List's national index was up just 0.1% year over year in October, with vacancy at ~7% and 32% of properties offering at least one free month.99 In Houston, Zillow's rent index was up ~0.3% and in DFW ~1.1% over the year to October.100 Cooling rents by adding units means renters keep their jobs and gain choices and concessions. Cooling rents by cutting jobs means renters lose income at the same time, so affordability does not improve.
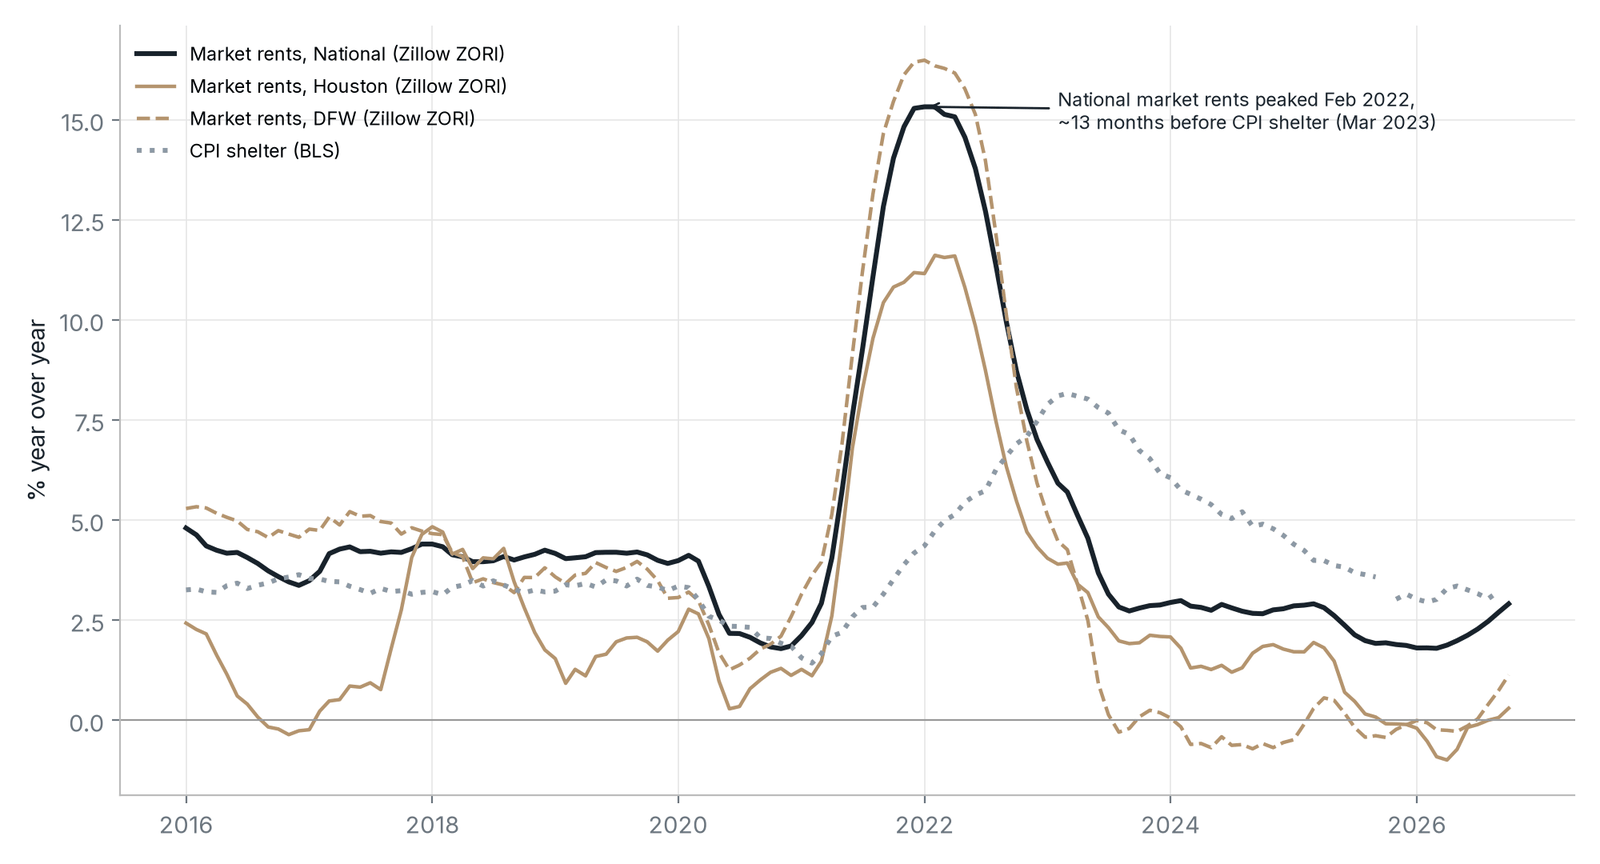
Chart Summary and Key Values
Market Rents Lead CPI Shelter, and Cooled First. Lines of year-over-year market rent growth (Zillow ZORI) for the nation, Houston and Dallas-Fort Worth, against CPI shelter.
Chart Summary and Key Values
Lines of year-over-year market rent growth (Zillow ZORI) for the nation, Houston and Dallas-Fort Worth, against CPI shelter.
- National market rents peaked in February 2022, ~13 months before CPI shelter (March 2023)
- October 2026 market rent growth: ~2.9% national, ~0.3% Houston, ~1.1% DFW (year over year)
- CPI shelter: 3.2% year over year in September 2026
Year-over-year change; Zillow Observed Rent Index (single-family and multifamily rentals, smoothed) through Oct 2026; CPI shelter through Sep 2026
Source: Zillow Research, ZORI (metro and national); BLS CPI-U shelter (CUSR0000SAH1) via FRED. DFW = Dallas-Fort Worth-Arlington metro.
Shelter carries the largest weight of any CPI component, and CPI shelter lags market rents by roughly a year: national market rents peaked in February 2022, and CPI shelter peaked about 13 months later.101 Policy that suppresses construction today shows up in measured inflation years from now.
Much of that weight is imputed. Owners' equivalent rent, the rent homeowners are assumed to pay themselves, accounted for ~25.9% of the CPI in September 2026, against ~7.7% for rent that tenants actually pay.102 No household writes that check, and for owners with fixed-rate mortgages, the mortgage payment did not rise with it. Chodorow-Reich and Mehrotra conclude that optimal monetary policy "should put less weight on shelter inflation."103
Higher rates can raise rents
Dias and Duarte, one of them a Federal Reserve Board economist, find that unlike house prices, rents rise after a contractionary monetary policy shock, as would-be buyers stay renters and rental vacancies fall.104 Mortgage lock-in compounds the effect. FHFA economists estimate that each percentage point by which market mortgage rates exceed a borrower's locked-in rate reduces the probability of a sale by 18.1%; lock-in prevented ~1.72 million home sales from mid-2022 to mid-2024 and raised home prices by ~7.0%, partly offsetting the direct price decline from higher rates.105 Fonseca, Liu and Mabille estimate that, through lock-in, a temporary rate hike raises house prices by 4.4% and rents by 1.5% relative to a world without lock-in, while borrowers' mobility falls 25%.106 Hiking to fight measured inflation can therefore push up the very component that keeps measured inflation high, and in this case it is a particularly meaningful component: the affordability of housing.
There is a second, more direct channel. For an interest-intensive industry, the policy rate is a cost of production. Barth and Ramey found that after monetary tightenings, output falls while prices rise relative to wages in industries with large financing needs, which they called the cost channel of monetary policy.107 Gaiotti and Secchi confirmed it in data on ~2,000 firms: interest costs pass into prices in proportion to each firm's financing needs.108 Apartment development is a clear case. A community is typically financed for two to three years before it collects rent, so the construction-loan rate is built into the rent the finished building must charge. When that rent does not pencil, the building is often not built.
That is a rent increase for the worst of reasons. Rents rise not because incomes are growing and renters can afford more, but because new supply is choked off and would-be buyers are held in the rental market. Renters pay more for the same unit while the projects that would have added competition are shelved. For owners of existing buildings it can look like pricing power, but it is scarcity, and it arrives alongside slower job and wage growth, so affordability worsens on both sides of the household budget.
The evidence that supply lowers rents
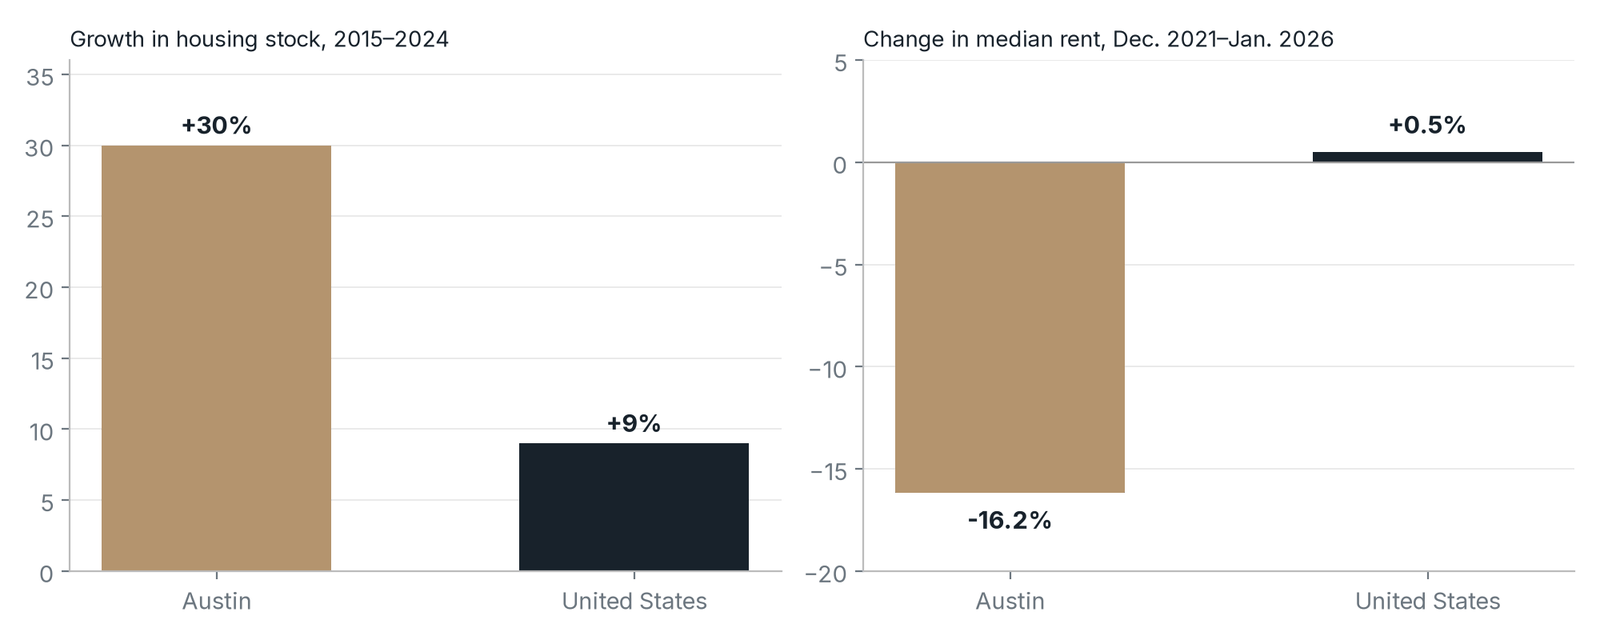
Chart Summary and Key Values
Build More, Pay Less: Austin's Supply Surge and Falling Rents. Two-panel bars: growth in the housing stock, 2015–2024, and change in median rent, December 2021 to January 2026, Austin vs. the United States.
Chart Summary and Key Values
Two-panel bars: growth in the housing stock, 2015–2024, and change in median rent, December 2021 to January 2026, Austin vs. the United States.
- Housing stock growth: Austin +30%, United States +9%
- Median rent change: Austin −16.2% ($1,546 to $1,296); United States +0.5% ($1,346 to $1,353)
Austin added ~120,000 units in 2015–2024; its median rent fell from $1,546 to $1,296 while the U.S. median was roughly flat ($1,346 to $1,353)
Source: The Pew Charitable Trusts, "Austin's Surge of New Housing Construction Drove Down Rents," Mar. 18, 2026; percent changes computed from Pew's reported medians.
Austin is the clearest recent case. From 2015 to 2024, the city added ~120,000 units, growing its housing stock 30% versus 9% nationally. Its median rent fell from $1,546 in December 2021 to $1,296 in January 2026, while the U.S. median was roughly flat, and rents in older Class C buildings fell ~11%.109
Building-level research points the same way. Asquith, Mast and Reed find that large new buildings in low-income areas lower nearby rents by ~5%–7% relative to trend.110 Mast finds that new market-rate construction opens up units in lower-income neighborhoods through chains of moves.111
Neighborhood and citywide evidence agree. Li finds that in New York City, each 10% increase in the local housing stock lowers nearby rents by ~1%.112 In Austin, inflation-adjusted rents fell 19% from the 2021 average to the 2025 average, according to Pew.113
The next supply cliff is already forecast
Yardi Matrix projects multifamily completions falling from 696,281 units in 2024 to a trough of 450,964 in 2027, ~35% below the peak.114 Its forecast of only a modest rebound in 2028, to 464,242, assumes a largely steady economy with the fed funds rate rising only modestly, and Yardi notes that the mid-year jump in rates and inflation may already be weighing on starts.115 Census data show five-plus-unit starts at a 349,000 annual rate in September, down from ~430,000 in the first half of 2026, as rate expectations rose around the September hike.116 Monthly starts are volatile, and Yardi's own count of starts through the third quarter was still up from 2025, so the recent drop is an early signal rather than a collapse. The direction is the concern: the rent relief of 2025–2026 came from supply, the pipeline is shrinking, and higher rates are deepening the decline. Published estimates of the national housing shortfall already run to several million units.117
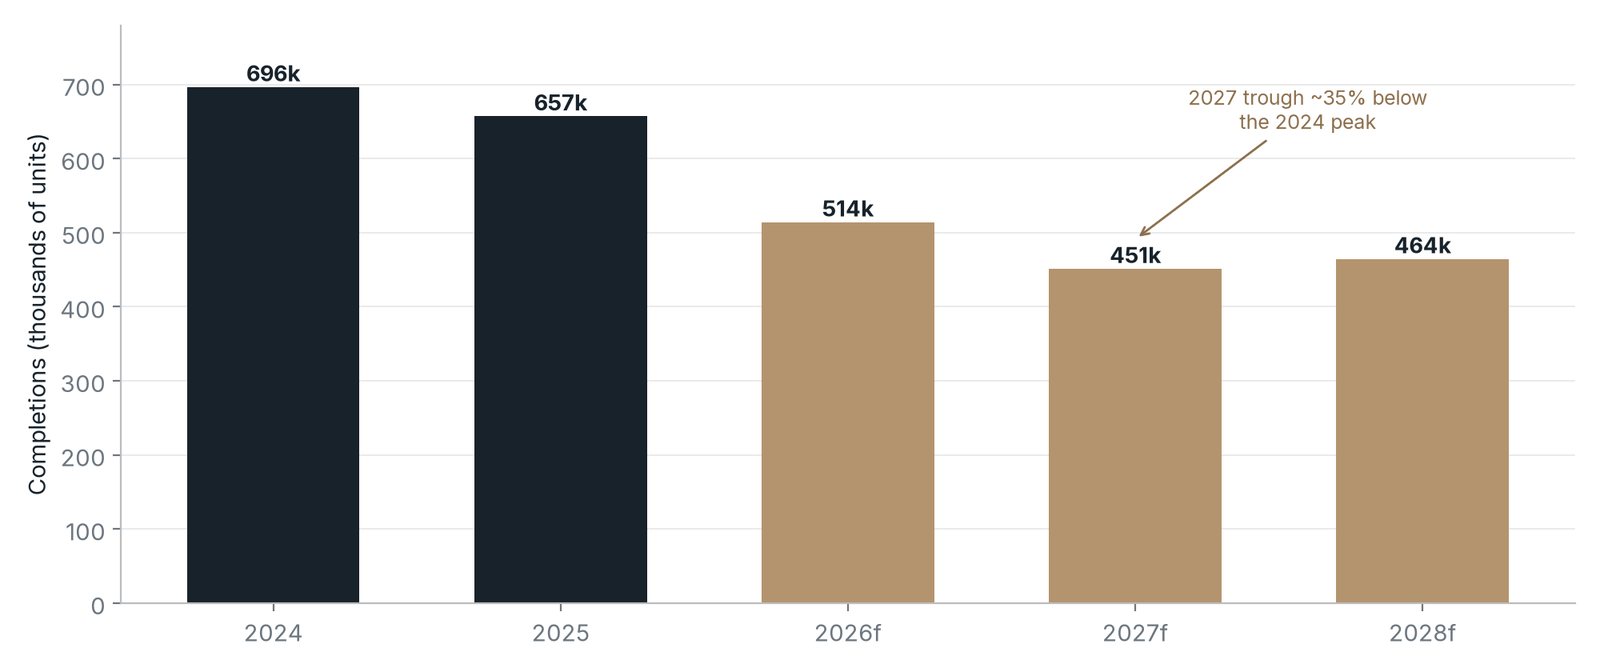
Chart Summary and Key Values
The Apartment Supply Cliff Is Already Forecast. Bars of U.S. multifamily completions, actual 2024–2025 and Yardi Matrix forecast 2026–2028, in units.
Chart Summary and Key Values
Bars of U.S. multifamily completions, actual 2024–2025 and Yardi Matrix forecast 2026–2028, in units.
- 2024: 696,000; 2025: 657,000
- Forecast: 514,000 (2026), 451,000 (2027), 464,000 (2028)
- The 2027 trough is ~35% below the 2024 peak
U.S. multifamily completions, actual (navy) and Yardi Matrix forecast (bronze), units; the 2028 forecast assumes a largely steady economy and only modestly higher policy rates
Source: Yardi Matrix, Multifamily Supply Forecast, Q4 2026 (Nov. 11, 2026), as reported by CRE Daily.
Housing also leads the business cycle. Edward Leamer's Jackson Hole paper found residential investment to be the best early-warning sign of recession, with most postwar recessions preceded by substantial problems in housing and consumer durables.118 The sector that historically leads the economy into downturns is already contracting, and policy is tightening on it.
13. Predictability: One Decisive Move, Then a Steady Path
Businesses can plan around high rates or low rates. What they cannot plan around is a path that reverses every year. A clear, committed path, paired with a published tolerance range, gives firms a stable planning horizon. That is especially true for real estate development, where decisions made today deliver units two to three years from now.
Uncertainty about the Fed is running well above normal. The Baker-Bloom-Davis monetary policy uncertainty index stood at ~205 in October 2026, ~2.2 times its 1985–2019 average of ~92.119 Realized volatility in the 2-year Treasury yield is roughly double its 2010–2019 average, although closer to its longer-run norm.120
What the research shows
- Bloom shows that uncertainty shocks lead firms to pause hiring and investment, producing a sharp drop in activity.121
- Baker, Bloom and Davis link higher policy uncertainty to lower investment and employment in policy-sensitive sectors.122
- Gulen and Ion find that policy uncertainty depresses corporate investment most strongly for firms whose investments are hard to reverse.123
- Husted, Rogers and Sun, Federal Reserve Board economists, find that shocks to monetary policy uncertainty raise credit spreads, reduce output and cause "protracted declines in firm investment," with effects comparable in size to conventional rate hikes.124
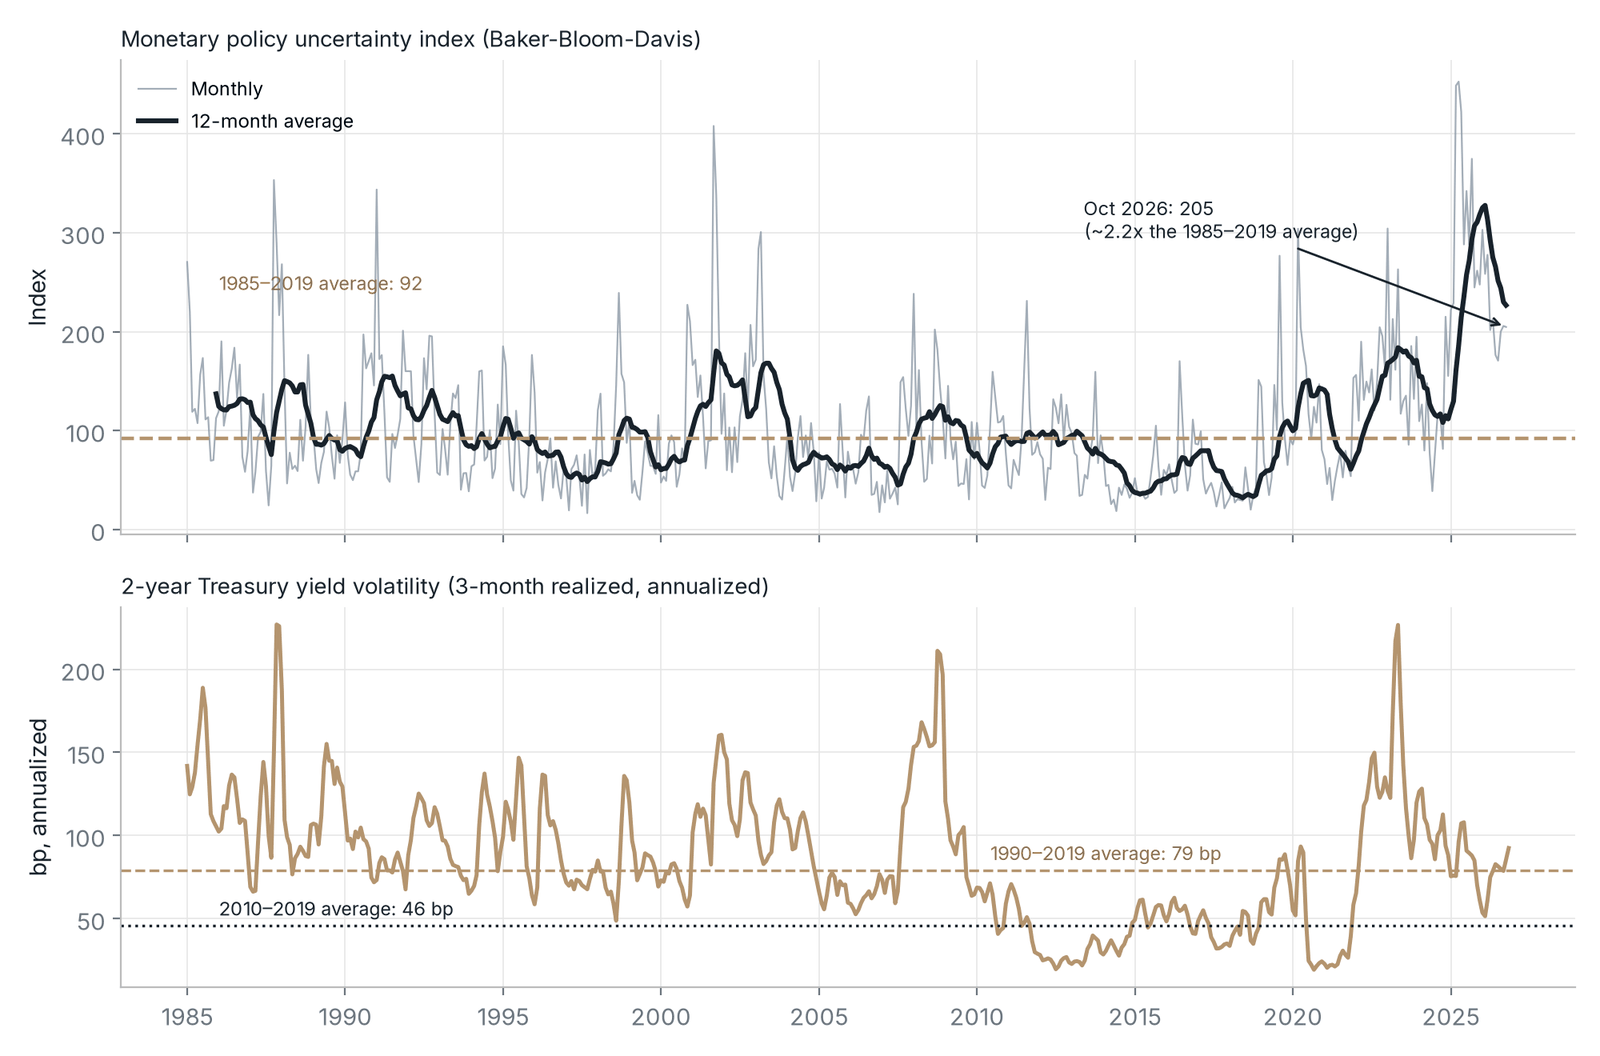
Chart Summary and Key Values
Uncertainty About the Fed Is Running Well Above Normal. Two panels: the Baker-Bloom-Davis monetary policy uncertainty index (monthly and 12-month average) and realized 2-year Treasury yield volatility, 1985–2026.
Chart Summary and Key Values
Two panels: the Baker-Bloom-Davis monetary policy uncertainty index (monthly and 12-month average) and realized 2-year Treasury yield volatility, 1985–2026.
- October 2026 uncertainty index: 205, ~2.2x the 1985–2019 average of 92
- 2-year Treasury volatility (3-month realized, annualized): 1990–2019 average 79 bp; 2010–2019 average 46 bp
Monetary policy uncertainty index (top) and realized 2-year Treasury volatility (bottom), 1985–2026
Source: Baker, Bloom and Davis, Economic Policy Uncertainty, categorical index: monetary policy (policyuncertainty.com; FRED EPUMONETARY), through Oct 2026; Federal Reserve Board 2-year Treasury yield (DGS2) via FRED; realized volatility of daily changes.
Why development is the textbook case
Real-options theory shows that when the future is uncertain, the rational move on an irreversible project is to wait.125 Apartments fit that description. Buildings with 20 or more units took ~21.7 months from permit to completion in 2025, and large projects take longer.126 Construction loans are commonly priced off short-term benchmarks such as SOFR, so every swing in the expected policy path changes the interest budget during construction.127 A developer underwrites the permanent loan and exit valuation two to three years ahead. When the policy path reverses mid-construction, both move against plans that were reasonable when the project began. The predictable result is delay or cancellation, and fewer units delivered two to three years later.
CFOs feel this too. In the third-quarter 2026 CFO Survey, monetary policy rose to the top of executives' most pressing concerns, and small firms were roughly twice as likely as large firms to report financial constraints.128
Clear guidance is itself a form of support
The forward-guidance literature shows that communicating the expected path moves longer-term rates and expectations, not only the overnight rate.129 Husted, Rogers and Sun find that rate moves accompanied by reduced uncertainty can largely offset their contractionary effects.130 The policy package in Section 15 is designed for predictability: one decisive move, a stated hold and published conditions for changing course.
14. Steelmanning the Critics
This paper is a minority view, and its case is only as strong as its answers to the best objections. Each counterargument below is stated in its strongest form, followed by the response.
"Cutting into 3.6% inflation is reckless."
The objection: Headline PCE inflation is 3.6%, core is 3.1%, and Bowman estimates October core at 3.3%.131 October CPI rose 0.4% for the month, with core up 0.3%.132 Governor Waller had said a 50 bp hike "should be considered" if October core CPI rose 0.3% or more, and it did.133 Cutting now signals tolerance for higher inflation.
The response: The cut is large by design, but it is a single move followed by a stated hold, not the start of an open-ended easing cycle. Quarterly PCE inflation has already slowed to 2.1% annualized, the Fed's own forecast has inflation near target next year, and the proposal pairs the cut with explicit tightening triggers.134 Measured against the Fed's 2027 core PCE forecast of 2.5%, a 1.75%–2.50% range would put the real policy rate only modestly below zero, at ~−0.1 to −0.6 point.135 Measured against current one-year expected inflation of ~3.0% from the Cleveland Fed's model, the real rate would be lower, at ~−0.7 to −1.2 points, which is why the hold comes with tripwires.136
"Holding at ~2% will reignite inflation."
The objection: A rate held well below neutral adds stimulus every month it holds. Manufacturing is expanding, with the ISM index at 55.5 in October and its prices index at 75.2.137
The response: The cut is stimulative by design, and that is the point. Its stimulus lands first on floating-rate borrowers: builders, developers, real estate owners and small businesses, sectors that are contracting, not overheating. The energy impulse is fading, with quarterly PCE inflation at a 2.1% annual rate.138 Demand responds faster than new supply, so the hold is conditional: it ends if inflation breaks above the tranche ceiling, if unit labor costs accelerate or if long-run expectations move past the thresholds set out below. Apartments financed in 2027 would deliver in 2028 and 2029, just after the forecast trough in completions.139
"This is the 2021 'transitory' argument, and it failed."
The objection: The Fed waited too long in 2021, and inflation has now been above 2% for more than five years.
The response: The 2021 conditions are absent. Then, the policy rate was near zero, the fiscal impulse was very large and the labor market was very tight. Now the policy rate sits above neutral, unemployment is 4.1%, and the 10-year real Treasury yield is ~2.9%, near its highest since 2008.140 The objection also overlooks how much money was created during COVID. The M2 money supply rose ~40% from February 2020 to its March 2022 peak, from ~$15.5 trillion to ~$21.8 trillion, and its year-over-year growth reached ~27% in February 2021, the fastest since the monthly series began in 1959.141 Over the same period, the Fed's balance sheet more than doubled, from ~$4.2 trillion to ~$9.0 trillion. Nothing comparable is under way today: M2 grew ~5.7% over the year to September 2026, close to its 2010–2019 average of ~5.8%, and the balance sheet has shrunk to ~$6.8 trillion.142 The lesson of 2021 is built into the proposal: the tranche framework includes a hard tightening trigger, which "transitory" lacked.
"Expectations are de-anchoring."
The objection: Michigan long-run expectations are 3.4%, and a November 2026 Federal Reserve staff note finds that oil-to-core pass-through and inflation persistence have risen since 2021.143
The response: This is the most serious objection, and it is why the proposal includes tripwires. But long-run expectations fell in November, and the 10-year breakeven was ~2.2% in mid-November.144 The same staff note estimates that a 10-point rise in relative oil-price inflation raises core inflation by ~0.14 point. We would tighten if survey long-run expectations rose above ~3.5%–4% or the 10-year breakeven moved above ~2.75%; those thresholds are this paper's judgment, not official guidance.
"Shocks keep arriving, so none of them is temporary."
The objection: After the pandemic, tariffs and the war, Chicago Fed President Austan Goolsbee argues that large shocks should be presumed persistent until the data show otherwise, and Cleveland Fed President Beth Hammack says she has "a much harder time looking through shocks that arrive one after another."145
The response: The test for persistence is second-round effects, and the evidence for them is thin. Unit labor costs are rising ~2.4%, wage growth trails prices, and the 10-year breakeven sits near 2.2%. The shocks are also not compounding: the Supreme Court struck down the IEEPA tariffs, refunds are being paid, and Gulf crude flows are back near pre-conflict levels. Serial shocks are the reason for published tripwires, not a reason to tighten before they trip.
"Hiking into oil shocks does not cause recessions."
The objection: Kilian and Lewis challenge the Bernanke-Gertler-Watson finding.146
The response: The academic debate is real, so this paper does not rest on one study. Kilian and Lewis find that the post-1987 Fed generally did not tighten into oil shocks, which is the behavior this paper urges. The ECB's 2008 and 2011 reversals and the BIS look-through doctrine carry the rest of the argument.
"Soft landings are more common than people think."
The objection: Alan Blinder's review of Fed tightening cycles since 1965 finds that soft or softish landings were more common than often assumed.147
The response: That is encouraging, but the 2022–2025 soft landing happened as supply healed, not because demand was crushed. Tightening into a supply shock, with housing already contracting, is a riskier configuration.
"A cut would raise long rates and look like fiscal dominance."
The objection: After the Fed began cutting in September 2024, the 10-year Treasury yield rose from ~3.65% to ~4.79% and mortgage rates rose from ~6.1% to ~7.0%.148 With the 10-year near 5% and political pressure on the Fed, a cut could push long rates higher.
The response: This is the paper's biggest risk, and we cannot prove that long rates would fall. But hawkishness has not bought lower long rates either: the 10-year yield rose to ~5.15% on Nov. 13 through a hike and two hawkish dissents.149 With breakeven inflation near 2.2%, a 5% yield is mostly a real-rate and term-premium story tied to deficits and supply, which the funds rate cannot fix. There is also a fiscal channel that works in the cut's favor. A stronger, growing economy widens the tax base and narrows projected deficits, and Laubach estimates that each point of projected deficit-to-GDP adds ~25 bp to long-term interest rates.150 A downturn, by contrast, would widen deficits and add to Treasury supply. The proposal is the opposite of open-ended accommodation: one decisive move, a stated hold, a published ceiling and re-tightening triggers.
"AI demand is itself inflationary, so demand is the problem."
The objection: Bowman attributes a quarter of the core overshoot to AI-related pressures.151 Construction pay rose 5.2% over the year to October, and the industry's unemployment rate tied a record low for the month.152
The response: The funds rate is a poor tool for a sector financed from cash flow. In practice, hikes make room for AI by shrinking housing. Targeted tools, such as power, permitting and grid-cost allocation, address the bottleneck directly, and states are already tightening rules on data-center power and permitting.
"Neutral may be higher than 3.2%, so policy is not actually tight."
The objection: Model estimates of the neutral rate vary, and markets price a higher real forward rate.
The response: Most published model averages still sit below today's 3.875% midpoint, and the rate-sensitive sectors show revealed tightness: builder sentiment at 29, tightening bank standards, falling starts and rising mortgage delinquency flows. If neutral were as high as 3.5%–3.75%, a 150–200 bp cut would be more stimulative than intended, which is why the hold comes with tripwires. But the uncertainty runs both ways. The New York Fed's Holston-Laubach-Williams model put the real neutral rate at ~1.0% in mid-2026, which implies a nominal neutral rate near 3% with 2% inflation.153
"Higher rates are needed to offset fiscal deficits."
The objection: The federal deficit was ~$1.99 trillion in fiscal 2026.154
The response: Higher rates raise federal net interest costs, which reached ~$1.14 trillion in fiscal 2026 by CBO's count, and so worsen the deficit they are meant to offset.
15. Policy Recommendation
The recommendation is designed to be robust to whatever the Fed does next. It is sized to a destination, not to a specific meeting.
1. One decisive cut of 150–200 bp, as soon as possible, and then hold. A single move that takes the target range to ~1.75%–2.50% is better than a drawn-out series of meeting-by-meeting adjustments. If the Fed hikes first, the destination stays the same and the cut grows.
This goes beyond a return to neutral, by design. The size of the cut is set by what the contracting sectors need, not by estimates of the neutral rate. Those estimates are uncertain: the FOMC's median longer-run estimate has moved from 2.5% in December 2023 to 3.2% in September 2026.155 The New York Fed's Holston-Laubach-Williams model implies a nominal neutral rate near 3%.156 Three considerations drive the size. First, the economy needs more than one engine. The sectors that would help carry growth if AI investment slows (housing, real estate and small business) are contracting, and a cut that only reaches neutral may not be enough to restart the construction that would deliver units in 2028 and beyond (Section 11). Second, the cut reaches those sectors quickly: construction loans, small-business credit and commercial real estate debt reprice off SOFR and prime within weeks. Third, decisive moves have precedent: the Fed cut 125 bp in nine days in January 2008 and 150 bp in under two weeks in March 2020.157 Both came in crises, but they show the Fed can move in large steps when it judges the risks warrant. No standard policy rule prescribes a rate this low: the median of the Cleveland Fed's simple monetary policy rules was ~4.3% as of September.158 The size of the cut is therefore a judgment about where the risks lie, not the output of a formula.
| If the target range is… | Midpoint vs. the Fed's 3.2% neutral estimate | Cut needed to reach ~1.75%–2.50% | Resulting midpoint vs. the Fed's 3.2% neutral estimate |
|---|---|---|---|
| 3.75%–4.00% (mid-November 2026) | ~0.7 point above | 150–200 bp | ~0.8–1.3 points below |
| 4.00%–4.25% (after one more 25 bp hike) | ~0.9 point above | 175–225 bp | ~0.8–1.3 points below |
| 4.25%–4.50% (after 50 bp of further hikes) | ~1.2 points above | 200–250 bp | ~0.8–1.3 points below |
Table Summary and Key Values
Column headings: If the target range is…, Midpoint vs. the Fed's 3.2% neutral estimate, Cut needed to reach ~1.75%–2.50%, Resulting midpoint vs. the Fed's 3.2% neutral estimate.
Table Summary and Key Values
How large a single cut would need to be to reach ~1.75%–2.50% from today's range or after further hikes, and where the resulting midpoint would sit against the Fed's 3.2% neutral estimate.
Source: Federal Reserve Board, Summary of Economic Projections, Sept. 16, 2026 (longer-run federal funds median 3.2%, range 2.9%–3.9%; 2027 core PCE median 2.5%). Midpoints and differences computed from these figures.
2. A stated hold, with the conditions for changing course spelled out. The cut should come with a commitment to hold at the new level while inflation stays inside the tolerance range and incomes are growing. The hold is what keeps a large cut from becoming an open-ended easing cycle, and it is what gives businesses a path they can plan around.
3. A published tranche framework with tripwires. Keep 2% as the long-run anchor. Hold while PCE inflation is in the 2%–5% range and real incomes are rising or recovering. Tighten if inflation moves above 5%, if unit labor costs accelerate, or if long-run expectations move outside the thresholds described in Section 14.
4. Supply-side complements. Monetary policy is not the only lever. Permitting reform, zoning that allows apartments near jobs and transit, and tax provisions such as those in the One Big Beautiful Bill Act (OBBBA) affect how quickly supply responds. The faster supply responds, the less work the Fed has to do.
Fallback position. If the Fed will not make the full move, the minimum is clear: no further hikes into a fading supply shock, and a prompt cut of at least ~75 bp, to 3.00%–3.25%, which brings policy back to roughly the Fed's own 3.2% neutral estimate.
16. Why It Matters for Real Estate and Development
For developers and the investors who back them, the Fed's path is not an abstraction. It sets the cost of construction financing, the rate on the permanent loan that replaces it and the valuation at which a completed community is measured. A project started today delivers in 2028 or 2029, into whatever market the next two years of policy create.

The evidence in this paper points to four practical conclusions. First, supply is the durable cure for high rents and high home prices, and the current pipeline is shrinking: completions are forecast to bottom in 2027, roughly 35% below the 2024 peak. Second, the markets that keep building, as Austin shows, are the ones where rents moderate without job losses. Third, predictability matters as much as the level of rates. A Fed that sets a clear path and holds to it lets well-capitalized developers plan, finance and deliver the units the country needs. Fourth, real estate is one of the legs a balanced economy stands on. Apartment construction buys materials, employs trades and supports the local businesses around each new community. An economy that keeps building housing while the AI buildout continues is sturdier than one that leans on the AI buildout alone.
The order of markets matters, too. Nationally, apartment rents are roughly flat after the supply wave. In Houston and DFW, two of the nation's largest markets for new apartment deliveries, rents were up only modestly over the year to October, and the next wave of new supply is thinning. A policy that restrains construction now risks tighter markets in 2028 and beyond, the period in which today's starts would deliver.
Healthy inflation is rising pay, steady jobs and a predictable Fed, not 2% at any cost. Healthy growth stands on more than one leg. One decisive cut of 150–200 bp, a stated hold and a published tolerance range would let the supply shock fade, restart the sectors that build America's housing and employ its small businesses, and give the whole economy, not just its fastest-growing corner, a horizon it can plan around.
Frequently asked questions
What do "the mosquito" and "the sledgehammer" stand for?
The mosquito is the gap between ~2.5% and 2% inflation. The sledgehammer is restrictive policy aimed at the sectors that build supply and broaden income growth: rate hikes do not reach energy prices or the AI buildout, but they break housing, real estate and small business.
What does the paper recommend the Fed do?
One decisive cut of 150–200 bp, as soon as possible, taking the target range to ~1.75%–2.50%; a stated hold with the conditions for changing course spelled out; a published tranche framework with tripwires; and supply-side complements such as permitting and zoning reform.
What are the inflation tranches?
Keep 2% as the long-run anchor, treat 2%–3.5% as normal, tolerate 3.5%–5% during supply shocks only while jobs are strong and real incomes are rising or recovering, and tighten above 5% or if expectations loosen.
Why are rate hikes the wrong tool for the 2026 overshoot?
The overshoot comes mostly from relative-price shocks, not an overheated labor market. Vice Chair for Supervision Michelle Bowman estimates that tariffs, energy and AI-related price pressures each account for roughly one-fourth of above-target core inflation, and quarterly PCE inflation has already slowed to a 2.1% annual rate.
Which parts of the economy are hurt most by higher rates?
Housing, real estate and small business, the sectors that run on borrowed money and reprice quickly. Builder sentiment is at its lowest since 2012 and residential construction employment has declined year over year for 20 straight months, while AI investment is largely insulated from rates.
Wouldn't holding rates near 2% reignite inflation?
The cut is stimulative by design, but its stimulus lands first on floating-rate borrowers in sectors that are contracting, not overheating. The hold is conditional: it ends if inflation breaks above the tranche ceiling, if unit labor costs accelerate or if long-run expectations move past the paper's thresholds.
Sources
- Federal Reserve Board, "Federal Reserve issues FOMC statement," Oct. 28, 2026. https://www.federalreserve.gov/newsevents/pressreleases/monetary20261028a.htm ↩
- Federal Reserve Board, Summary of Economic Projections, Sept. 16, 2026. https://www.federalreserve.gov/monetarypolicy/fomcprojtabl20260916.htm ↩
- U.S. Bureau of Economic Analysis, PCE Price Index (PCEPI) and PCE Excluding Food and Energy (PCEPILFE), via FRED, Federal Reserve Bank of St. Louis. https://fred.stlouisfed.org/series/PCEPI ↩
- Michelle W. Bowman, Vice Chair for Supervision, "The U.S. Economy and Considerations for Monetary Policy," speech at the Council on Foreign Relations, Nov. 10, 2026. https://www.federalreserve.gov/newsevents/speech/bowman20261110a.htm ↩
- U.S. Bureau of Economic Analysis, "GDP (Advance Estimate), 3rd Quarter 2026," Oct. 29, 2026. https://www.bea.gov/news/2026/gdp-advance-estimate-3rd-quarter-2026 ↩
- NAHB Eye on Housing, "Hiring Rebounds in October, but Residential Construction Employment Declines," Nov. 6, 2026. https://eyeonhousing.org/2026/11/hiring-rebounds-in-october-but-residential-construction-employment-declines/ ↩
- Fortune, "Without data centers, GDP growth was 0.1% in the first half of 2025, Harvard economist says," Oct. 7, 2025 (Jason Furman). https://fortune.com/2025/10/07/data-centers-gdp-growth-zero-first-half-2025-jason-furman-harvard-economist/ ↩
- Institute for Supply Management, Manufacturing PMI Report, October 2026, Nov. 2, 2026. https://www.ismworld.org/supply-management-news-and-reports/reports/ism-pmi-reports/pmi/october/ ↩
- Dias, D. and J. Duarte, "Monetary Policy, Housing Rents, and Inflation Dynamics," Journal of Applied Econometrics 34(5), 2019. ↩
- Yardi Matrix, "Yardi Matrix increases multifamily housing completion estimate for 2026," Nov. 11, 2026; CRE Daily, "Multifamily Supply Falls 22% in 2026, Bottoms in 2027," Nov. 11, 2026. https://www.credaily.com/briefs/multifamily-supply-falls-22-in-2026-bottoms-in-2027/ ↩
- Gulen, H. and M. Ion, "Policy Uncertainty and Corporate Investment," Review of Financial Studies 29(3), 2016. ↩
- CBS News, "Inflation held steady in February before Iran war drove up gas prices, CPI report shows," March 2026. ↩
- CNBC, "Market spooked because now the Fed may need a supersized hike in December," Nov. 10, 2026 (citing CME FedWatch). https://www.cnbc.com/2026/11/10/market-spooked-because-now-the-fed-may-need-a-supersized-hike-in-december.html ↩
- U.S. Bureau of Economic Analysis, PCE Price Index (PCEPI) and PCE Excluding Food and Energy (PCEPILFE); see note 3. ↩
- Freddie Mac, Primary Mortgage Market Survey, Nov. 12, 2026, and weekly series (MORTGAGE30US) via FRED. https://www.freddiemac.com/pmms ↩
- National Association of Home Builders, "Builder Sentiment Falls on Rising Rates," NAHB/Wells Fargo Housing Market Index, Oct. 2026. https://www.nahb.org/news-and-economics/press-releases/2026/10/builder-sentiment-falls-on-rising-rates ↩
- Federal Reserve Board, Summary of Economic Projections; see note 2. ↩
- Board of Governors of the Federal Reserve System, Federal Funds Target Range, Upper and Lower Limits (DFEDTARU, DFEDTARL), via FRED, Federal Reserve Bank of St. Louis. https://fred.stlouisfed.org/series/DFEDTARU ↩
- Board of Governors, 2-year Treasury yield (DGS2), and Federal Reserve Bank of New York, SOFR, via FRED. https://fred.stlouisfed.org/series/DGS2 ↩
- Cecchetti, S. and K. Schoenholtz, "Is 2 Percent Still the Solution?" Money, Banking and Financial Markets, Sept. 3, 2024 (summarizing Kiley, M. and J. Roberts, "Monetary Policy in a Low Interest Rate World," Brookings Papers on Economic Activity, Spring 2017). ↩
- Kevin Warsh, "In Our Time," keynote address, Federal Reserve Bank of Kansas City Economic Policy Symposium, Jackson Hole, Aug. 28, 2026. https://www.federalreserve.gov/newsevents/speech/warsh20260828a.htm ↩
- Cecchetti, S. and K. Schoenholtz, "Is 2 Percent Still the Solution?"; see note 20. ↩
- Boskin, M. et al., "Toward a More Accurate Measure of the Cost of Living," Final Report to the Senate Finance Committee, Dec. 1996. ↩
- Stantcheva, S., "Why Do We Dislike Inflation?" Brookings Papers on Economic Activity, Spring 2024. ↩
- Federal Reserve Board, Statement on Longer-Run Goals and Monetary Policy Strategy, Jan. 25, 2012. ↩
- Federal Reserve Board, Statement on Longer-Run Goals and Monetary Policy Strategy, as amended Aug. 27, 2020. ↩
- Federal Reserve Board, Statement on Longer-Run Goals and Monetary Policy Strategy, as amended Aug. 22, 2025. ↩
- Reserve Bank of New Zealand, "History of the Remit and Policy Targets Agreement". https://www.rbnz.govt.nz ↩
- Neil Irwin, "Of Kiwis and Currencies: How a 2% Inflation Target Became Global Economic Gospel," The New York Times, Dec. 19, 2014. ↩
- U.S. Bureau of Economic Analysis, PCE Price Index (PCEPI) and PCE Excluding Food and Energy (PCEPILFE); see note 3. ↩
- U.S. Bureau of Labor Statistics, Consumer Price Index for All Urban Consumers, not seasonally adjusted (CPIAUCNS), 1913–2026, via FRED, Federal Reserve Bank of St. Louis. https://fred.stlouisfed.org/series/CPIAUCNS ↩
- Lebow, D. and J. Rudd, "Measurement Error in the Consumer Price Index: Where Do We Stand?" Journal of Economic Literature 41(1), 2003. ↩
- Federal Reserve Board, Summary of Economic Projections; see note 2. ↩
- Havránek, T. and M. Rusnák, "Transmission Lags of Monetary Policy: A Meta-Analysis," International Journal of Central Banking 9(4), Dec. 2013. https://www.ijcb.org/journal/v9n4/transmission-lags-monetary-policy-meta-analysis ↩
- Adams, B., L. Loewenstein, H. Montag and R. Verbrugge, "Disentangling Rent Index Differences," Federal Reserve Bank of Cleveland Working Paper 22-38, Dec. 2022. https://www.clevelandfed.org/publications/working-paper/2022/wp-2238-disentangling-rent-index-differences ↩
- CBS News, "Inflation held steady in February before Iran war drove up gas prices, CPI report shows"; see note 12. ↩
- Federal Reserve Board, Summary of Economic Projections; see note 2. ↩
- Reserve Bank of Australia, Statement on the Conduct of Monetary Policy, July 10, 2025. ↩
- Central Bank of Iceland, Statement of the Monetary Policy Committee, May 16, 2018 (2.5% inflation target, adopted 2001). ↩
- Norwegian Ministry of Finance, "New regulation on monetary policy," Mar. 2, 2018. ↩
- Bank of Canada and Government of Canada, Joint Statement on the Renewal of the Monetary Policy Framework, Nov. 2026. ↩
- Ball, L., "The Case for a Long-Run Inflation Target of Four Percent," IMF Working Paper 14/92, 2014. ↩
- Cecchetti, S. and K. Schoenholtz, "Is 2 Percent Still the Solution?"; see note 20. ↩
- Ball, L., "What Determines the Sacrifice Ratio?" in N. G. Mankiw (ed.), Monetary Policy, University of Chicago Press for NBER, 1994. ↩
- Bernanke, B. and O. Blanchard, "What Caused the U.S. Pandemic-Era Inflation?" American Economic Journal: Macroeconomics, 2025 (NBER Working Paper 31417, 2023). ↩
- Nakamura, E., J. Steinsson, P. Sun and D. Villar, "The Elusive Costs of Inflation: Price Dispersion during the U.S. Great Inflation," Quarterly Journal of Economics 133(4), 2018. ↩
- Akerlof, G., W. Dickens and G. Perry, "The Macroeconomics of Low Inflation," Brookings Papers on Economic Activity 1996(1). ↩
- Sarel, M., "Nonlinear Effects of Inflation on Economic Growth," IMF Staff Papers 43(1), 1996. ↩
- Bruno, M. and W. Easterly, "Inflation Crises and Long-Run Growth," Journal of Monetary Economics 41(1), 1998. ↩
- Khan, M. and A. Senhadji, "Threshold Effects in the Relationship Between Inflation and Growth," IMF Staff Papers 48(1), 2001. ↩
- U.S. Bureau of Economic Analysis, "GDP (Advance Estimate), 3rd Quarter 2026"; see note 5. ↩
- U.S. Bureau of Labor Statistics, Employment Situation (PAYEMS, UNRATE, CES0500000003, AHETPI) and CPI-U (CPIAUCSL), via FRED. https://fred.stlouisfed.org/series/CES0500000003 ↩
- Orphanides, A. and D. Wilcox, "The Opportunistic Approach to Disinflation," International Finance 5(1), 2002. ↩
- U.S. Bureau of Labor Statistics, Employment Situation (PAYEMS, UNRATE, CES0500000003, AHETPI) and CPI-U (CPIAUCSL); see note 52. ↩
- U.S. Bureau of Economic Analysis, "GDP (Advance Estimate), 3rd Quarter 2026"; see note 5. ↩
- U.S. Bureau of Labor Statistics, Productivity and Costs: nonfarm business labor productivity (OPHNFB) and unit labor costs (ULCNFB), via FRED. https://fred.stlouisfed.org/series/ULCNFB ↩
- Federal Reserve Board, "Federal Reserve issues FOMC statement"; see note 1. ↩
- Kliesen, K. and D. Wheelock, "Guiding Monetary Policy during a Productivity Boom: Evidence from the 1990s," Federal Reserve Bank of St. Louis, On the Economy, July 13, 2026. https://www.stlouisfed.org/on-the-economy/2026/jul/guiding-monetary-policy-productivity-boom-evidence-1990s ↩
- U.S. Bureau of Labor Statistics, Employment Situation (PAYEMS, UNRATE, CES0500000003, AHETPI) and CPI-U (CPIAUCSL); see note 52. ↩
- U.S. Bureau of Labor Statistics, Employment Situation (PAYEMS, UNRATE, CES0500000003, AHETPI) and CPI-U (CPIAUCSL); see note 52. ↩
- U.S. Bureau of Economic Analysis, PCE Price Index (PCEPI) and PCE Excluding Food and Energy (PCEPILFE); see note 3. ↩
- Bernanke, B. and O. Blanchard, "What Caused the U.S. Pandemic-Era Inflation?"; see note 45. ↩
- Michelle W. Bowman, Vice Chair for Supervision, "The U.S. Economy and Considerations for Monetary Policy"; see note 4. ↩
- U.S. Bureau of Economic Analysis, "GDP (Advance Estimate), 3rd Quarter 2026"; see note 5. ↩
- Michelle W. Bowman, Vice Chair for Supervision, "The U.S. Economy and Considerations for Monetary Policy"; see note 4. ↩
- University of Michigan, Surveys of Consumers, preliminary November 2026. https://www.sca.isr.umich.edu/ ↩
- Holland & Knight, "IEEPA Tariff Refund Update: Government Appeals CIT Refund Order and the Road Ahead for Importers," June 2026 (on Learning Resources v. United States, Feb. 2026); Reuters, "US refunds $100 billion in tariffs struck down by Supreme Court, filing shows," Aug. 5, 2026. https://www.reuters.com/legal/government/us-refunds-100-billion-tariffs-struck-down-by-supreme-court-filing-shows-2026-08-05/ ↩
- Bernanke, B., M. Gertler and M. Watson, "Systematic Monetary Policy and the Effects of Oil Price Shocks," Brookings Papers on Economic Activity 1997(1). ↩
- Bloomberg, "ECB's 2008 Rate Hike Revisited: The Crisis It Didn't See Coming," July 3, 2018; European Central Bank, monetary policy decisions, 2008 and 2011. ↩
- European Central Bank, "Monetary policy decisions," Sept. 10, 2026; Euronews, "ECB hikes rates to 2.5% as energy shock pushes eurozone inflation higher," Sept. 10, 2026. https://www.ecb.europa.eu/press/pr/date/2026/html/ecb.mp260910~314e508016.en.html ↩
- Bank of England, Monetary Policy Report, November 2026; Bank of Canada, interest rate announcement, Oct. 28, 2026. https://www.bankofengland.co.uk/monetary-policy-report/2026/November-2026 ↩
- Bank for International Settlements, Annual Economic Report 2026, Chapter I. https://www.bis.org/publ/arpdf/ar2026e1.htm ↩
- Kilian, L., M. Plante, A. Richter and X. Zhou, "Implications of the Iran war for U.S. inflation," Federal Reserve Bank of Dallas, Apr. 17, 2026. https://www.dallasfed.org/research/economics/2026/0417 ↩
- Philip N. Jefferson, Vice Chair, "Navigating Economic Shocks," speech at the Stanford Institute for Economic Policy Research, July 16, 2026. https://www.federalreserve.gov/newsevents/speech/jefferson20260716a.htm ↩
- Al Jazeera, "US Treasury warns against rate hikes during US-Iran war energy 'shock'," Nov. 13, 2026 (citing CME FedWatch). https://www.aljazeera.com/economy/2026/11/13/us-treasury-warns-against-rate-hikes-during-us-iran-war-energy-shock ↩
- Michelle W. Bowman, Vice Chair for Supervision, "The U.S. Economy and Considerations for Monetary Policy"; see note 4. ↩
- Aoki, K., "Optimal Monetary Policy Responses to Relative-Price Changes," Journal of Monetary Economics 48(1), 2001, 55–80. https://doi.org/10.1016/S0304-3932(01)00069-1 ↩
- Rubbo, E., "Networks, Phillips Curves, and Monetary Policy," Econometrica 91(4), 2023, 1417–1455. https://doi.org/10.3982/ECTA18654 ↩
- Guerrieri, V., G. Lorenzoni, L. Straub and I. Werning, "Monetary Policy in Times of Structural Reallocation," Federal Reserve Bank of Kansas City Economic Policy Symposium, Jackson Hole, Aug. 2021. https://doi.org/10.2139/ssrn.3924566 ↩
- U.S. Bureau of Economic Analysis, "GDP (Advance Estimate), 3rd Quarter 2026"; see note 5. ↩
- U.S. Bureau of Economic Analysis, NIPA real and nominal investment series (Y034RC1Q027SBEA, B985RC1Q027SBEA, Y034RX1Q020SBEA, B985RX1Q020SBEA, PRFIC1, GDP), via FRED. https://fred.stlouisfed.org/series/PRFIC1 ↩
- U.S. Bureau of Economic Analysis, NIPA real and nominal investment series (Y034RC1Q027SBEA, B985RC1Q027SBEA, Y034RX1Q020SBEA, B985RX1Q020SBEA, PRFIC1, GDP); see note 81. ↩
- Kevin Warsh, "In Our Time"; see note 21. ↩
- Gertler, M. and S. Gilchrist, "Monetary Policy, Business Cycles, and the Behavior of Small Manufacturing Firms," Quarterly Journal of Economics 109(2), 1994, 309–340. https://doi.org/10.2307/2118465 ↩
- Coibion, O., Y. Gorodnichenko, L. Kueng and J. Silvia, "Innocent Bystanders? Monetary Policy and Inequality," Journal of Monetary Economics 88, 2017, 70–89. https://doi.org/10.1016/j.jmoneco.2017.05.005 ↩
- Federal Reserve Banks, Small Business Credit Survey, "2026 Report on Employer Firms: Findings from the 2025 Small Business Credit Survey". https://www.fedsmallbusiness.org/2026-report-on-employer-firms ↩
- NFIB, Small Business Economic Trends, October 2026. https://www.nfib.com/news/press-release/new-nfib-survey-main-street-optimism-remains-steady-uncertainty-declines-in-october/ ↩
- NAHB Eye on Housing, "Hiring Rebounds in October, but Residential Construction Employment Declines"; see note 6. ↩
- Associated General Contractors of America, "Construction Employment Stalls as Pool of Unemployed Workers Dries Up in October," Nov. 6, 2026; Associated Builders and Contractors, "Nonresidential Construction Employment Added 13,300 Jobs in October," Nov. 6, 2026. https://www.agc.org/news/2026/11/06/construction-employment-stalls-pool-unemployed-workers-dries-october-despite-sharp-rise-wages ↩
- Federal Reserve Board, Senior Loan Officer Opinion Survey on Bank Lending Practices, October 2026. https://www.federalreserve.gov/data/sloos/sloos-202610.htm ↩
- Federal Reserve Bank of New York, Quarterly Report on Household Debt and Credit, Q3 2026, Nov. 10, 2026. https://www.newyorkfed.org/newsevents/news/research/2026/20261110 ↩
- Fortune, "Without data centers, GDP growth was 0.1% in the first half of 2025, Harvard economist says"; see note 7. ↩
- Institute for Supply Management, Manufacturing PMI Report; see note 8. ↩
- Office of the Texas Governor, "Governor Abbott Directs Comprehensive Data Center Audit," 2026; Gibson Dunn, "Texas Data Center Critical Dates and Procedures Following the 2026 Elections," Nov. 2026. https://gov.texas.gov/news/post/governor-abbott-directs-comprehensive-data-center-audit ↩
- Ballotpedia News, "Voters favored limiting data center development in 40 of 41 local ballot measures on Nov. 3," Nov. 6, 2026. https://news.ballotpedia.org/2026/11/06/voters-favored-limiting-data-center-development-in-40-of-41-local-ballot-measures-on-nov-3/ ↩
- Ballotpedia News, update on 2026 local data-center ballot measures, Nov. 15, 2026. https://news.ballotpedia.org/?p=52614 ↩
- Insurance Journal (Bloomberg), "Some 40% of Planned Data Center Capacity Is in States Wanting to Hit Pause," Nov. 6, 2026. https://www.insurancejournal.com/news/southcentral/2026/11/06/891870.htm ↩
- U.S. Census Bureau and HUD, New Residential Construction: multifamily (5+ units) starts (HOUST5F) and completions (COMPU5MUSA), via FRED. https://fred.stlouisfed.org/series/HOUST5F ↩
- Apartment List, National Rent Report, November 2026. https://www.apartmentlist.com/research/national-rent-data ↩
- Zillow Research, Zillow Observed Rent Index (ZORI), smoothed, national and metro; BLS CPI shelter (CUSR0000SAH1) via FRED. https://www.zillow.com/research/data/ ↩
- Zillow Research, Zillow Observed Rent Index (ZORI); see note 100. ↩
- U.S. Bureau of Labor Statistics, Consumer Price Index, October 2026, Table 1 (relative importance, September 2026). https://www.bls.gov/news.release/cpi.t01.htm ↩
- Chodorow-Reich, G. and N. Mehrotra, "Housing Policy, Inflation, and Monetary Policy: An Unorthodox View," Brookings Institution, Feb. 2026. https://www.brookings.edu/wp-content/uploads/2026/02/20260206_ES_SupplySideInflationPapers_ChodorowReichMehrotra.pdf ↩
- Dias, D. and J. Duarte, "Monetary Policy, Housing Rents, and Inflation Dynamics"; see note 9. ↩
- Batzer, R., J. Coste, W. Doerner and M. Seiler, "The Lock-In Effect of Rising Mortgage Rates," FHFA Staff Working Paper 24-03, revised Aug. 2024. https://www.fhfa.gov/research/papers/wp2403 ↩
- Fonseca, J., L. Liu and P. Mabille, "Unlocking Mortgage Lock-In: Equilibrium Effects in a Spatial Housing Ladder Model," NBER Working Paper 35237, 2026. https://www.nber.org/papers/w35237 ↩
- Barth, M. and V. Ramey, "The Cost Channel of Monetary Transmission," NBER Macroeconomics Annual 16, 2001. https://www.nber.org/papers/w7675 ↩
- Gaiotti, E. and A. Secchi, "Is There a Cost Channel of Monetary Policy Transmission? An Investigation into the Pricing Behavior of 2,000 Firms," Journal of Money, Credit and Banking 38(8), 2006, 2013–2037. https://doi.org/10.1353/mcb.2007.0002 ↩
- Clifford, L., S. Rodnyansky and D. Su, "Austin's Surge of New Housing Construction Drove Down Rents," The Pew Charitable Trusts, Mar. 18, 2026. https://www.pew.org/en/research-and-analysis/articles/2026/03/18/austins-surge-of-new-housing-construction-drove-down-rents ↩
- Asquith, B., E. Mast and D. Reed, "Local Effects of Large New Apartment Buildings in Low-Income Areas," Review of Economics and Statistics 105(2), 2023. ↩
- Mast, E., "JUE Insight: The Effect of New Market-Rate Housing Construction on the Low-Income Housing Market," Journal of Urban Economics 133, 2023. ↩
- Li, X., "Do New Housing Units in Your Backyard Raise Your Rents?" Journal of Economic Geography 22(6), 2022, 1309–1352. https://doi.org/10.1093/jeg/lbab034 ↩
- Clifford, L., S. Rodnyansky and D. Su, "Austin's Surge of New Housing Construction Drove Down Rents"; see note 109. ↩
- Yardi Matrix, "Yardi Matrix increases multifamily housing completion estimate for 2026"; see note 10. ↩
- Yardi Matrix, "Yardi Matrix increases multifamily housing completion estimate for 2026"; see note 10. ↩
- U.S. Census Bureau and HUD, New Residential Construction: multifamily (5+ units) starts (HOUST5F) and completions (COMPU5MUSA); see note 98. ↩
- Freddie Mac, Economic and Housing Research, estimate of the U.S. housing shortage (~3.7 million units), 2024. ↩
- Leamer, E., "Housing IS the Business Cycle," in Housing, Housing Finance, and Monetary Policy, Federal Reserve Bank of Kansas City, 2007. ↩
- Baker, S., N. Bloom and S. Davis, Economic Policy Uncertainty Index, monetary policy category (EPUMONETARY), policyuncertainty.com and FRED. https://fred.stlouisfed.org/series/EPUMONETARY ↩
- Board of Governors, 2-year Treasury yield (DGS2), and Federal Reserve Bank of New York, SOFR; see note 19. ↩
- Bloom, N., "The Impact of Uncertainty Shocks," Econometrica 77(3), 2009. ↩
- Baker, S., N. Bloom and S. Davis, "Measuring Economic Policy Uncertainty," Quarterly Journal of Economics 131(4), 2016. ↩
- Gulen, H. and M. Ion, "Policy Uncertainty and Corporate Investment"; see note 11. ↩
- Husted, L., J. Rogers and B. Sun, "Monetary Policy Uncertainty," Journal of Monetary Economics 115, 2020. ↩
- Dixit, A. and R. Pindyck, Investment under Uncertainty, Princeton University Press, 1994; Titman, S., "Urban Land Prices Under Uncertainty," American Economic Review 75(3), 1985. ↩
- U.S. Census Bureau, Survey of Construction, length of time from authorization to completion, 2025, as summarized by NAHB Eye on Housing, Sept. 2026. ↩
- Board of Governors, 2-year Treasury yield (DGS2), and Federal Reserve Bank of New York, SOFR; see note 19. ↩
- Federal Reserve Bank of Richmond, The CFO Survey (Duke University Fuqua School of Business and the Federal Reserve Banks of Richmond and Atlanta), third quarter 2026, Sept. 2026. ↩
- Campbell, J., C. Evans, J. Fisher and A. Justiniano, "Macroeconomic Effects of Federal Reserve Forward Guidance," Brookings Papers on Economic Activity, Spring 2012; Swanson, E., "Measuring the Effects of Federal Reserve Forward Guidance and Asset Purchases on Financial Markets," Journal of Monetary Economics 118, 2021. ↩
- Husted, L., J. Rogers and B. Sun, "Monetary Policy Uncertainty"; see note 124. ↩
- Michelle W. Bowman, Vice Chair for Supervision, "The U.S. Economy and Considerations for Monetary Policy"; see note 4. ↩
- U.S. Bureau of Labor Statistics, Consumer Price Index, October 2026; 12-month changes were not published because October 2025 prices were not collected during the 2025 lapse in appropriations. https://www.bls.gov/news.release/cpi.nr0.htm ↩
- Al Jazeera, "US Treasury warns against rate hikes during US-Iran war energy 'shock'"; see note 75. ↩
- U.S. Bureau of Economic Analysis, "GDP (Advance Estimate), 3rd Quarter 2026"; see note 5. ↩
- Federal Reserve Board, Summary of Economic Projections; see note 2. ↩
- Federal Reserve Bank of Cleveland, 1-Year Expected Inflation (EXPINF1YR), via FRED. https://fred.stlouisfed.org/series/EXPINF1YR ↩
- Institute for Supply Management, Manufacturing PMI Report; see note 8. ↩
- U.S. Bureau of Economic Analysis, "GDP (Advance Estimate), 3rd Quarter 2026"; see note 5. ↩
- Yardi Matrix, "Yardi Matrix increases multifamily housing completion estimate for 2026"; see note 10. ↩
- Federal Reserve Bank of St. Louis, 10-Year Breakeven Inflation Rate (T10YIE); Board of Governors, 10-Year Treasury Constant Maturity (DGS10) and 10-Year TIPS (DFII10), via FRED. https://fred.stlouisfed.org/series/T10YIE ↩
- Board of Governors of the Federal Reserve System, M2 Money Stock (M2SL) and Total Assets of the Federal Reserve (WALCL), via FRED, Federal Reserve Bank of St. Louis. https://fred.stlouisfed.org/series/M2SL ↩
- Board of Governors of the Federal Reserve System, M2 Money Stock (M2SL) and Total Assets of the Federal Reserve (WALCL); see note 141. ↩
- Federal Reserve Board, FEDS Notes, "The Effect of Oil Prices on Core Inflation: Recent Evidence from the Advanced Economies," Nov. 9, 2026. https://www.federalreserve.gov/econres/notes/feds-notes/the-effect-of-oil-prices-on-core-inflation-recent-evidence-from-the-advanced-economies-20261109.html ↩
- University of Michigan, Surveys of Consumers; see note 66. ↩
- OMFIF, "Austan Goolsbee on why looking through shocks no longer works," Sept. 29, 2026; Beth M. Hammack, "Trimming the Sails: Communicating My Reaction Function," Federal Reserve Bank of Cleveland, Oct. 12, 2026. https://www.omfif.org/2026/09/austan-goolsbee-on-why-looking-through-shocks-no-longer-works/ ↩
- Kilian, L. and L. Lewis, "Does the Fed Respond to Oil Price Shocks?" Economic Journal 121(555), 2011. ↩
- Blinder, A., "Landings, Soft and Hard: The Federal Reserve, 1965–2022," Journal of Economic Perspectives 37(1), 2023. ↩
- Board of Governors, 10-year Treasury yield (DGS10), and Freddie Mac PMMS (MORTGAGE30US), via FRED. https://fred.stlouisfed.org/series/DGS10 ↩
- Federal Reserve Bank of St. Louis, 10-Year Breakeven Inflation Rate (T10YIE); Board of Governors; see note 140. ↩
- Laubach, T., "New Evidence on the Interest Rate Effects of Budget Deficits and Debt," Journal of the European Economic Association 7(4), 2009. https://doi.org/10.1162/JEEA.2009.7.4.858 ↩
- Michelle W. Bowman, Vice Chair for Supervision, "The U.S. Economy and Considerations for Monetary Policy"; see note 4. ↩
- Associated General Contractors of America, "Construction Employment Stalls as Pool of Unemployed Workers Dries Up in October," Nov. 6, 2026. https://www.agc.org/news/2026/11/06/construction-employment-stalls-pool-unemployed-workers-dries-october-despite-sharp-rise-wages ↩
- Federal Reserve Bank of New York, "Measuring the Natural Rate of Interest," Holston-Laubach-Williams and Laubach-Williams current estimates, Aug. 27, 2026 release (data through Q2 2026). https://www.newyorkfed.org/research/policy/rstar ↩
- Congressional Budget Office, Monthly Budget Review, fiscal year 2026, Oct. 2026. ↩
- Federal Reserve Board, Summary of Economic Projections, longer-run federal funds rate median (FEDTARMDLR), Dec. 13, 2023, and Sept. 16, 2026, via FRED. https://fred.stlouisfed.org/series/FEDTARMDLR ↩
- Federal Reserve Bank of New York, "Measuring the Natural Rate of Interest"; see note 153. ↩
- Board of Governors of the Federal Reserve System, Federal Funds Target Rate (DFEDTAR, through Dec. 2008) and Target Range Upper Limit (DFEDTARU), via FRED, Federal Reserve Bank of St. Louis. https://fred.stlouisfed.org/series/DFEDTAR ↩
- Federal Reserve Bank of Cleveland, Simple Monetary Policy Rules, update of Sept. 3, 2026. https://www.clevelandfed.org/our-research/indicators-and-data/simple-monetary-policy-rules/ ↩
Important disclosures
This white paper is provided for informational and educational purposes only. It is commentary on economic and monetary policy and reflects the opinions of its author. It is not investment, tax, legal or accounting advice, and it is not an offer to sell or a solicitation of an offer to buy any security.