
Key takeaways
- In Texas, two expense lines can move the result almost as much: property insurance and property taxes.
- Apartment owners in Dallas and Fort Worth spend ~16% of their income on property taxes, versus a national median of 8.8%, and Houston communities pay roughly 1.6 times the national average for property insurance.
- Newer Class A communities have generally fared much better on insurance than older Class B and C buildings.
- Insurance costs have eased since 2024, and the state has cut school tax rates by more than a third since 2018, but most of the relief aimed at homeowners does not reach apartments.
- New construction carries higher tax bills because it is worth more, yet it avoids many of the repair surprises of older stock.
The setup in one paragraph
An apartment community's net operating income (NOI) is what is left after operating expenses are paid from rent and other income. Nationally, the National Apartment Association estimates that property taxes were the single largest operating expense in 2025, at 10 cents of every rent dollar, compared with 7 cents for payroll.1 Insurance has been the fastest-growing line for nearly a decade: Yardi Matrix data compiled by the National Multifamily Housing Council (NMHC) show insurance costs per unit up 152.6% from the second quarter of 2017 to the second quarter of 2026, compared with 29.6% for real estate taxes.2 Texas adds two features that make these lines larger than in most states: the state has no personal income tax, so local governments rely heavily on property taxes, and the Gulf Coast and North Texas face some of the country's most frequent wind, hail, flood and freeze losses. The sections below take each line in turn, then look at why a new community can have an advantage over older properties.
How much of apartment revenue goes to taxes and insurance
Yardi Matrix's financial benchmarking data for the 12 months ending July 2026 show that the typical market-rate apartment property nationally devoted 8.8% of its total income to property taxes. In Dallas the figure was 15.9%, and in Fort Worth 15.6%, among the highest of the markets in the release; Austin was higher still at 18.1%.3 On insurance, CRED iQ's analysis of apartment properties with securitized loans found that Texas properties spent $5.37 on insurance for every $100 of revenue in 2025, compared with $4.02 nationally, up from $2.92 and $2.39 in 2019.4
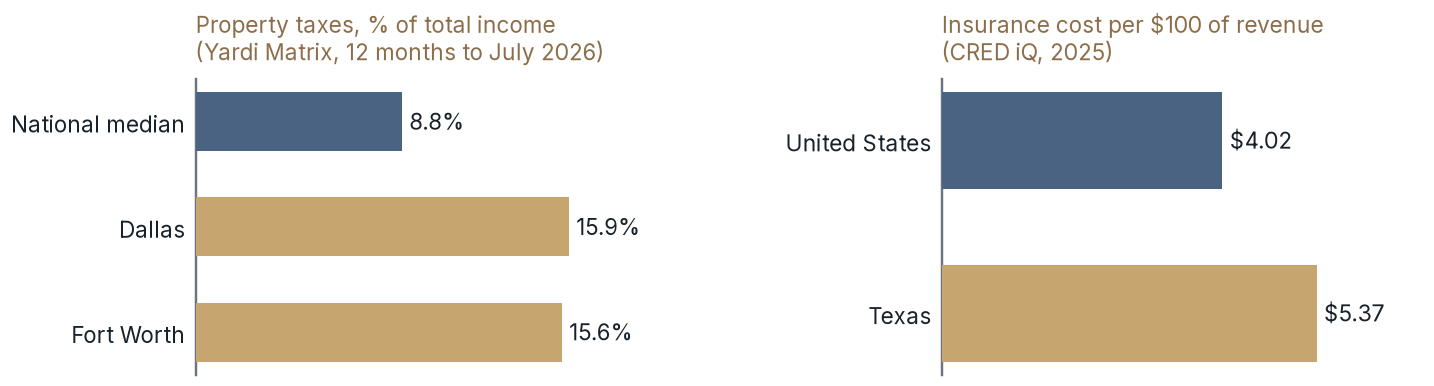
Chart Summary and Key Values
Bar charts comparing property tax and insurance shares of apartment revenue
Source (left): Yardi Matrix Financial Benchmarking data, via the National Apartment Association; Houston was not reported separately. Source (right): CRED iQ.
Combining Yardi's tax share for Dallas with CRED iQ's Texas insurance ratio, which come from different samples, gives a rough estimate that taxes and insurance take about a fifth of every revenue dollar for a typical Dallas-Fort Worth community, compared with about one-eighth nationally. That is why a small percentage change in either line can matter as much to a Texas investor as a change in rents. A 10% increase in property taxes for a Dallas community is roughly equivalent to giving up a 1.6% rent increase, before considering any other cost.
Insurance: the fastest-growing line
The most detailed public look at apartment insurance comes from a Federal Reserve Board study of operating statements for properties with loans in commercial mortgage-backed securities (CMBS), compiled by Trepp. Adjusted for inflation, the average monthly insurance cost per unit rose from ~$39 in 2019 to ~$68 in 2024, an increase of more than 75%, after several years of roughly flat inflation-adjusted costs.5
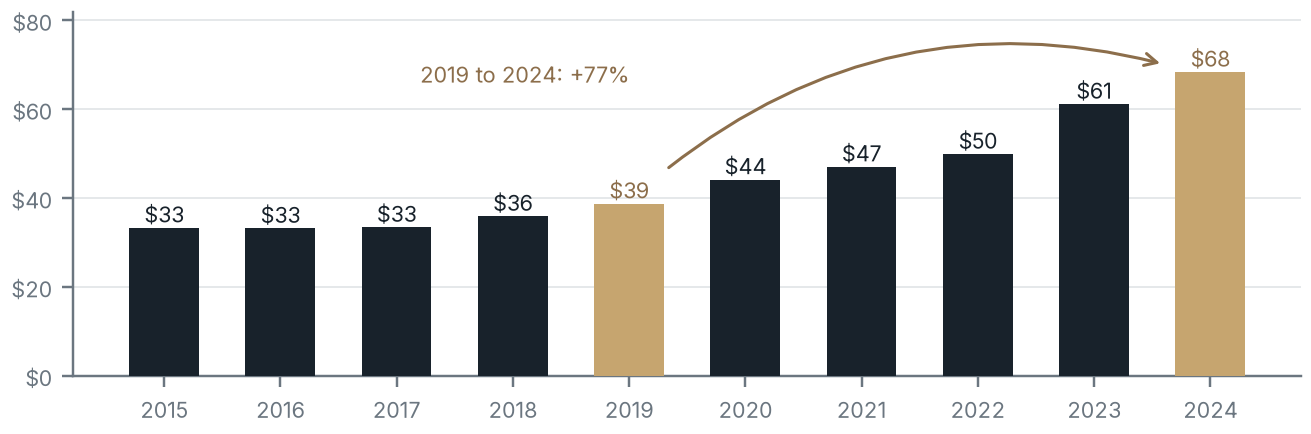
Chart Summary and Key Values
Bar chart of national apartment insurance cost per unit, 2015 to 2024
Source: Federal Reserve Board, FEDS Notes, September 2025, using Trepp loan-level data.
Building class matters too. Most Class A apartments are relatively new, and insurers generally price newer buildings far more favorably than the older stock that makes up much of the Class B and C market. Data from the insurance analytics firm Advocate Technologies show Houston apartments built in 2000 or later priced ~26% below the national average for multifamily, while stock built before 1980 priced ~1.4 times the national average.6 One Houston insurance broker told Bisnow that only about 10% of the carriers his agency works with will consider multifamily buildings built before 1980.6 Across a broader national sample of loan data, Berkadia found that Class C properties carried higher and more volatile operating expenses than Class A properties, with average expense ratios of 49% compared with 42%.7
The same study found that a dollar of higher insurance cost reduced owners' net income by ~72 cents.5 It found little relationship between average changes in insurance costs and changes in asking rents, and no evidence that landlords offset rising insurance costs by cutting other expenses.5 Its authors estimated that the insurance increase since 2019 added only $7 to $12 a month to the average tenant's rent, less than 1% of average rent. Studies differ on how much of the increase reaches renters: a 2025 University of Texas at Dallas working paper on commercial properties estimated that about two-thirds of insurance increases, 67% on average, pass through to rents.8
Houston pays the most of the large Texas metros
The Fed study also reports costs by metro area. In 2024, the average monthly insurance cost per unit was $109.29 in Houston and $75.83 in Dallas-Fort Worth, compared with the national average of $68.39, which puts Houston at ~1.6 times the national figure and Dallas-Fort Worth at ~1.1 times.9 Houston was also well above the other large Texas metros, San Antonio ($70.51) and Austin ($56.14). Within properties, costs rose 121% from 2019 to 2024 in Houston and 106% in Dallas-Fort Worth.

Chart Summary and Key Values
Bar chart of insurance cost per unit: national, Houston and Dallas-Fort Worth
Source: Federal Reserve Board, FEDS Notes, September 2025, using Trepp data.
Other trackers agree on the direction and the ranking, even though their levels differ. Yardi Matrix put the national average at $636 per unit a year in January 2024 and Houston at $1,115, ~1.75 times the national figure.10 The National Apartment Association's same-store data show Houston rising from $784 per unit in 2021 to $1,233 in 2024, up 57%.11
Why Texas premiums rose
Insurers price apartments on the expected cost of future claims, and Texas has seen some of the most frequent large weather losses in the country. The National Oceanic and Atmospheric Administration (NOAA) counted 190 weather and climate disasters with losses of $1 billion or more that affected Texas from 1980 to 2024, out of 403 nationwide, and 68 of them occurred from 2020 to 2024 alone.12
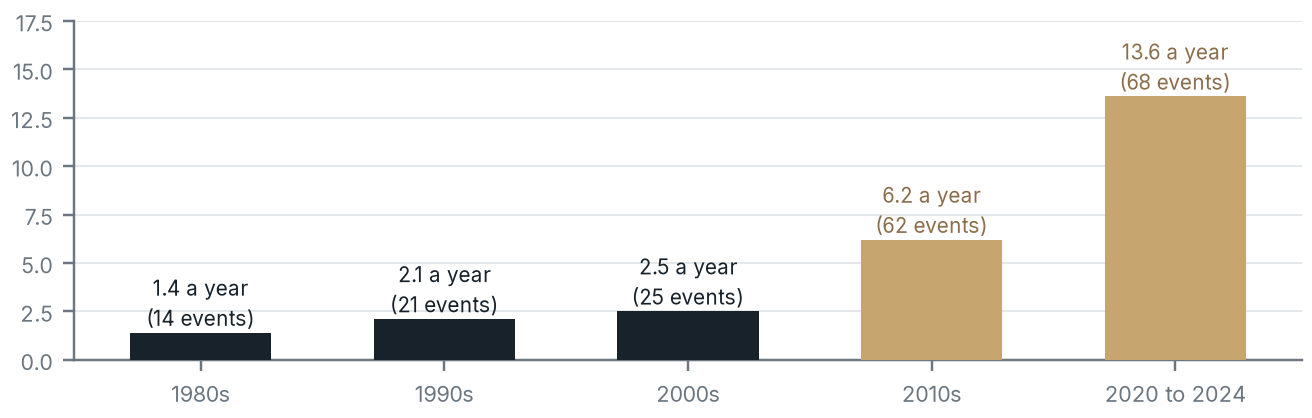
Chart Summary and Key Values
Bar chart of billion-dollar disasters affecting Texas by decade
Source: NOAA National Centers for Environmental Information.
Most were severe convective storms (hail, tornadoes and straight-line wind), which account for 54 of the 68 Texas events from 2020 to 2024. Texas recorded 878 hail events with stones of one inch or larger in 2024, the most of any state, and 169 tornadoes, and the February 2021 winter storm generated insured losses of which ~80% were in Texas.13 For Houston, hurricanes and flooding add a further layer of risk, from Hurricane Harvey in 2017 to the May 2024 derecho and Hurricane Beryl in July 2024, both wind events that struck the metro.12 Higher reinsurance costs in 2022 and 2023 added to the pressure on primary insurers.
Relief in 2025 and 2026, from a higher base
The market has turned. CRED iQ's same-store data show apartment insurance costs falling 2.2% nationally in 2025 and 8.4% for Texas properties, and in the first half of 2026, 72% of Sunbelt apartment properties paid less than a year earlier, with the typical premium down 11%.4 Marsh's Global Insurance Market Index shows U.S. commercial property rates down 10% in the third quarter of 2026, after a 13% decline in the second quarter, as insurer capacity expanded.14
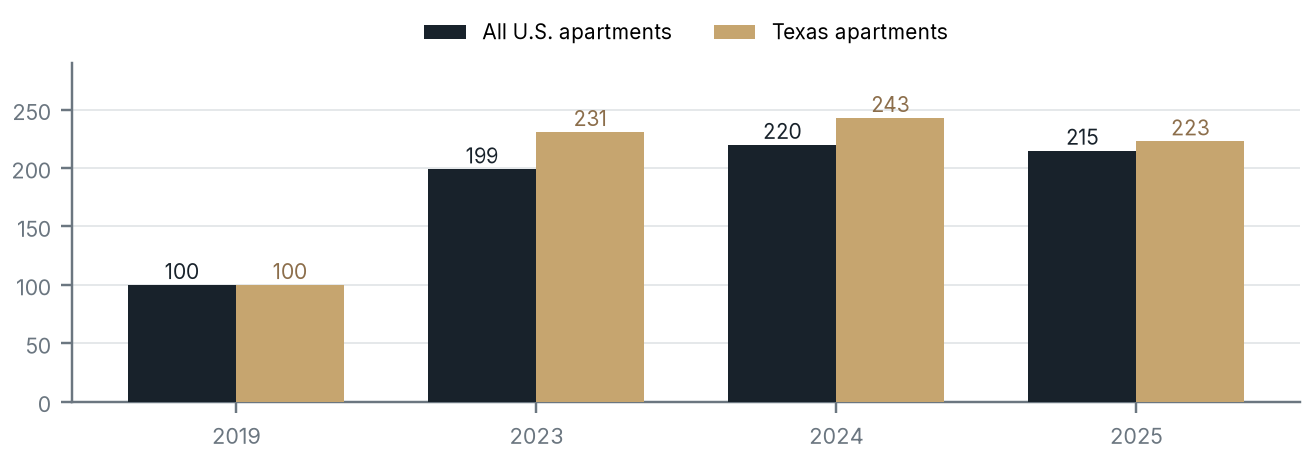
Chart Summary and Key Values
Grouped bar chart of the apartment insurance cost index for the U.S. and Texas
Source: CRED iQ.
The relief comes from a much higher base. Even after the 2025 decline, Texas apartment insurance costs were still ~2.2 times their 2019 level on CRED iQ's index, and Marsh reports that casualty rates, which include the liability coverage apartment owners also carry, rose 6% in the third quarter of 2026. Marsh also flags habitational property, which includes apartments, as one of the more volatile segments of the market. For underwriting, that argues for budgeting insurance at today's quotes with room for increases, rather than extrapolating the recent declines.
Property taxes: how Texas taxes apartments
Texas has no state property tax. Instead, counties, cities, school districts and special districts each set a rate that applies to the same appraised value, and the county appraisal district appraises property at its market value as of January 1 each year.15 Owners can protest their values to an appraisal review board. For apartments, the Harris Central Appraisal District values properties with income models built on market rents, vacancy, expenses and capitalization rates for each of its 36 apartment market areas, adjusting for rental concessions.16 Texas does not require sale prices to be disclosed, so appraisal districts rely heavily on income data and their own models, which is one reason income-based protests matter.16 In practice, an apartment's tax bill tends to rise and fall with its NOI and with market cap rates.
Texas taxes apartments at higher effective rates
The Lincoln Institute of Land Policy's annual 50-State Property Tax Comparison Study calculates the effective tax rate, the tax bill as a percentage of market value, for a hypothetical $600,000 apartment property in each large city. For taxes paid in 2025, the rate was 2.04% in Houston, 2.31% in Dallas and 2.18% in Fort Worth, compared with an average of 1.54% for the 50 largest U.S. cities.17 That puts Houston at ~1.3 times the large-city average and Dallas at ~1.5 times.
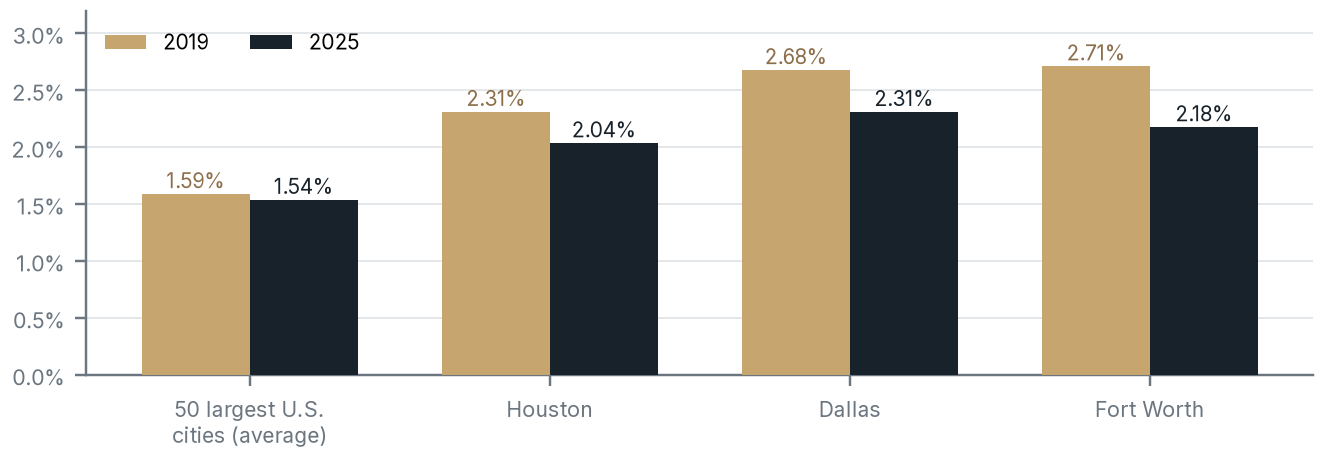
Chart Summary and Key Values
Grouped bar chart of apartment effective tax rates, 2019 and 2025
Source: Lincoln Institute of Land Policy and Minnesota Center for Fiscal Excellence, 50-State Property Tax Comparison Study.
The chart also shows the effect of the past six years of state tax relief. Effective apartment rates fell by 0.28 percentage points in Houston, 0.37 in Dallas and 0.54 in Fort Worth from 2019 to 2025, compared with 0.05 points for the large-city average. The Texas gap has narrowed, but it has not closed.
School tax compression: the relief that reaches apartments
The largest piece of each Texas tax bill is usually the school district's maintenance and operations (M&O) rate. Since 2019, the Legislature has used state funds to buy down, or compress, the Tier One school M&O rate for every district. The state maximum compressed rate fell from $1.00 per $100 of value before the 2019 school finance law to $0.93 in 2019, $0.8941 in 2022, $0.6880 in 2023, $0.6322 in 2025 and $0.6254 for tax year 2026, a decline of ~37%.18 Compression applies to all taxable property, including apartments.
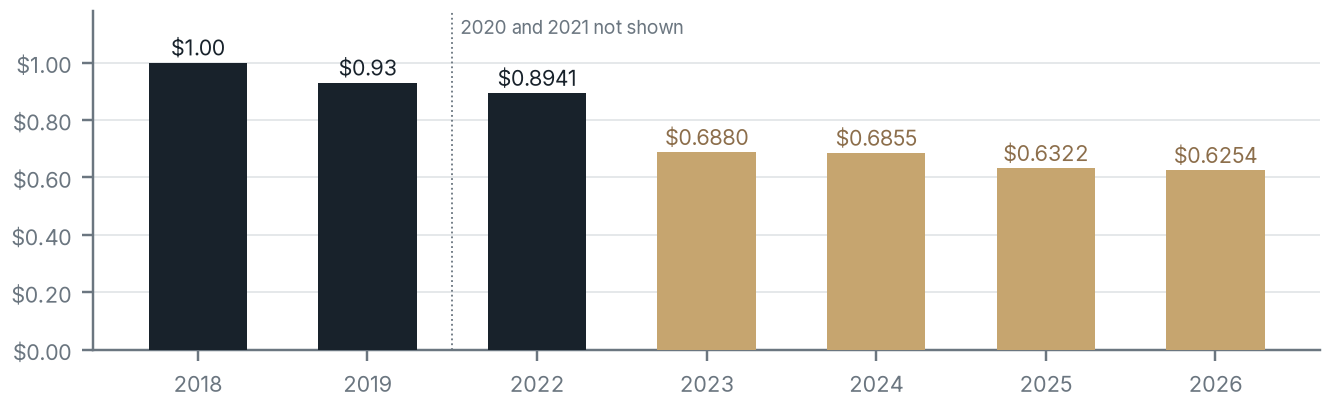
Chart Summary and Key Values
Bar chart of the Texas school maximum compressed tax rate, 2018 to 2026
Sources: Texas Legislative Budget Board; Texas Education Agency.
Two other limits help apartment owners indirectly. Since 2020, a city or county that wants to raise its M&O revenue from existing property by more than 3.5% a year must hold an election, and the school compression formula lowers rates further whenever statewide property values grow faster than 2.5% a year.19 When values rise faster than that, taxing units generally have to lower their rates.
Relief that mostly does not reach apartments
Much of the recent legislation targets homeowners:
- Homestead exemption. The school district homestead exemption rose to $100,000 in 2023 and to $140,000 after voters approved it in November 2025, with $200,000 for owners who are 65 or older or disabled. Apartments are not homesteads and do not qualify.20
- The 10% appraisal cap. A homestead's taxable value cannot rise more than 10% a year. The cap does not apply to rental property.21
- The 20% circuit breaker. For 2024 to 2026, non-homestead real property valued at ~$5 million or less (indexed to inflation) is limited to 20% annual increases in appraised value, excluding new improvements. Most institutional-scale apartment communities are worth far more than that, new construction is excluded, and the provision expires on December 31, 2026.22 Bills to extend or make it permanent, including in the 2025 special sessions, were not enacted.23 The 90th Legislature does not convene until January 12, 2027, so smaller capped properties, mostly older, lower-value buildings, may see a one-time catch-up in their 2027 appraisals, which mostly affects older competing stock rather than new institutional-scale communities.24
- Business personal property. Voters approved a $125,000 exemption for income-producing business personal property in November 2025, which can reduce or eliminate the tax on a community's appliances, furniture and equipment.20
The upshot is that Texas apartment owners have benefited from rate compression, but they pay taxes on full market value every year with no cap, while homestead exemptions have grown much faster than any relief aimed at rental property. The Lincoln Institute puts Houston's 2025 effective rate at 1.27% for a median-valued homestead, compared with 2.04% for the apartment property above.17
Two metros, two cost profiles
Houston and Dallas-Fort Worth are often grouped together as Texas growth markets, but their operating-cost profiles differ. Houston's distinctive cost is insurance, driven by hurricane, flood and hail exposure along the Gulf Coast. Dallas-Fort Worth's insurance costs sit close to the national average, while its property tax burden is among the heaviest in the country.
| Measure | National | Houston | Dallas-Fort Worth |
|---|---|---|---|
| Insurance per unit per month, 2024 (Fed, 2023 dollars) | $68.39 | $109.29 | $75.83 |
| Insurance growth within properties, 2019 to 2024 (Fed) | n/a | +121% | +106% |
| Apartment effective tax rate, 2025 (Lincoln Institute) | 1.54% | 2.04% | 2.31% (Dallas); 2.18% (Fort Worth) |
| Property taxes as a share of income, 12 months to July 2026 (Yardi Matrix) | 8.8% | Not reported | 15.9% (Dallas); 15.6% (Fort Worth) |
| Renter-occupied units built before 2000, 2025 (Census ACS) | 70% | 52% | 52% |
Table Summary and Key Values
Column headings: Measure, National, Houston, Dallas-Fort Worth.
For an investor, the practical point is that the same rent growth can produce different results in the two metros. In Houston, the insurance budget and the property's age, construction type and flood exposure deserve the closest look. In Dallas-Fort Worth, the assumed appraised value and tax rate usually matter more. In both, the national averages that appear in many market reports understate what Texas properties actually pay.
How a tax bill changes over a development's life
Because Texas appraises property at market value each January 1, a development's tax bill changes as the project moves from land to a stabilized community.
- Land and early construction. While a site is being prepared, the bill is based mainly on land value. A partly built project is appraised in its condition on January 1, so the first construction-year bills are usually modest.
- Lease-up. Once buildings are complete, the appraisal district can value the property on its income, often while occupancy and rents are still rising. Owners can present rent rolls and operating statements to support a lower value, and the appraisal review board hears protests each spring and summer.
- Stabilization. At stabilization, the appraisal generally reflects the community's full income-based value. Because the 10% cap applies only to homesteads and the 20% circuit breaker excludes new improvements and expires at the end of 2026, nothing limits how much a new community's appraised value can rise in a single year.21
The implication is that a development budget should model taxes at the expected stabilized value from the first full year of operations, not at the lower values on the bills received during construction.
Why new construction can have an edge
The two cost lines behave differently for a new community. Property taxes follow value, so a newly built community generally carries a higher tax bill per unit than an older one nearby. Insurance and maintenance can work the other way, because underwriters and repair budgets both reward newer buildings.
Modern codes, wind and flood design
Houston's current building code is based on the 2021 International Building Code, which took effect on January 1, 2024, with local amendments.27 Codes adopted since 2000 include stronger wind, flood and fire provisions, and FEMA's national study of hazard-resistant building codes estimates that they avoid ~$1.6 billion of property losses a year, with Florida, Texas, California and South Carolina accounting for 80% of the total, and $132 billion in cumulative losses avoided by 2040.28
Flood rules have also tightened. After Hurricane Harvey, the City of Houston required new construction in the 500-year floodplain, not just the 100-year floodplain, to place its lowest floor at least two feet above the 500-year flood elevation, effective September 1, 2018.29 A community built under those rules starts with lower flood exposure than one built in the 1970s or 1980s under the standards of that era.
Fire sprinklers
Fire sprinklers are standard in new apartment construction but are missing from much of the older stock. The National Fire Protection Association reports that from 2020 to 2024, in residential fires, a category that includes apartments, the death rate was 90% lower when sprinklers were present than when no automatic extinguishing system was present, and the average property loss per fire was 58% lower.30 Lower expected losses translate into lower premiums.
What underwriters charge by vintage
Building age has become one of the strongest pricing variables in Houston. Data from the insurance analytics firm Advocate Technologies show Houston apartment stock built before 1980 priced at nearly twice the rate of stock built in 2000 or later, with insurance at 7.0% of gross rent for pre-1980 properties compared with 3.7% for the newer group.6 By Advocate's estimate, each decade of newer construction lowers the Houston premium rate by ~14%, compared with less than 2% nationally, and only 48 carriers wrote Houston multifamily property coverage over a two-year period, compared with 482 nationally.

Chart Summary and Key Values
Bar chart of insurance as a share of gross rent by building age in Houston
Source: Advocate Technologies data, reported by Bisnow, November 2026.
Fewer deferred-maintenance surprises
Older buildings also carry more risk of large, unplanned repairs: roofs, plumbing, electrical systems and building envelopes near the end of their useful lives. Those are the systems that failed in Houston during the February 2021 freeze, when burst pipes damaged many older communities. A new community starts with new systems, current energy and freeze-protection standards, and builder warranties, so its early years usually carry lower repair and capital costs.
Most renters in both metros still live in older buildings. The Census Bureau's 2025 American Community Survey shows that 52% of renter-occupied units in Houston and 52% in Dallas-Fort Worth were in buildings constructed before 2000, compared with 70% nationally; 28% of Houston's renter-occupied units and 25% of Dallas-Fort Worth's were built before 1980.31
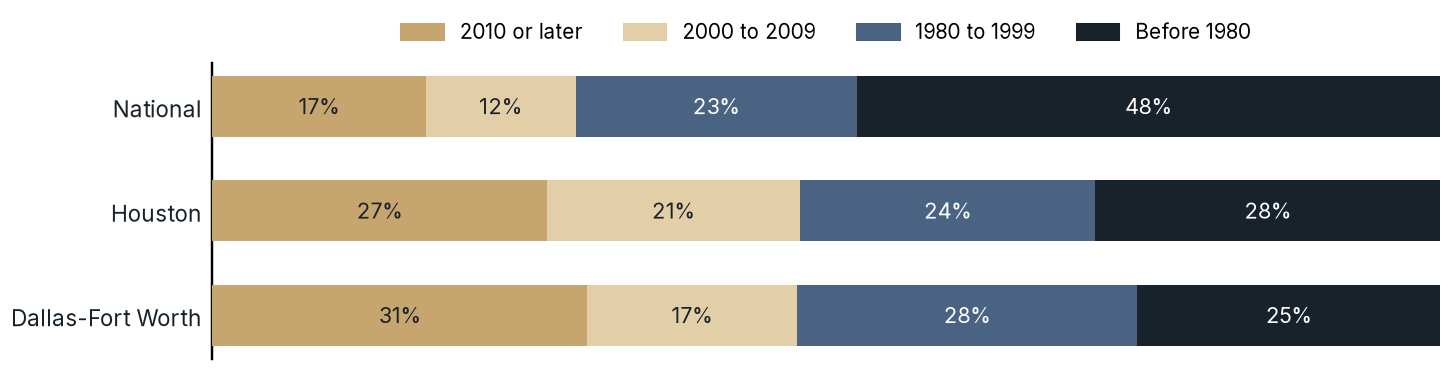
Chart Summary and Key Values
Stacked bar chart of renter-occupied units by year built: national, Houston and Dallas-Fort Worth
Source: U.S. Census Bureau, American Community Survey 1-year estimates, Table B25036.
What this means for development
Operating costs do not decide whether a market is attractive, but they shape how a project should be underwritten and built. Three points follow from the data.
First, underwrite taxes at full stabilized value. Early tax bills for a project under construction reflect a partly built property as of January 1, and they understate what a stabilized community will pay. Because apartments in Texas have no appraisal cap, the stabilized bill should be modeled on the value the community is likely to carry, with a realistic allowance for successful protests rather than an assumed one.
Second, budget insurance at today's quotes, and design to lower it. The 2025 and 2026 declines are welcome, but the long-run trend in Texas has been up. Building features that underwriters price, including wind-rated roofs and openings, elevation above the floodplain, full sprinkler coverage, and freeze-protected plumbing, can lower premiums and deductibles for the life of the property.
Third, compare the whole cost structure. A new community pays more in taxes per unit than an older one, but it can be insured for less, it starts with new systems, and it generally attracts renters who will pay for newer space.


How Ascendant manages insurance and property taxes
Because insurance and property taxes are among the largest costs in a Texas apartment budget, Ascendant treats both as ongoing management work rather than bills to be paid as they arrive.
Insurance. Each year, Ascendant works with experienced multifamily insurance brokers to run a competitive request-for-proposal (RFP) process for its coverage. At the same time, it works with established third-party property managers that can price coverage through master insurance programs spread across their entire management portfolios. Running both processes in parallel puts the brokers and the property managers' master policies in competition for the same coverage each year, which can help Ascendant's communities obtain more competitive pricing and terms than a single quote would. Results vary by property and by year, and overall market conditions still drive much of the outcome.
Property taxes. Ascendant works with an entrepreneurial property tax consulting firm whose goal is to keep each property's appraised value at or below market. In Texas, an owner who disagrees with the appraisal district's value can protest to the appraisal review board (ARB), a panel of locally appointed citizens that hears disputes between property owners and the appraisal district.32 An owner who is dissatisfied with the ARB's decision can appeal to state district court under Chapter 42 of the Texas Tax Code, generally by filing a petition within 60 days of receiving the ARB's order.33 Ascendant's consultant protests values at the ARB and, where the evidence supports it, pursues litigation.
The bottom line
By a rough estimate that combines two different samples, property taxes and insurance take about a fifth of revenue for a typical Dallas-Fort Worth apartment community, compared with about one-eighth nationally, and Houston pairs somewhat lower tax rates with the highest insurance costs of the large Texas metros. Houston's distinctive cost is insurance, at ~1.6 times the national average per unit; Dallas-Fort Worth's is property taxes, at ~1.8 times the national share of income. State school-tax compression has narrowed the Texas tax gap, and insurance costs are easing from their 2024 peak, but most homeowner relief does not reach apartments. Newer Class A communities have generally fared better on insurance than older Class B and C stock. New construction carries higher tax bills, yet modern codes, flood elevation, sprinklers and new systems can make it meaningfully cheaper to insure and maintain than the older stock that still houses about half of renters in both metros.
Sources
- National Apartment Association, "Where a Dollar of Rent Went in 2025", October 14, 2026, https://naahq.org/news/where-dollar-rent-went-2025 ↩
- National Multifamily Housing Council, "What Do Apartments Pay in Taxes?", Research Notes, 2026 (Yardi Matrix data), https://www.nmhc.org/research-insight/research-notes/2026/what-do-apartments-pay-in-taxes/ ↩
- National Apartment Association, "Expense Watch: Property Taxes Continue to Rise Across U.S. Apartment Markets", October 15, 2026 (Yardi Matrix Financial Benchmarking data, 12 months ending July 2026), https://naahq.org/news/expense-watch-property-taxes-continue-rise-across-us-apartment-markets ↩
- CRED iQ, "Insurance Is Taking a Bigger Bite Out of Apartment Revenue", October 8, 2026 (same-store operating statements for apartment properties securing CMBS and Freddie Mac K-deal loans; 2025 figures preliminary), https://cred-iq.com/blog/2026/10/08/insurance-is-taking-a-bigger-bite-out-of-apartment-revenue/ ↩
- Samuel K. Hughes and Raven Molloy, "Rising Property Insurance Costs and Pass-Through to Rents for Apartment Buildings", FEDS Notes, Board of Governors of the Federal Reserve System, September 19, 2025 (Trepp loan-level data; Figure 1 accessible data, average real monthly cost per unit in 2023 dollars), https://www.federalreserve.gov/econres/notes/feds-notes/rising-property-insurance-costs-and-pass-through-to-rents-for-apartment-buildings-20250919.html ↩
- Bisnow, "Insurance Pricing Piles Pressure On Houston's Older Apartments", November 12, 2026 (Advocate Technologies data), https://www.bisnow.com/news/houston/multifamily/insurance-pricing-piles-pressure-on-houston-s-older-apartments ↩
- Berkadia, "Is the Trophy Asset Still Winning?", December 2023, https://www.berkadia.com/wp-content/uploads/2023/12/is-the-trophy-asset-still-winning.pdf ↩
- Minjoo Kim, Prateek Mahajan and Zirui Wang, "The Rise in Insurance Costs for Commercial Properties: Causes, Effects on Rents, and the Role of Owners", working paper, University of Texas at Dallas, July 15, 2025, https://bpb-us-e2.wpmucdn.com/sites.utdallas.edu/dist/8/1090/files/2025/08/The-Rise-in-Insurance-Costs-for-Commercial-Properties-Causes-Effects-on-Rents-and-the-Role-of-Owners.pdf ↩
- Federal Reserve Board, FEDS Notes, Hughes and Molloy, Figure 2 accessible data, average monthly property insurance cost per unit in 2024 and average within-property growth from 2019 to 2024, by CBSA, https://www.federalreserve.gov/econres/notes/feds-notes/rising-property-insurance-costs-and-pass-through-to-rents-for-apartment-buildings-accessible-20250919.htm ↩
- Yardi Matrix, "Expense Growth Bedevils", Matrix Research Bulletin, March 2024, https://www.ncsha.org/wp-content/uploads/Matrix-Research-Bulletin-Multifamily-Expenses-March-2024.pdf ↩
- National Apartment Association, "Metropolitan Fragmentation Trends: Insurance Inflation Is Outpacing the National Trend in Many Markets", https://naahq.org/news/metropolitan-fragmentation-trends-insurance-inflation-outpacing-national-trend-many-markets ↩
- NOAA National Centers for Environmental Information, U.S. Billion-Dollar Weather and Climate Disasters, events affecting Texas and the United States, 1980 to 2024 (CPI-adjusted), https://www.ncei.noaa.gov/access/billions/events-TX-1980-2024.csv ↩
- Insurance Information Institute (Triple-I), "Trends and Insights: Texas: A Complex Mix of Risks", July 2025, https://www.iii.org/sites/default/files/docs/pdf/triple-i_trends_and_insights_texas_brief_07102025.pdf ↩
- Marsh, Global Insurance Market Index, "US Insurance Market Rates", Q3 2026, https://www.marsh.com/en/services/international-placement-services/insights/us-insurance-rates.html ↩
- Texas Comptroller of Public Accounts, "Property Tax System Basics", https://comptroller.texas.gov/taxes/property-tax/basics.php ↩
- Harris Central Appraisal District, 2026 Mass Appraisal Report, May 6, 2026, https://hcad.org/assets/uploads/pdf/2026-Mass-Appraisal-Report.pdf ↩
- Lincoln Institute of Land Policy and Minnesota Center for Fiscal Excellence, 50-State Property Tax Comparison Study for Taxes Paid in 2025, Appendix Table 5b, https://www.lincolninst.edu/publications/other/50-state-property-tax-comparison-study-2025/; 50-State Property Tax Comparison Study for Taxes Paid in 2019, Appendix Table 5b, https://www.lincolninst.edu/sites/default/files/pubfiles/50-state-property-tax-comparison-for-2019_full.pdf ↩
- Texas Legislative Budget Board, "Property Tax Relief", August 2024 (rates before and after 2019), https://www.lbb.texas.gov/Documents/Publications/Presentation/LBB_Property_Tax_Relief_SFC.pdf; Texas Education Agency, "Preliminary Maximum Compressed Tax Rates (MCR) and Adoption of Tax Rate for Tax Year 2023", https://tea.texas.gov/taa-letters/preliminary-maximum-compressed-tax-rates-mcr-and-adoption-tax-rate-tax-year-2023; "Tax Year 2025 Maximum Compressed Tax Rates", June 12, 2025, https://tea.texas.gov/taa-letters/tax-year-2025-maximum-compressed-tax-rates; "Tax Year 2026 Maximum Compressed Tax Rates", June 18, 2026, https://tea2.tea.texas.gov/sites/default/files/taa-letters/taa-2026-06-18-tax-year-2026-maximum-compressed-tax-rates.pdf ↩
- Texas Legislature, SB 2 (86th Legislature, 2019), bill summary, https://capitol.texas.gov/billlookup/BillSummary.aspx?Bill=SB2&;LegSess=86R ↩
- Texas Senate, Senator Paul Bettencourt, "Gov. Abbott Signed SB 4, SB 23, & HB 9 into Law as Part of $10B Property Tax Relief Package", June 16, 2025, https://senate.texas.gov/press.php?id=7-20250616b; Ballotpedia News, "Texas Voters Approve All 17 Constitutional Amendments", November 5, 2025, https://news.ballotpedia.org/2025/11/05/texas-voters-approve-all-17-constitutional-amendments-including-prohibiting-certain-future-taxes-adding-parental-rights-and-prohibiting-noncitizens-from-voting-in-state-and-local-elections/ ↩
- Texas Comptroller of Public Accounts, "Appraisal and Tax Limitations", https://comptroller.texas.gov/taxes/property-tax/appraisal-tax-limitations.php ↩
- Texas Tax Code §23.231, "Circuit Breaker Limitation on Appraised Value of Real Property Other Than Residence Homestead", https://statutes.capitol.texas.gov/Docs/TX/htm/TX.23.htm ↩
- LegiScan, Texas HB 234, 89th Legislature, 1st Special Session (2025), https://legiscan.com/TX/bill/HB234/2025/X1; Bloomberg Tax, "Texas Property Owners Should Prep for Single-Year Tax Increase", June 22, 2026, https://news.bloombergtax.com/tax-insights-and-commentary/texas-property-owners-should-prep-for-single-year-tax-increase ↩
- Bloomberg Tax, "Texas Property Owners Should Prep for Single-Year Tax Increase" (see note 23). ↩
- Texas Legislative Budget Board, "Tax Exemptions for Public Facility Corporations Pursuant to House Bill 2071", December 2024, https://www.lbb.texas.gov/Documents/Publications/Policy_Report/8750_Public_Facility_Corporations_HB2071.pdf ↩
- Texas Housers, "HB 21 closes loopholes and requires greater affordability for Housing Finance Corporations tax exemption", July 3, 2025, https://texashousers.org/2025/07/03/hb-21-housing-finance-corporations-closes-loophole-texas-legislature/ ↩
- International Code Council, "Houston's City Council Approves Adoption of the 2021 International Codes", https://www.iccsafe.org/about/periodicals-and-newsroom/houstons-city-council-approves-adoption-of-the-2021-international-codes/ ↩
- Federal Emergency Management Agency, "Building Codes Save: A Nationwide Study of Loss Prevention", November 2020, https://www.fema.gov/emergency-managers/risk-management/building-science/building-codes-save-study ↩
- City of Houston, Code of Ordinances, Chapter 19, Floodplain, as amended effective September 1, 2018, https://library.municode.com/tx/houston/codes/code_of_ordinances?nodeId=COOR_CH19FL ↩
- National Fire Protection Association, "U.S. Experience with Sprinklers", October 2026, https://www.nfpa.org/education-and-research/research/nfpa-research/fire-statistical-reports/us-experience-with-sprinklers ↩
- U.S. Census Bureau, American Community Survey 2025 1-year estimates, Table B25036, Tenure by Year Structure Built, https://www2.census.gov/programs-surveys/acs/summary_file/2025/table-based-SF/data/1YRData/acsdt1y2025-b25036.dat ↩
- Texas Comptroller of Public Accounts, "Appraisal Review Boards (ARB)", https://comptroller.texas.gov/taxes/property-tax/arb/ ↩
- Texas Comptroller of Public Accounts, "Appraisal Protests and Appeals", https://comptroller.texas.gov/taxes/property-tax/protests/; Texas Tax Code, Chapter 42, Judicial Review, https://statutes.capitol.texas.gov/Docs/TX/htm/TX.42.htm ↩
Important disclosures
This article is for educational purposes only and is not an offer to sell or a solicitation of an offer to buy any security. Any offering by Ascendant Development or its affiliates is made only to verified accredited investors under Rule 506(c) of Regulation D through definitive offering documents, which should be read in full, including the risk factors. Real estate development involves risk, including the possible loss of principal, and is illiquid. Nothing here is tax, legal or investment advice; consult your own advisors. Forward-looking statements are not guarantees. Hypothetical examples are for illustration only and are not projections or the terms of any offering. Photographs show completed or existing Ascendant projects. They are shown to illustrate the firm's work and do not represent any specific current offering.