Key takeaways from the report
Most explanations of development describe the phases in general terms.
The project is Haven at Bellaire, a three-story garden community of 297 units in Richmond, Texas, in Fort Bend County southwest of Houston.
Haven at Bellaire's phases on a calendar, using the actual project dates.
Why follow one project from start to finish
Most explanations of development describe the phases in general terms. This one uses a single completed project and its actual dates, budget, leasing and sale results. The figures are actual project figures, not projections. They describe one project in one market at one point in the cycle, and they are not a prediction of how any other project will perform.
The project is Haven at Bellaire, a three-story garden community of 297 units in Richmond, Texas, in Fort Bend County southwest of Houston. Its unit mix ranged from 624-square-foot one-bedroom units to 1,242-square-foot two-bedroom units, with an average of about 881 square feet.
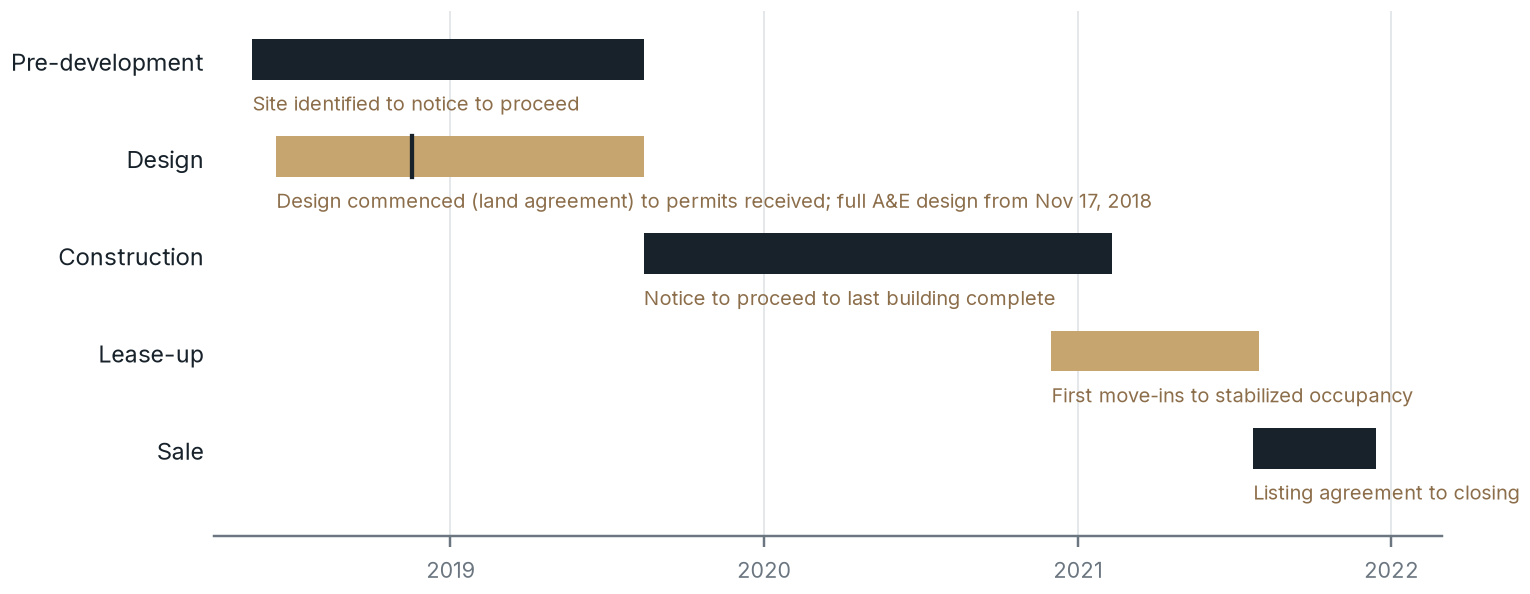
Chart Summary and Key Values
Haven at Bellaire's project timeline spans pre-development, design, construction, lease-up and sale across the illustrated 2018–2022 period. It distinguishes site identification to notice to proceed, design through permits, construction through the last completed building, first move-ins through stabilized occupancy, and listing through closing. The design note identifies full architectural and engineering design beginning November 17, 2018.
Haven at Bellaire's phases on a calendar, using the actual project dates. Design ran from the land purchase agreement to the receipt of permits (the tick marks the start of full architectural and engineering design), and lease-up began while the last buildings were still being completed. Graphic: Ascendant Development.
The timeline above is the map for the rest of this article. Read from top to bottom, each bar is a phase, and the overlaps matter as much as the bars themselves. The Design bar runs until the development permit was received, the same day construction started. Full architectural and engineering design began in November 2018, so the most expensive design work happened only after Ascendant had the land under contract and its early due diligence was under way. At the other end, lease-up started in December 2020, about two months before the last building was finished, and the sale began once the community was nearly full. Each phase handed off to the next with little idle time, which is one reason the investor hold period ended up shorter than planned.
Picking the market and submarket
Every development starts with two location decisions: the market (here, the Houston metropolitan area) and the submarket (here, Fort Bend County and the Richmond area on the west side of the region). A strong market supplies jobs and population growth; the right submarket is where that growth turns into demand for new Class A apartments.
The market: Houston. In 2018 we saw a metro economy that had recovered from the 2015–2016 energy downturn and was adding jobs at a fast pace. Federal data back that up. In July 2018, total nonfarm employment in the Houston metro stood at about 3.11 million, up 101,800 jobs, or 3.4%, from a year
earlier. That was more than twice the national rate of 1.6%, and it was the first time since February 2015 that Houston's annual job gain exceeded 100,0001. Job growth matters for apartments because new jobs bring new households, and many of those households rent when they first arrive.
Our research also pointed to supply. After the 2015 peak, apartment construction across Houston had slowed considerably, and we expected rents for new Class A units to keep rising as fewer new projects competed for renters. Those supply and rent observations came from market research at the time; the job figures above are the part that can be checked against federal data.
The submarket: Fort Bend County and Richmond. Fort Bend County was one of the fastest-growing counties in Texas. Its population was 585,375 in the 2010 Census2, and the 2017 estimate was 764,8283, an increase of about 31% in seven years. The growth continued: the 2020 Census counted 822,779 residents2. Our market study showed even faster growth in the immediate area around the site, steady absorption of new apartments across the wider west Houston submarket, and Class A rents above what the pro forma needed.
The reasons we chose this location come down to four points:
Jobs within commuting distance. The site sits within reach of the Energy Corridor, the Westchase business district and the Galleria and Uptown area, as well as major employers in Katy and Fort Bend County.
Population growth. Fort Bend County added about 180,000 residents between 2010 and 20172,3, and new households need places to live.
High household incomes. Fort Bend County's median household income was $92,310 in 2018 and $101,361 in 2019, according to the Census Bureau's Small Area Income and Poverty Estimates4. High incomes support the rents that new Class A units require.
Room for new Class A product. With construction slowing across the metro, a new community could lease up against limited new competition.
Finding the site
Ascendant pursues only off-market sites. Instead of bidding in a publicly marketed land sale, where a broker invites many developers to compete and the price is pushed up, we search for landowners directly and negotiate one on one. The goal is to buy the land at the best possible price, which lowers the total project cost from day one. For development, the land price is one of the few costs the sponsor controls entirely, so it is where disciplined buying pays off.
The site was identified on May 15, 2018. It sits on Bellaire Boulevard in the Richmond area, near Mason Road and Grand Mission Boulevard, inside a growing area of master-planned neighborhoods, schools and shopping.
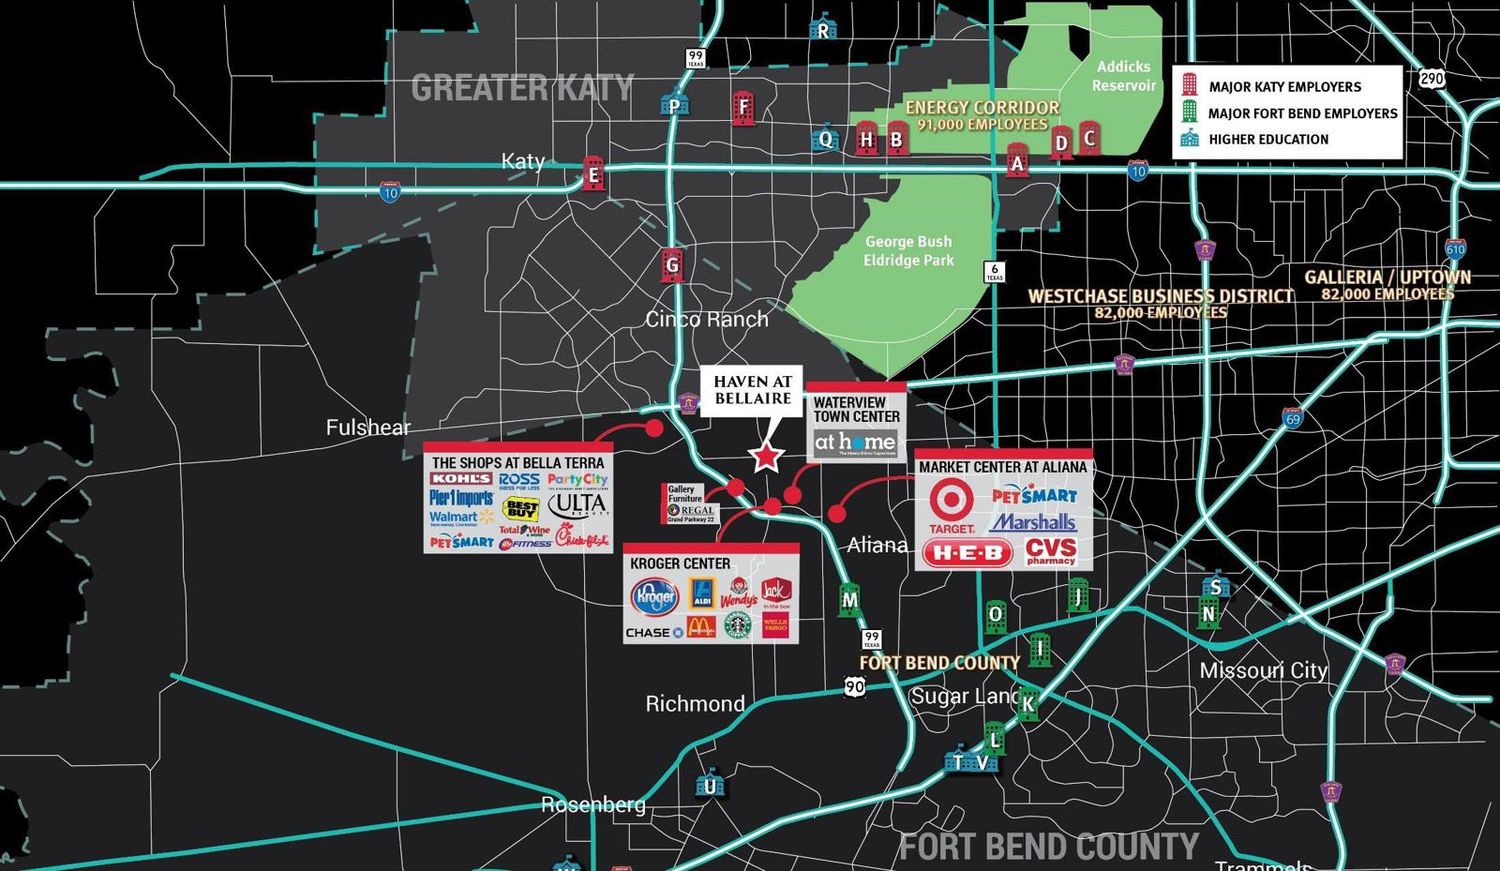
The regional map shows why the location works for renters. The star marks the site. To the north and northeast are the Energy Corridor and the Westchase business district, two of the region's largest employment centers, and the Galleria and Uptown area sits farther east. Major roads, including the Grand Parkway (State Highway 99), the Westpark Tollway and Interstate 10, connect the site to those job centers. Shopping centers with national grocers and retailers are clustered within a short drive.
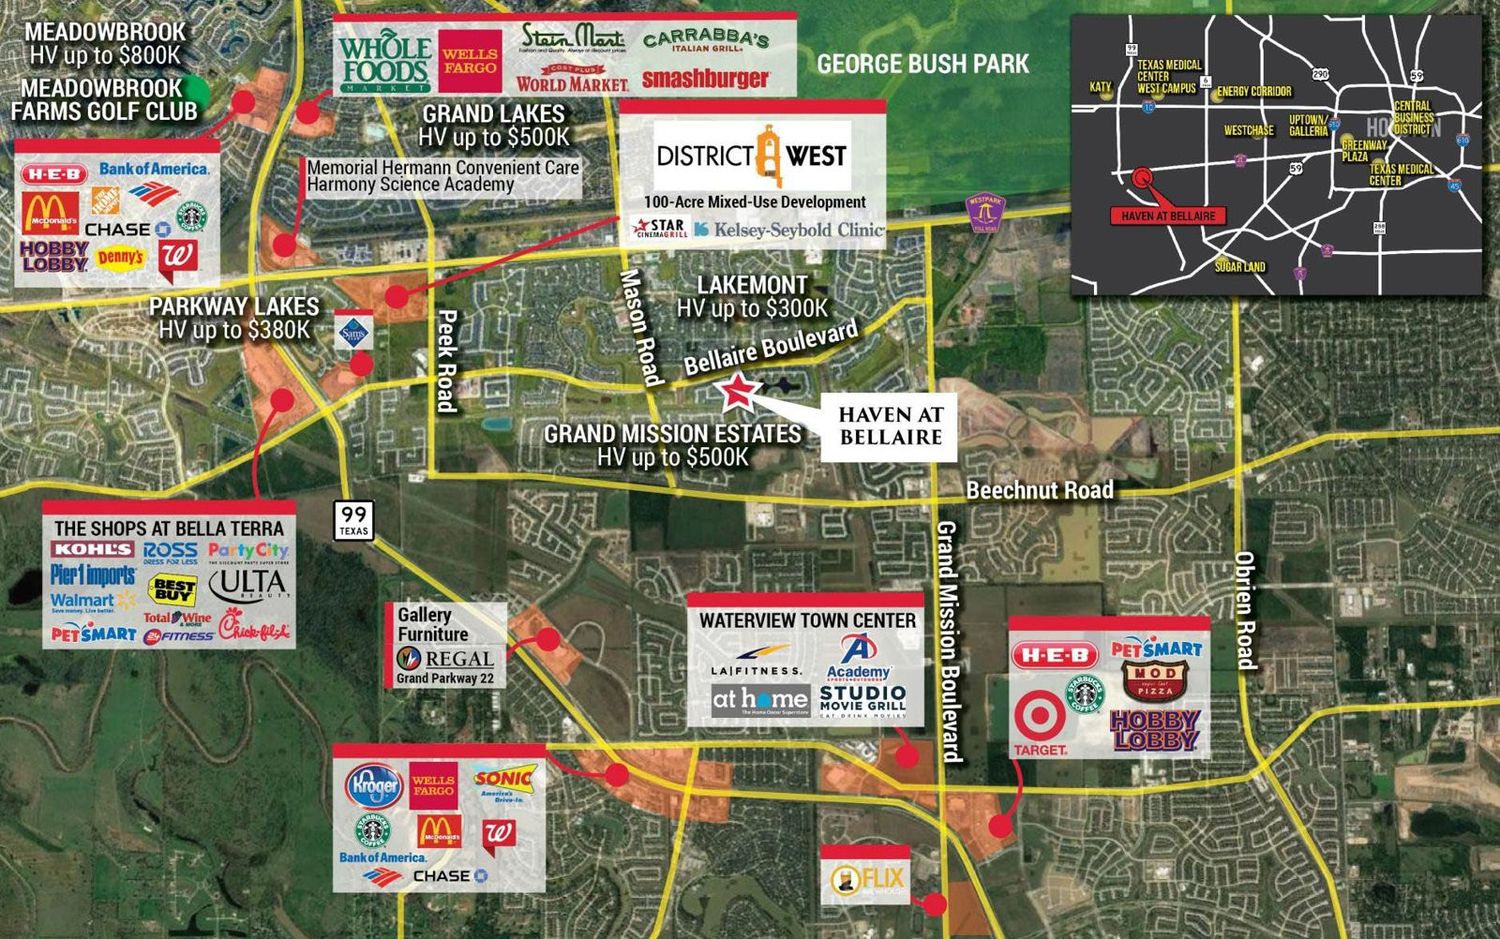
greater Houston (inset).
The closer map shows the immediate neighborhood. The site is surrounded by established single-family neighborhoods, a large mixed-use development to the north and several retail centers to the south and west. For residents, that means daily needs are close by; for the investment, it means the site sits in an area where people already want to live, rather than on the edge of future growth.
The land purchase agreement was signed on June 12, 2018, less than a month after the site was identified. Three days later, on June 15, 2018, we initiated the third-party diligence reports used to confirm the site could be built as planned:
A Phase I environmental assessment
A geotechnical engineering report
A traffic impact analysis
A market study
Choosing the design team
Ascendant engages each designer separately rather than hiring a single firm to deliver everything. Hiring each discipline directly gives Ascendant better visibility into the design process and more control over decisions, schedule and cost, because each firm reports to the developer rather than through another consultant. The design team for Haven at Bellaire was:
Architecture and landscape architecture: BSB Design. Designed the site plan, residential buildings, clubhouse and landscape.
Civil engineering: Jones & Carter. Designed the site's grading, drainage, paving and utilities.
MEP engineering: VP Engineering. Designed the mechanical, electrical and plumbing systems.
Structural engineering: Integrity Structural. Designed the building structures.
Interior design: MF Interior Design, Ascendant's in-house team. Designed the clubhouse and unit interiors and selected finishes.
The design process
Design began with the site plan. The architect worked through several site plan iterations with the Ascendant team (both its development and construction arms), testing how buildings, parking, the clubhouse, the pool and open space fit on the land, and how residents would move through the community. Only once we reached a site plan that worked did the project move into full design of the residential buildings, the clubhouse and the units.
That order matters. Changing a site plan costs little; changing a fully engineered building costs a great deal. Settling the layout first keeps the more expensive design work from being redone.
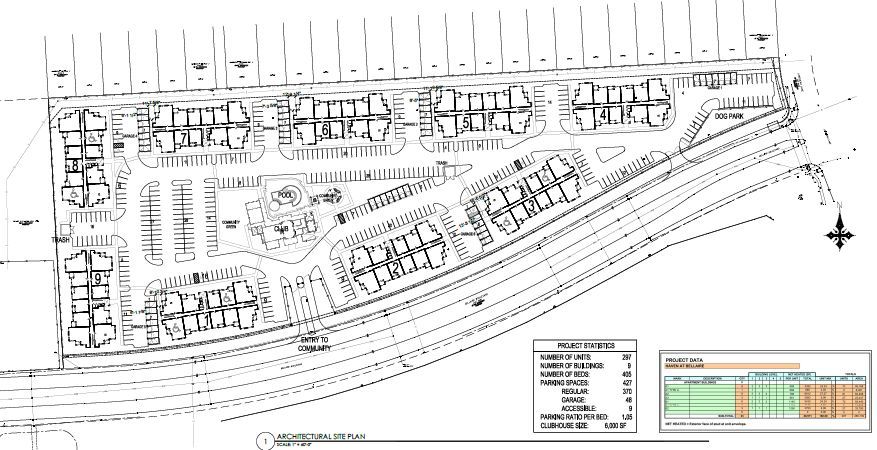
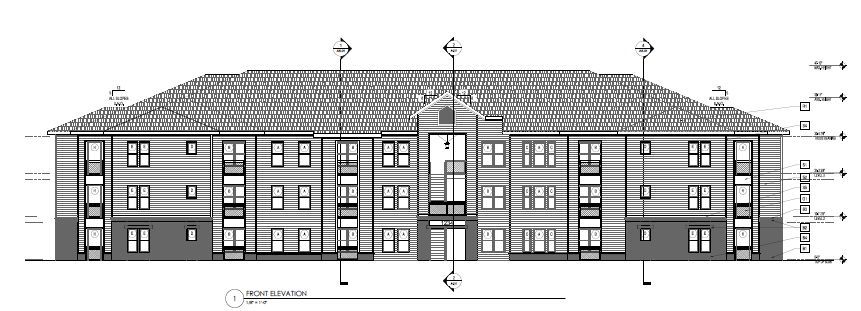
Design commenced with site planning when the land purchase agreement was signed on June 12, 2018. Once the site plan was settled, full architectural and engineering design began on November 17, 2018, and the permit design set was submitted to Fort Bend County on April 30, 2019, about five and a half months later. The development permit was received on August 14, 2019, the day construction started. In parallel, Ascendant closed on the land and on the construction loan on February 11, 2019. The land was funded with sponsor capital, as required to close under the terms of the land contract, and was then contributed to the project at cost, without markup, when investor equity closed in August 2019.
Every pre-development date. The full sequence from site to start of construction:
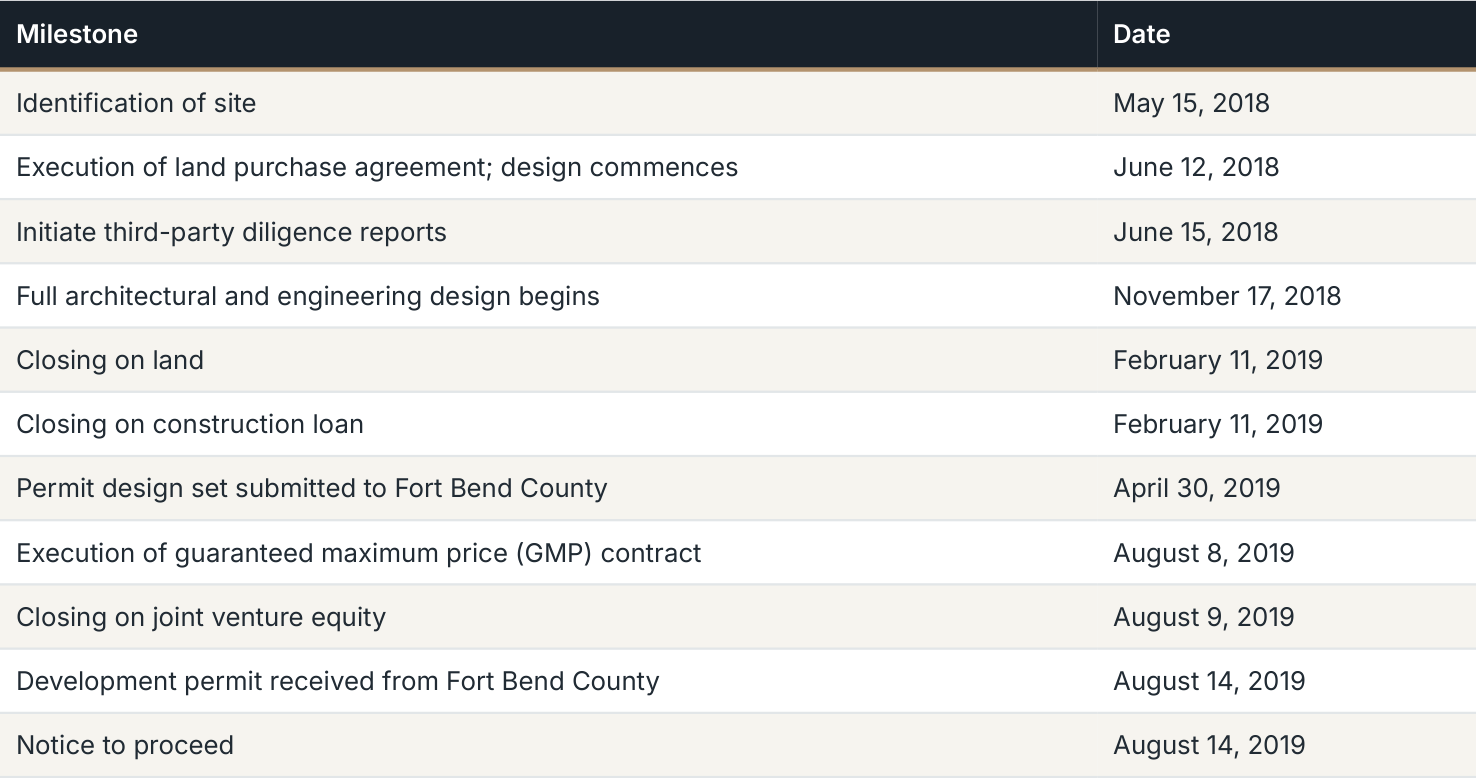
Table Summary and Key Values
| Milestone | Date |
|---|---|
| Identification of site | May 15, 2018 |
| Execution of land purchase agreement; design commences | June 12, 2018 |
| Initiate third-party diligence reports | June 15, 2018 |
| Full architectural and engineering design begins | November 17, 2018 |
| Closing on land | February 11, 2019 |
| Closing on construction loan | February 11, 2019 |
| Permit design set submitted to Fort Bend County | April 30, 2019 |
| Execution of guaranteed maximum price (GMP) contract | August 8, 2019 |
| Closing on joint venture equity | August 9, 2019 |
| Development permit received from Fort Bend County | August 14, 2019 |
| Notice to proceed | August 14, 2019 |
About 15 months passed between identifying the site and starting construction. The order of the last four steps is worth noting: the construction price was fixed on August 8, investor equity closed the next day, and the permit and notice to proceed followed five days later. Investors came in after the largest cost of the project was locked in and immediately before construction began.
Capitalization
The total budget was about $35.4M, funded by a construction loan and equity.
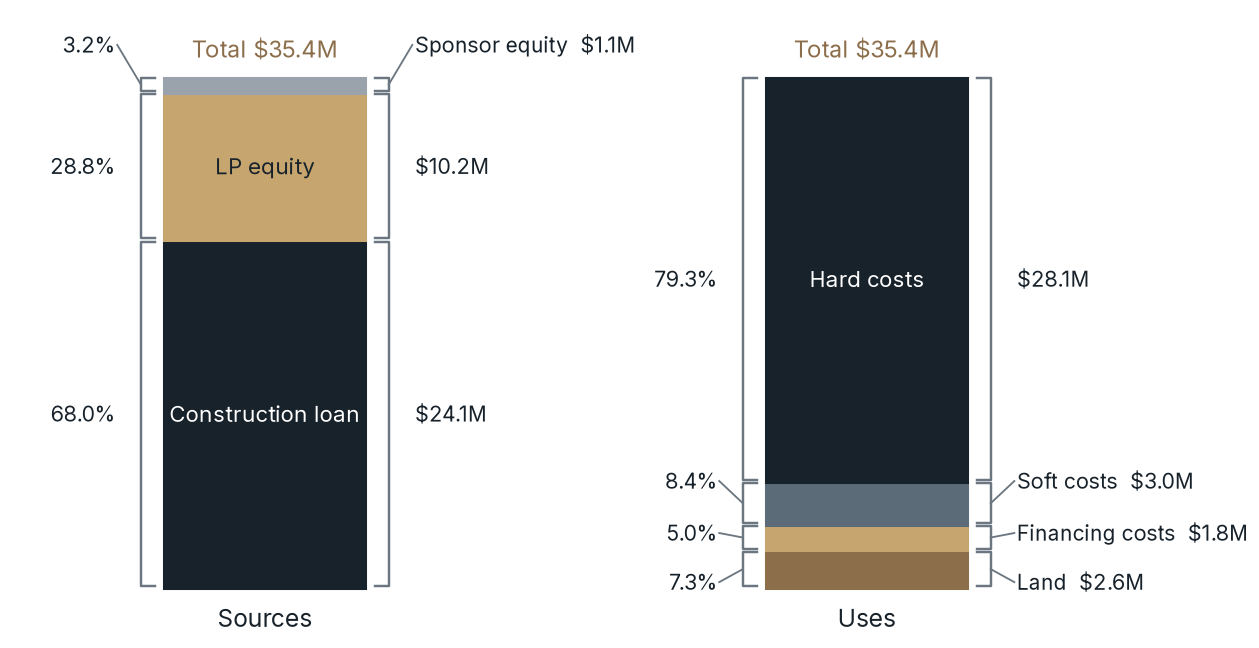
Chart Summary and Key Values
Haven at Bellaire's displayed total sources and uses are $35.4 million. Rounded sources: construction loan $24.1M (68.0%), LP equity $10.2M (28.8%) and sponsor equity $1.1M (3.2%). Rounded uses: hard costs $28.1M (79.3%), soft costs $3.0M (8.4%), financing costs $1.8M (5.0%) and land $2.6M (7.3%). Rounded components may not sum exactly to the displayed total.
Sources (left) and uses (right) of the project's $35.4M budget. Uses are stacked from the bottom: land, financing costs, soft costs and hard costs. Brackets show each item's share of the total (left) and dollar amount (right). Graphic: Ascendant Development.
The chart shows the two sides of the budget. On the left, the sources: a senior construction loan from a community bank funded about two-thirds of the cost, and joint venture equity funded the rest. Within the equity, an institutional equity partner provided 90% and the sponsor invested the remaining 10% alongside it. On the right, the uses: land, financing costs and soft costs (design, permits, fees and similar items) together were about $7.3M, and hard costs, the cost of building, were about $28.1M, or about 79% of the total. That is typical for a new garden community, where most of the money goes into the buildings themselves.
The total works out to about $119,275 per unit. Because the project was built at cost rather than bought at market value, that per-unit cost is the basis against which the finished community's value was later measured.
We had high confidence in the plan because the pro forma yield on cost (stabilized NOI divided by total cost) was 7.5%, while cap rates for stabilized suburban Class A multifamily in Houston were 4.50% to 5.00% in late 20195. Our market analysis also showed average Class A sales in the area at $160,000 per unit or more, compared with a budgeted cost of about $119,000 per unit. The project was budgeted well below recent comparable Class A sales, with a comfortable spread between its yield on cost and the market cap rates for stabilized Class A properties, the basis for valuing the community at exit.
The exact figures:
S O U R C E S A N D U S E S O F T H E B U D G E T
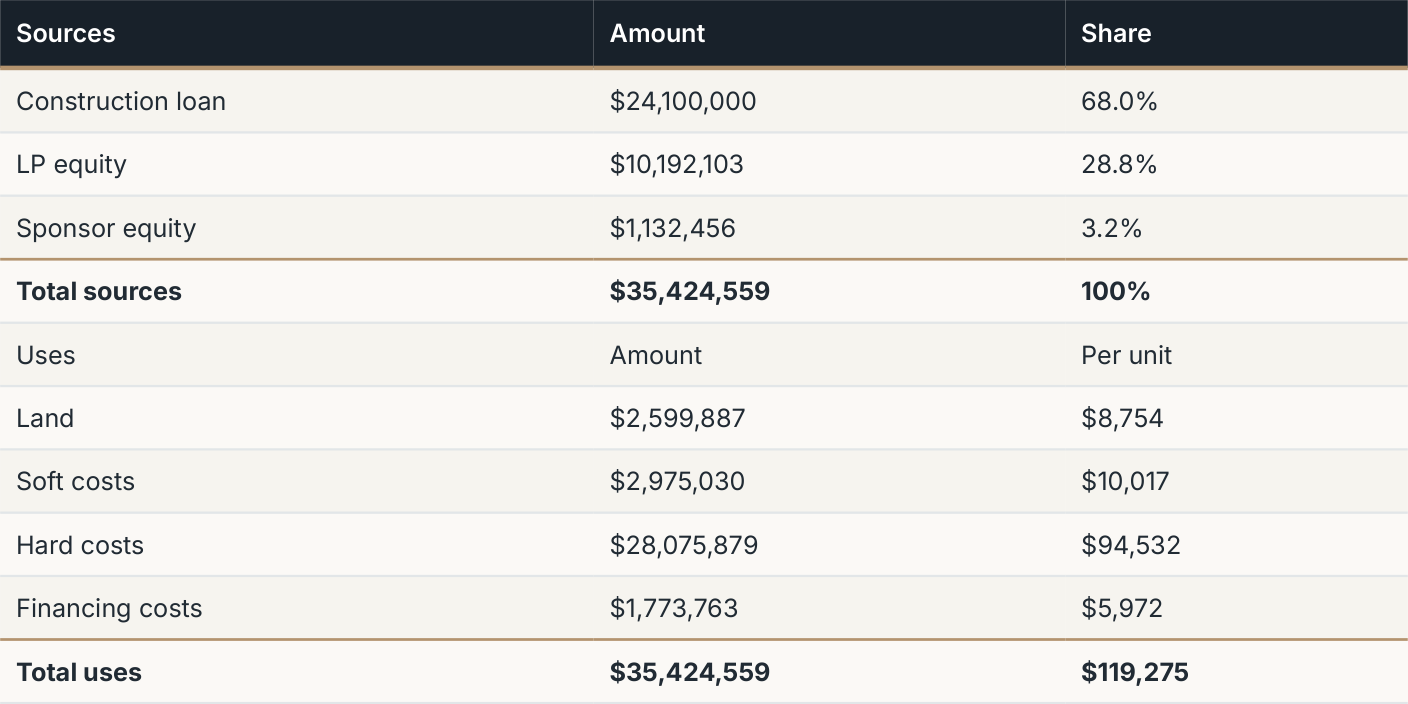
Table Summary and Key Values
| Sources | Amount | Share |
|---|---|---|
| Construction loan | $24,100,000 | 68.0% |
| LP equity | $10,192,103 | 28.8% |
| Sponsor equity | $1,132,456 | 3.2% |
| Total sources | $35,424,559 | 100% |
| Uses | Amount | Per unit |
| Land | $2,599,887 | $8,754 |
| Soft costs | $2,975,030 | $10,017 |
| Hard costs | $28,075,879 | $94,532 |
| Financing costs | $1,773,763 | $5,972 |
| Total uses | $35,424,559 | $119,275 |
Equity was split 90% LP and 10% sponsor ($10,192,103 and $1,132,456 of $11,324,559).
Construction (August 2019 to February 2021)
Construction began with the notice to proceed on August 14, 2019, under a guaranteed maximum price contract signed six days earlier. A GMP contract sets a ceiling on what the general contractor can charge for the agreed scope, which moves much of the risk of cost increases from the owner to the contractor. The pro forma assumed an 18-month construction period, and construction took 18 months, finishing on schedule. For comparison, Census data show that apartment buildings with 20 or more units started in 2019 took an average of 17.2 months from start to completion nationally6.
The community was completed building by building. The clubhouse came first, then each residential building in sequence, so leasing could begin before the last building was finished.
In the chart below, each pair of bars compares one building's schedule with its result. The gold bar runs from the notice to proceed to the scheduled substantial completion date; the navy bar beneath it runs to the actual date. In every case the navy bar is shorter. The clubhouse was scheduled for January 26, 2021, and was substantially complete on December 1, 2020, about eight weeks early, and Building 1 followed two days later.
Completing the clubhouse and first buildings early mattered because it let leasing and move-ins start sooner. Each building that is finished early can start producing rent while the rest of the community is still under construction, which shortens the period when the project carries construction loan interest without rental income.
Building through COVID. Construction and lease-up ran through the COVID-19 pandemic. Even so, the clubhouse and early buildings finished early, construction finished on schedule and the project came in under budget. Part of the reason was the general contractor: Ascendant's affiliated construction company, whose incentives were aligned with the development's goals of finishing on time and on budget. Good sponsors align the incentives of everyone working on a project with the investors'. In our observation, a third-party general contractor in the same position would likely have issued a force majeure notice as soon as the pandemic began, giving it significant leeway to exceed the budget and schedule.
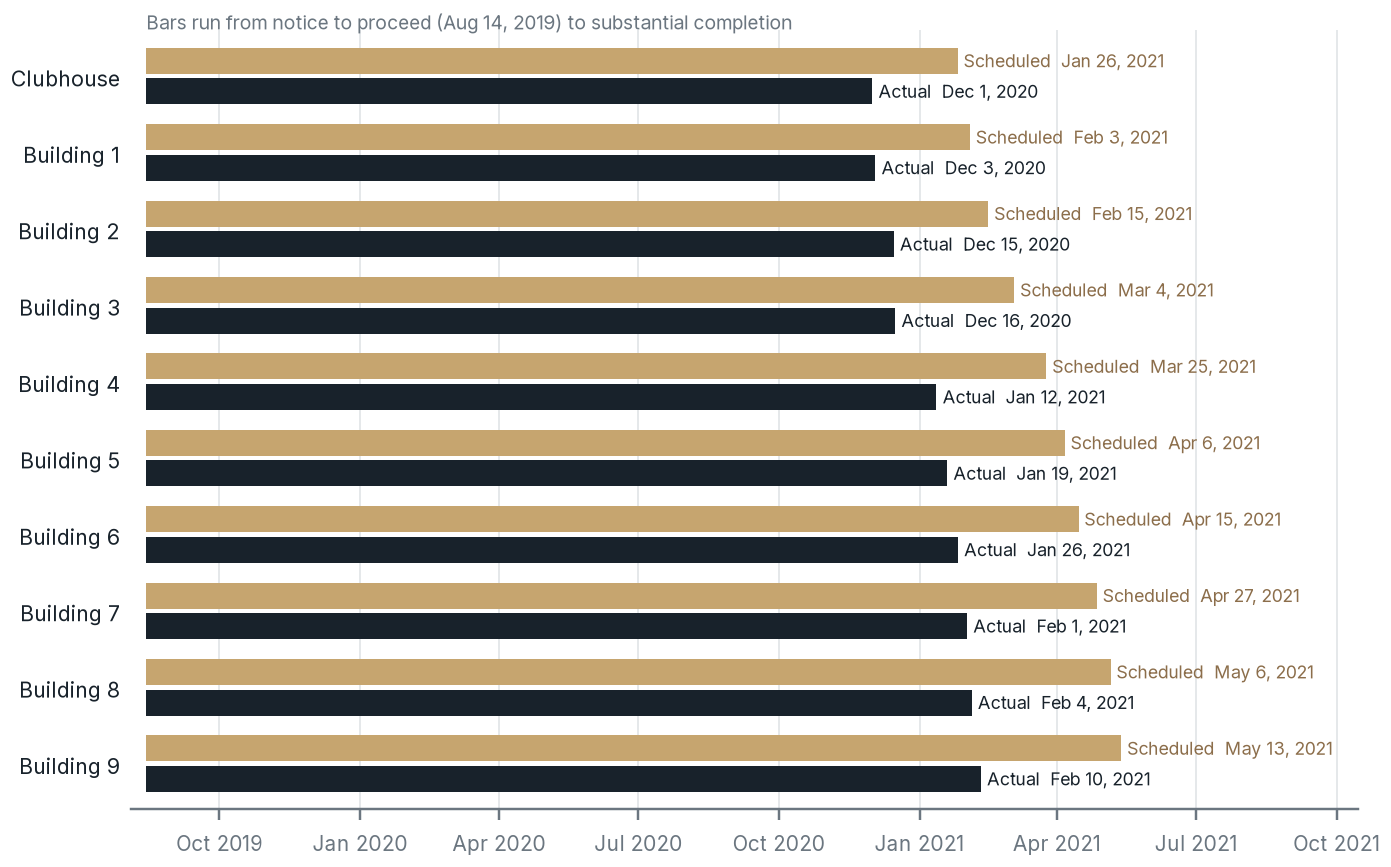
Chart Summary and Key Values
Haven at Bellaire construction schedule compares scheduled and actual substantial completion from the August 16, 2019 notice to proceed. Actual clubhouse completion was December 1, 2020, versus January 26, 2021 scheduled. The final listed building, Building 9, was actually completed February 10, 2021, versus May 13, 2021 scheduled. Every displayed actual completion precedes its corresponding scheduled date.
Scheduled (gold) and actual (navy) substantial completion for the clubhouse and each residential building. Every building finished ahead of schedule. Graphic: Ascendant Development.
Renderings to reality
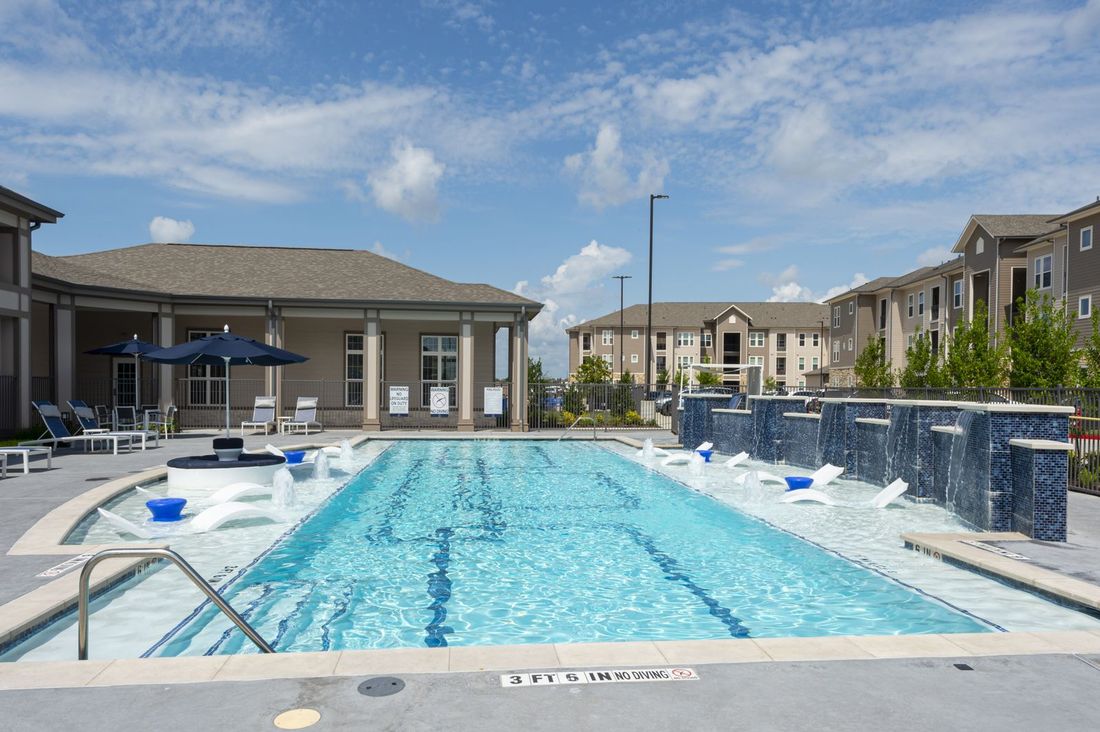
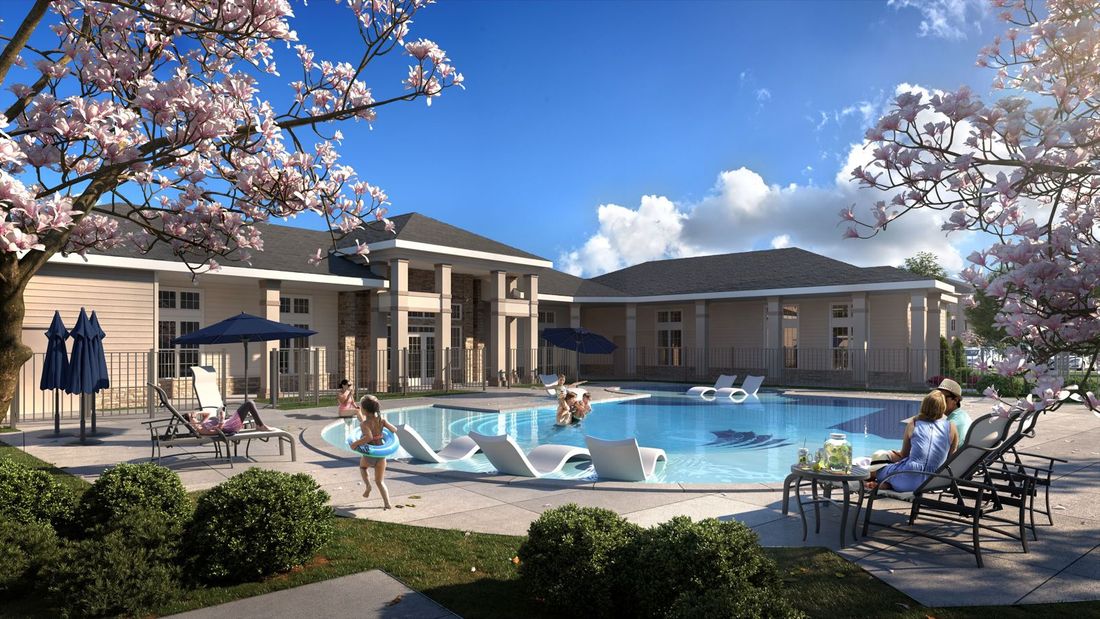
Development asks investors to commit capital to a community that exists only on paper. The design process moves from architectural drawings to high-resolution renderings, and the finished project shows how closely the result matched the plan. The pairs below place the renderings used before construction next to photos of the completed community.
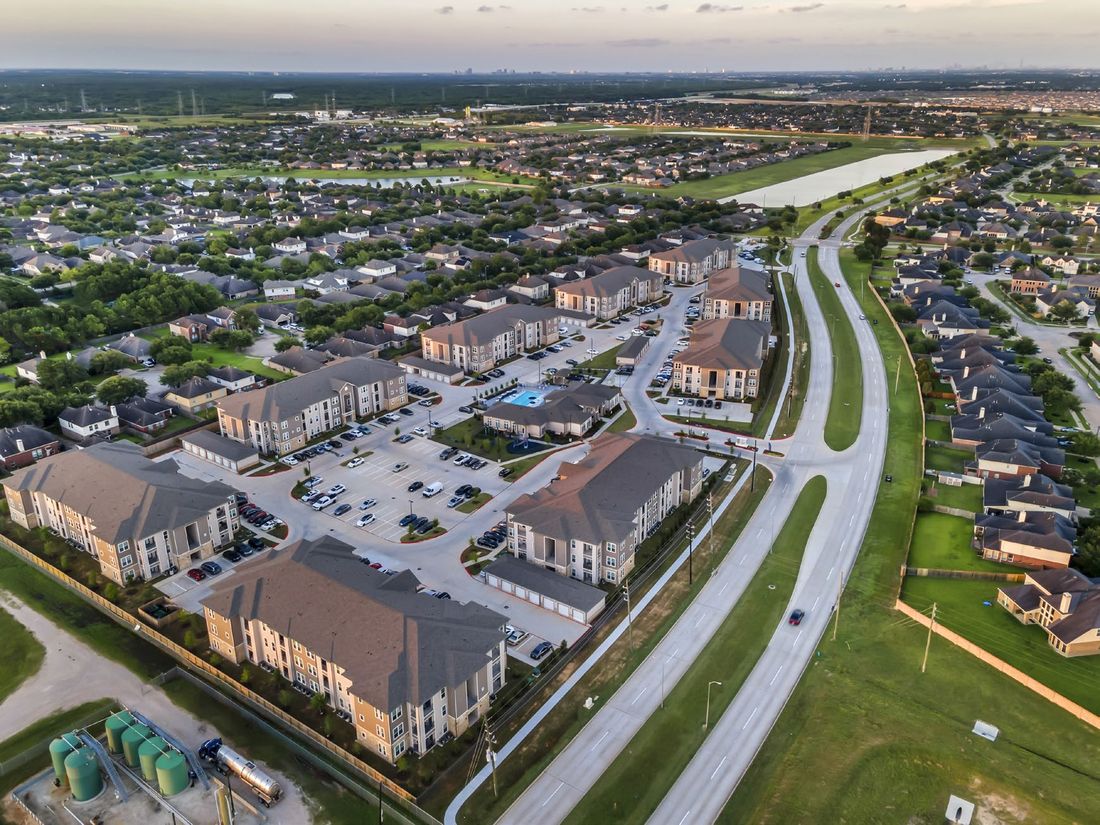
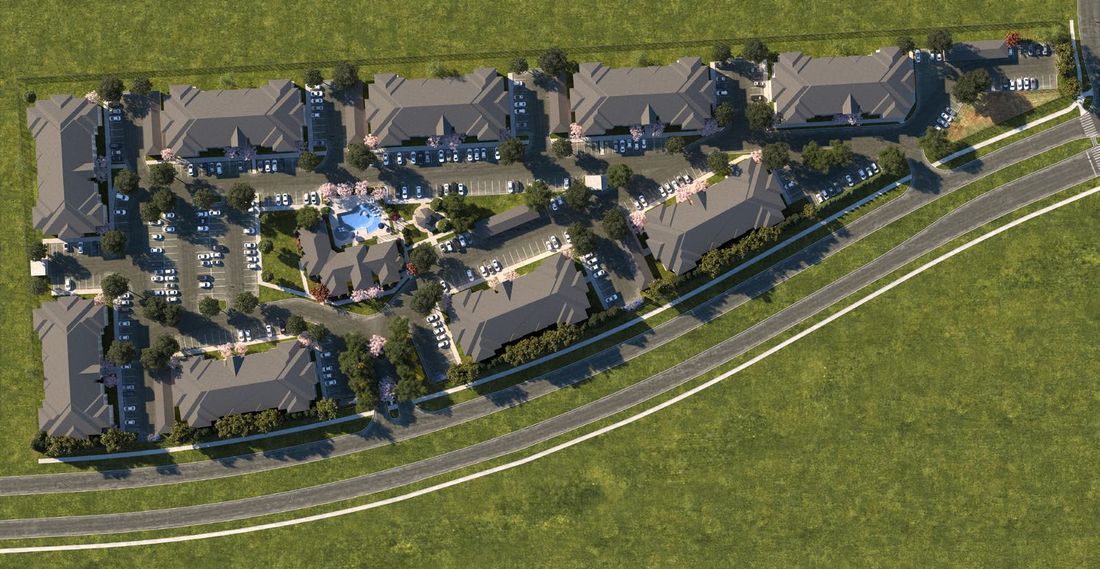
The aerial view follows the site plan closely: the same building footprints, the clubhouse and pool at the center and parking around the edges.
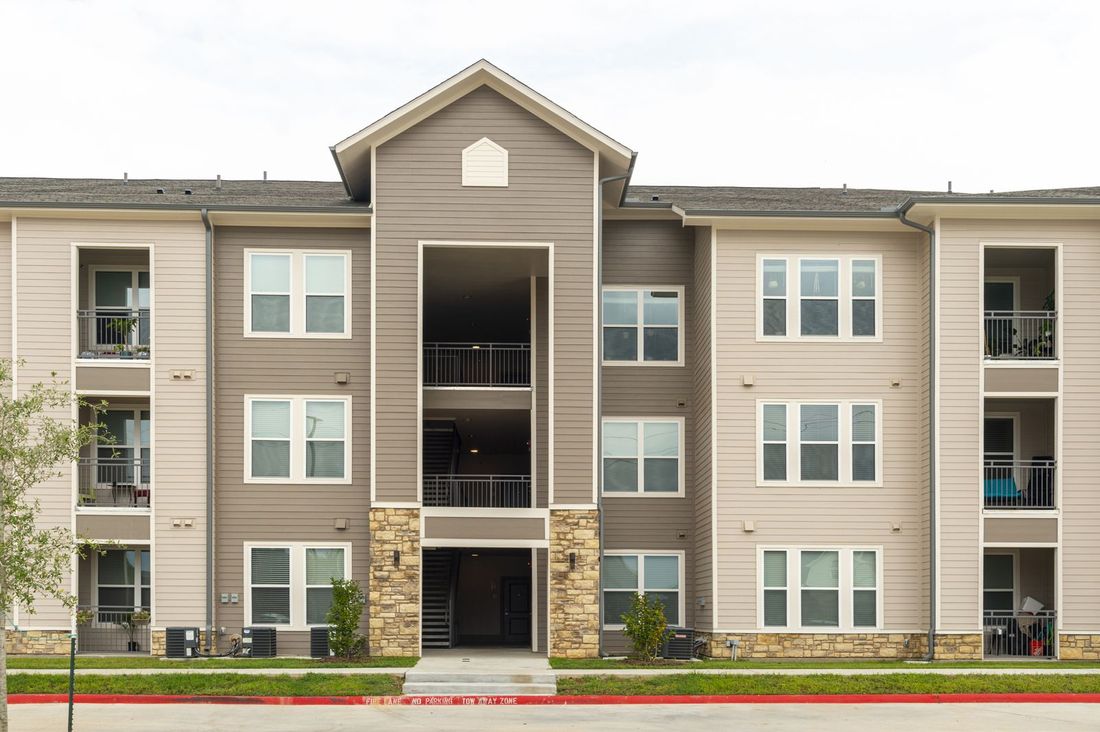
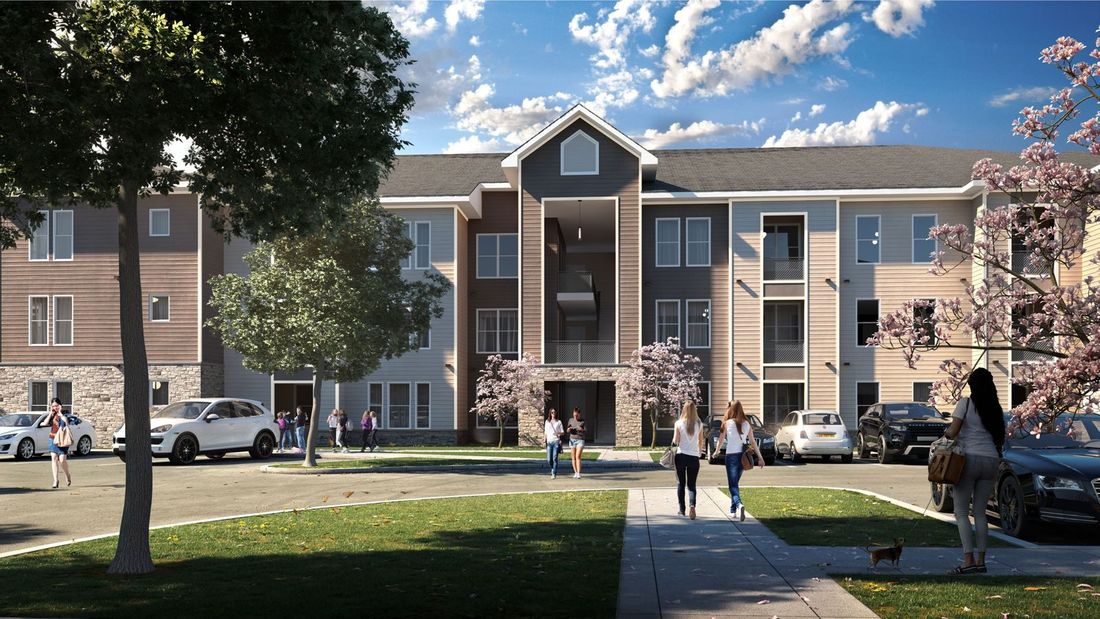
The residential buildings went from elevation drawing to rendering to finished building with the same three-story form, stone and siding exterior, and balcony layout.
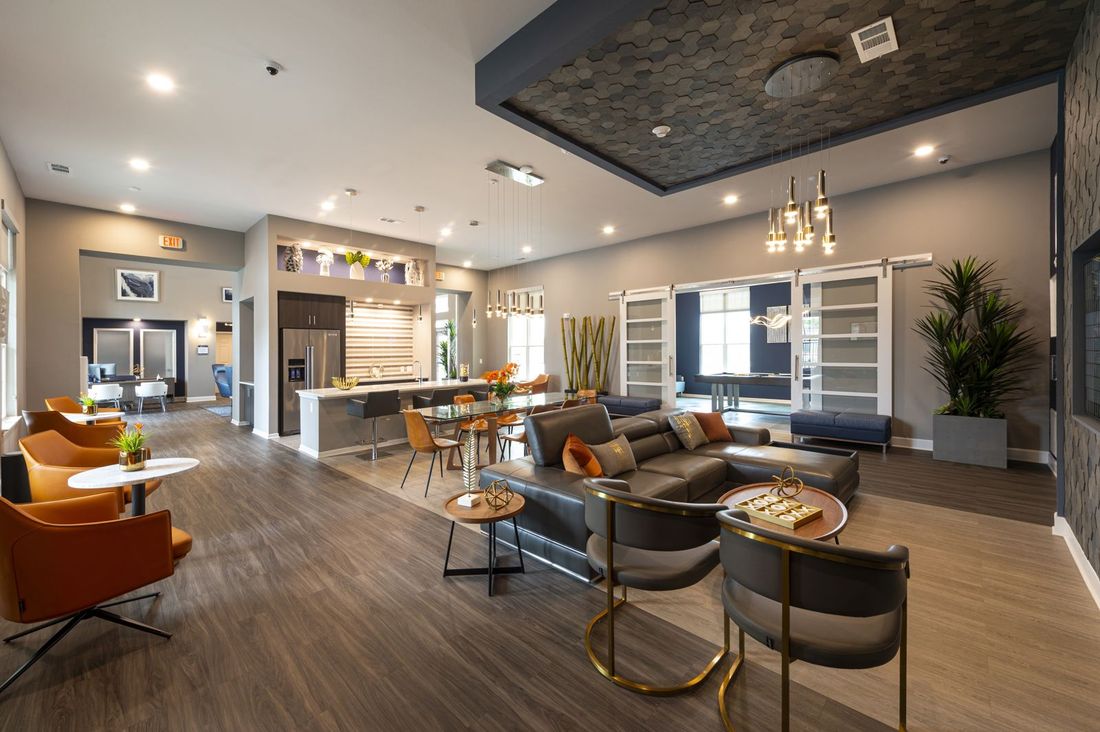
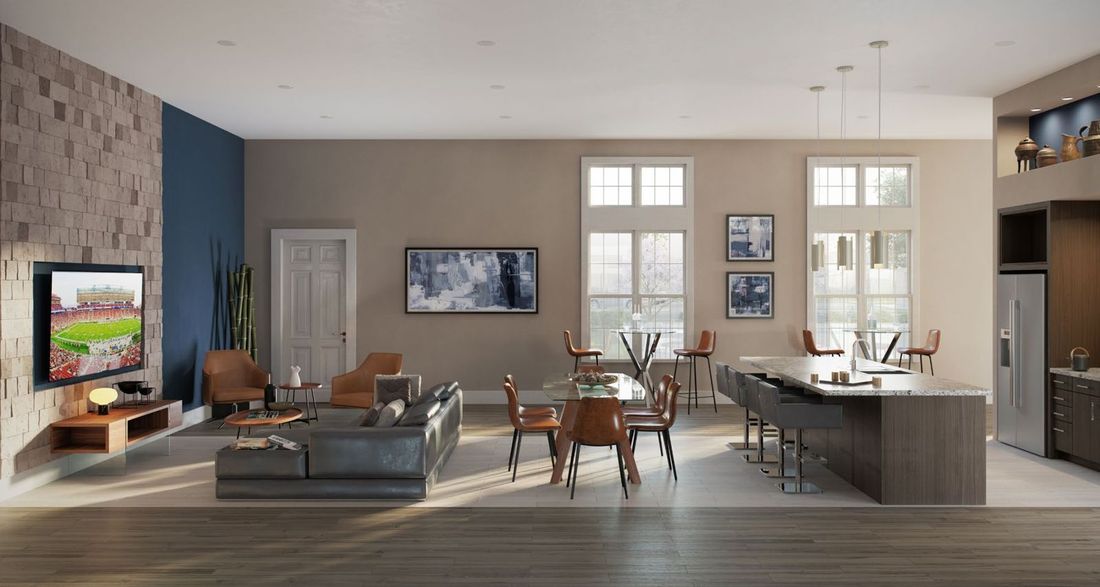
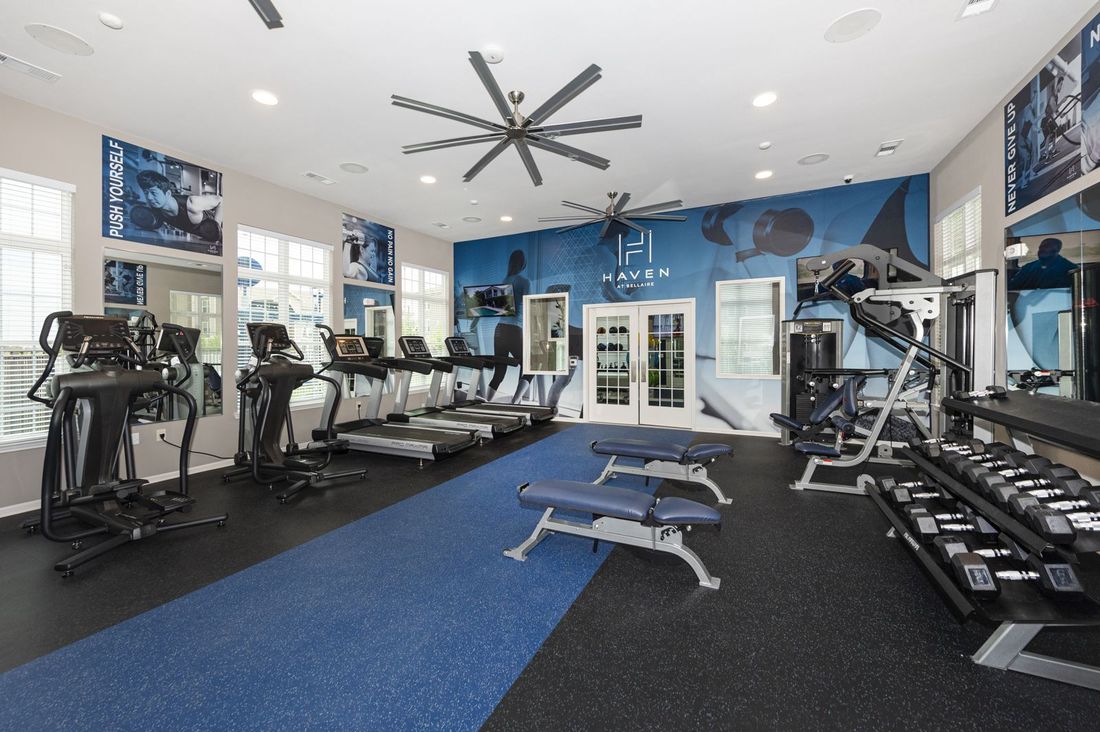
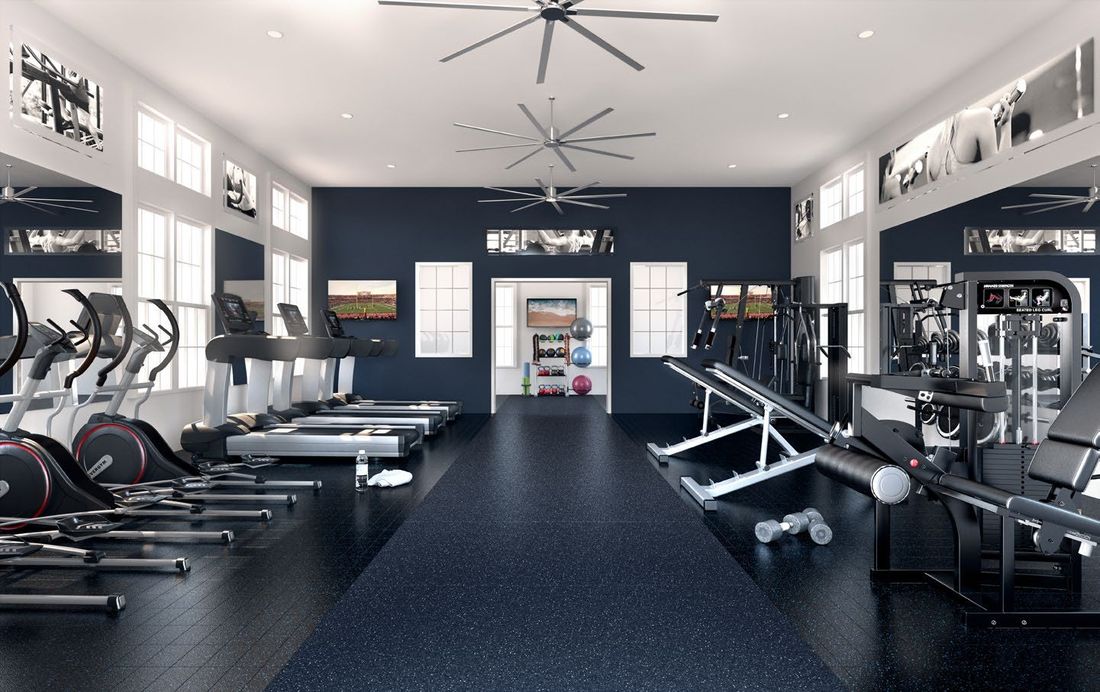
The fitness center: the interior design rendering (left) and the completed space (right).
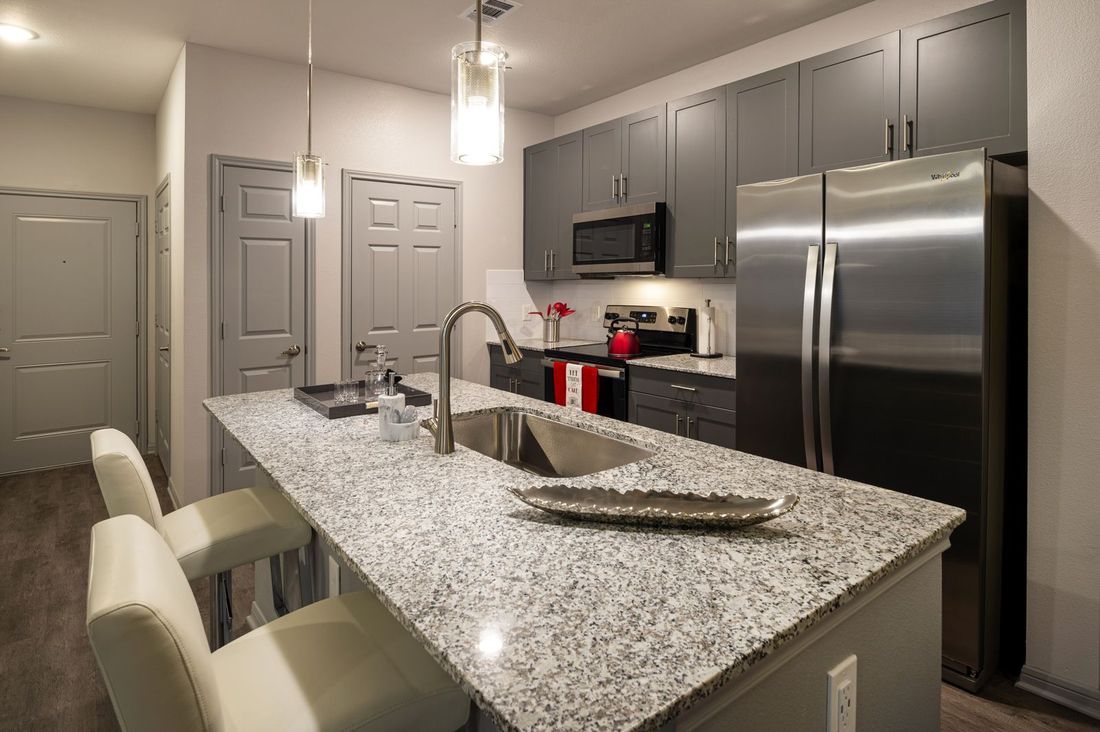
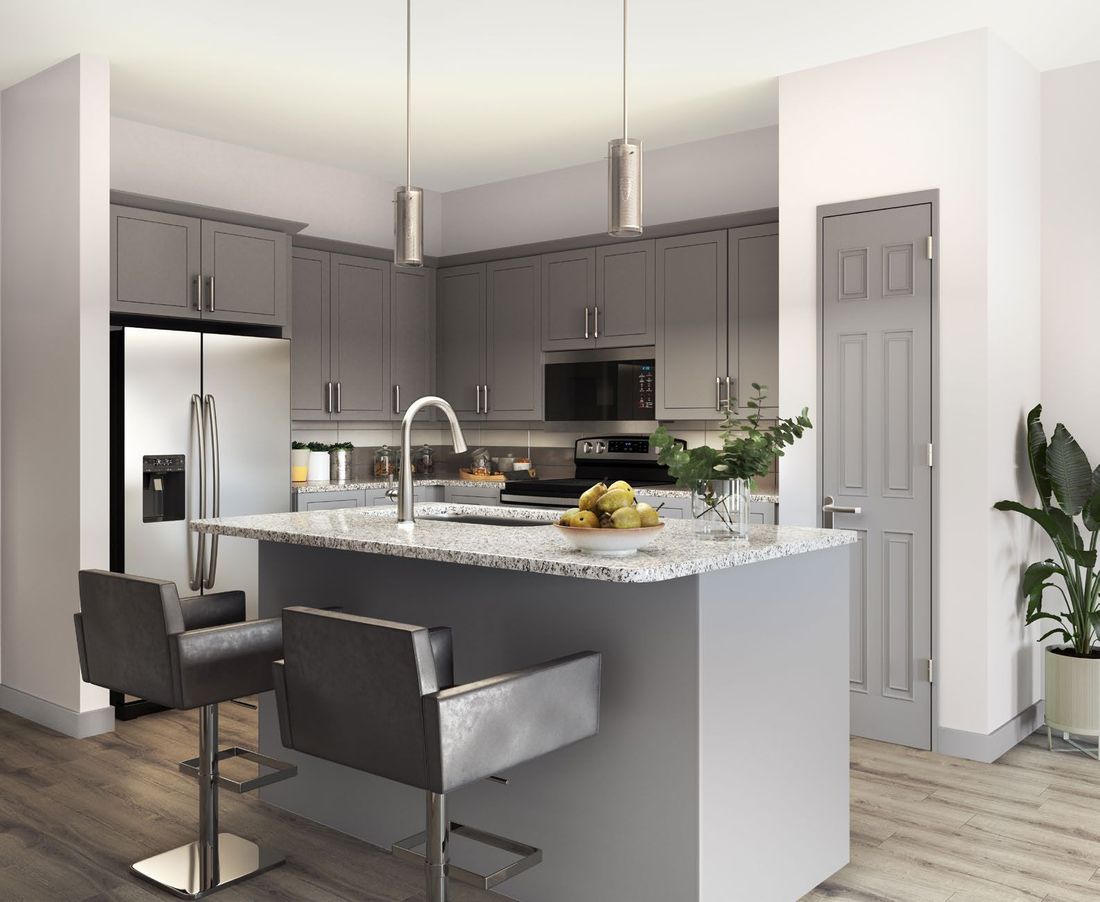
A unit kitchen: the interior design rendering (left) and a completed model unit (right).
The interiors show the in-house interior design team's work carried through: the clubhouse finishes and furniture plan, the fitness center layout, and the unit kitchens with islands, stainless appliances and pendant lighting. For investors, the pairs are a simple test of execution. A sponsor's renderings are only as useful as its ability to deliver what they show.
Lease-up and stabilization (December 2020 to mid-2021)
The first units were ready in December 2020, when the clubhouse and Building 1 were complete. The budget assumed occupancy would build gradually over about 12 months.
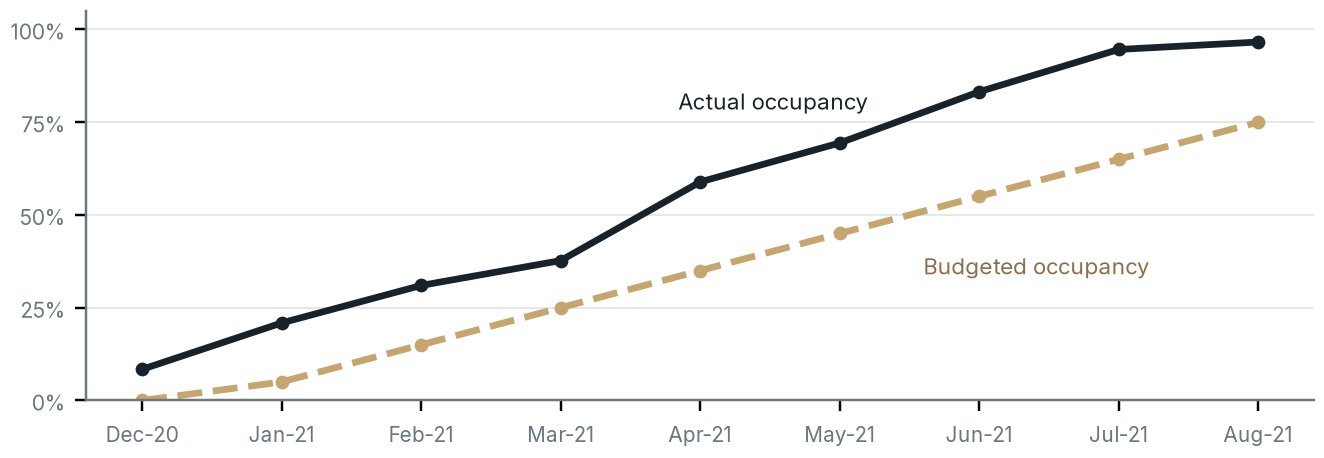
Chart Summary and Key Values
Haven at Bellaire's occupancy chart covers December 2020 through August 2021. Actual occupancy is above budget in every plotted month. Actual occupancy exceeds 75% from June 2021, while the budget line reaches 75% in August 2021. The graph's unlabeled points should not be read as exact additional percentages.
Budgeted versus actual occupancy by month during lease-up. Graphic: Ascendant Development.
The chart compares the plan with the result month by month. The gold dashed line is budgeted occupancy, which rises in steady steps of about 10 points a month and reaches 75% in August 2021. The navy line is actual occupancy. It started above the plan in the first month, at 8.4% against a budget of 0%, and the gap widened from there: by June 2021 actual occupancy was 83.2% against 55% budgeted, and by July it was 94.6%. The project reached stabilization in about 7 months, compared with 12 months in the budget.
The table shows both pre-leasing and occupancy for every month:
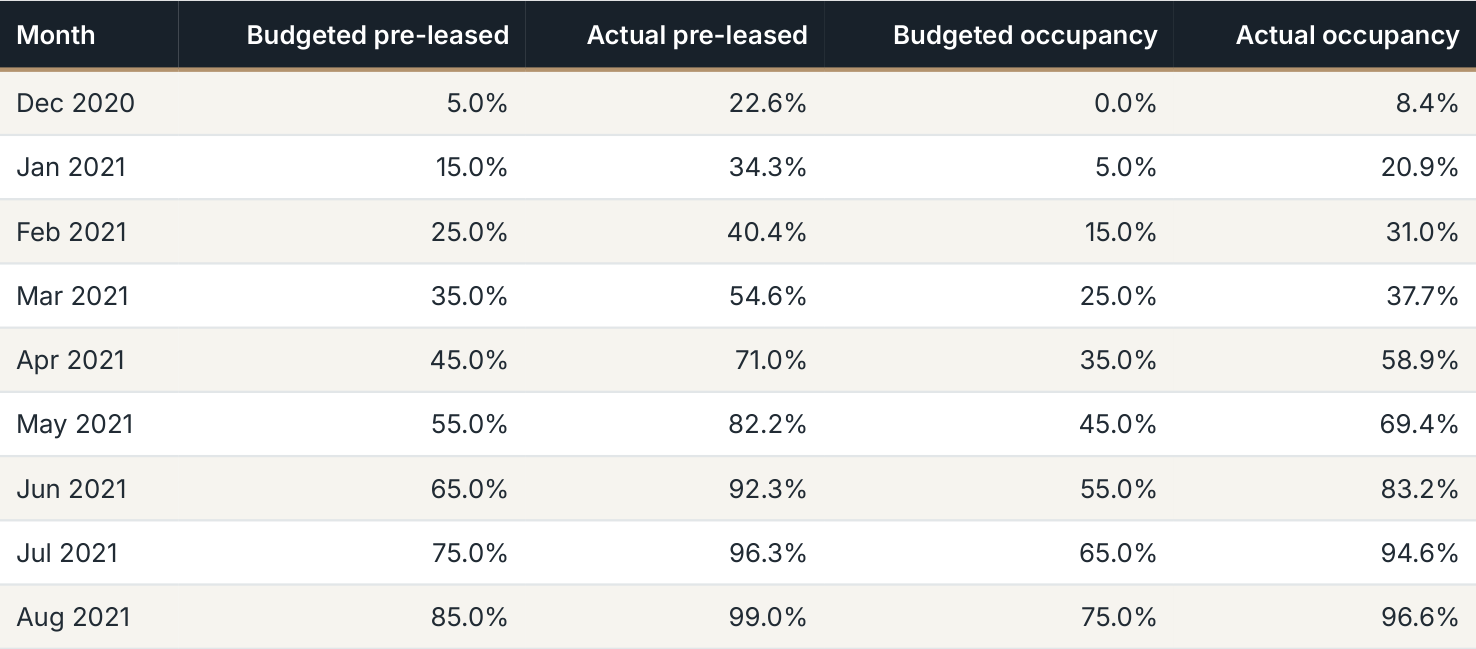
Table Summary and Key Values
| Month | Budgeted pre-leased | Actual pre-leased | Budgeted occupancy | Actual occupancy |
|---|---|---|---|---|
| Dec 2020 | 5.0% | 22.6% | 0.0% | 8.4% |
| Jan 2021 | 15.0% | 34.3% | 5.0% | 20.9% |
| Feb 2021 | 25.0% | 40.4% | 15.0% | 31.0% |
| Mar 2021 | 35.0% | 54.6% | 25.0% | 37.7% |
| Apr 2021 | 45.0% | 71.0% | 35.0% | 58.9% |
| May 2021 | 55.0% | 82.2% | 45.0% | 69.4% |
| Jun 2021 | 65.0% | 92.3% | 55.0% | 83.2% |
| Jul 2021 | 75.0% | 96.3% | 65.0% | 94.6% |
| Aug 2021 | 85.0% | 99.0% | 75.0% | 96.6% |
Pre-leasing (signed leases, including future move-ins) ran ahead of occupancy (residents living on site) throughout, which is normal during lease-up. Faster leasing has a direct effect on the investment: the property reaches its stabilized income sooner, the construction loan can be refinanced or repaid sooner, and the sale can happen earlier.
Broker selection
With the community stabilized, the business plan called for a sale. The first step was choosing an investment sales broker. Ascendant ran a request for proposal (RFP) with four major brokerage firms active in Houston multifamily sales: CBRE, HFF, JLL and Newmark Knight Frank. Each firm was interviewed about its view of pricing, its likely buyer pool and its marketing plan. Newmark was chosen as the best fit for this location and asset, and the listing agreement was signed on July 24, 2021.
A competitive broker selection gives the seller several independent views of value before the property goes to market, and it helps match the property with the team that knows the most likely buyers.
The sales process
The property was marketed publicly, with a structured bid process designed to create competition among buyers. The full timeline:
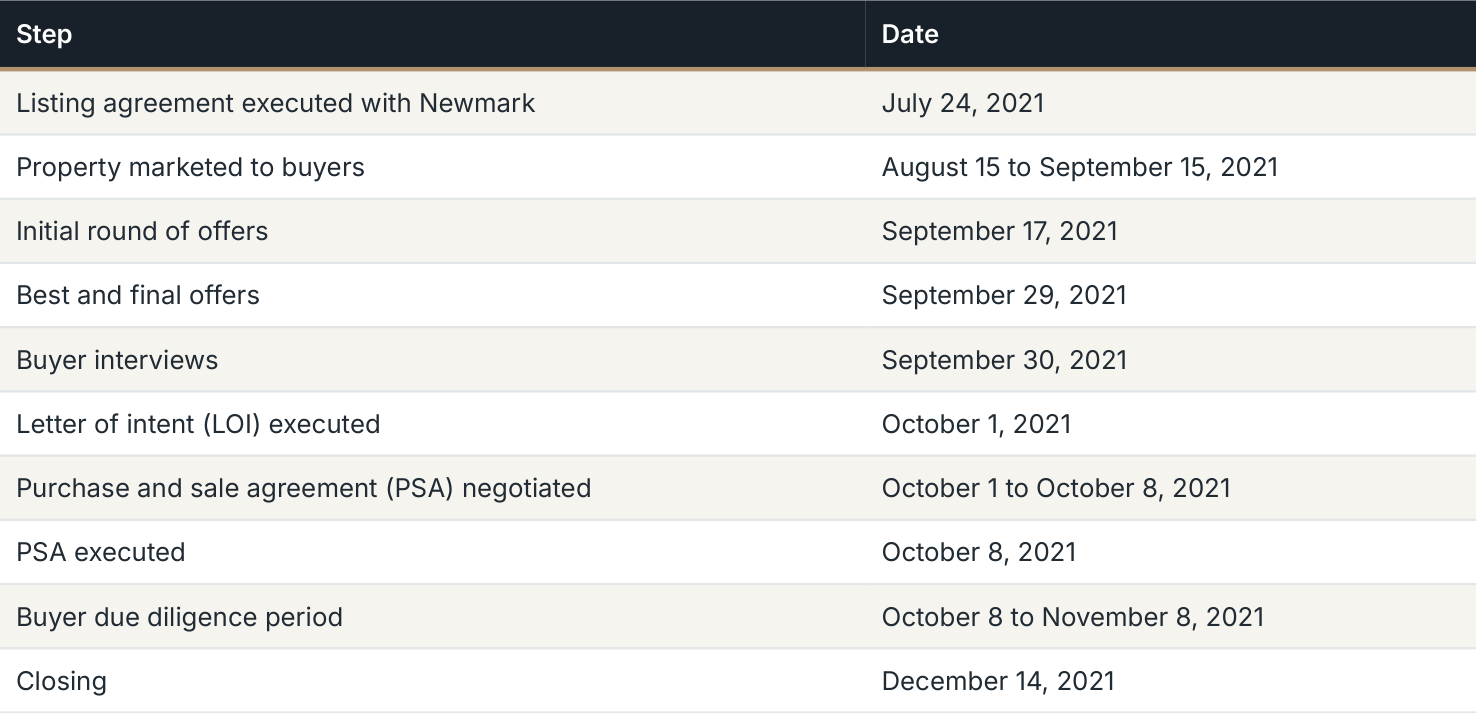
Table Summary and Key Values
| Step | Date |
|---|---|
| Listing agreement executed with Newmark | July 24, 2021 |
| Property marketed to buyers | August 15 to September 15, 2021 |
| Initial round of offers | September 17, 2021 |
| Best and final offers | September 29, 2021 |
| Buyer interviews | September 30, 2021 |
| Letter of intent (LOI) executed | October 1, 2021 |
| Purchase and sale agreement (PSA) negotiated | October 1 to October 8, 2021 |
| PSA executed | October 8, 2021 |
| Buyer due diligence period | October 8 to November 8, 2021 |
| Closing | December 14, 2021 |
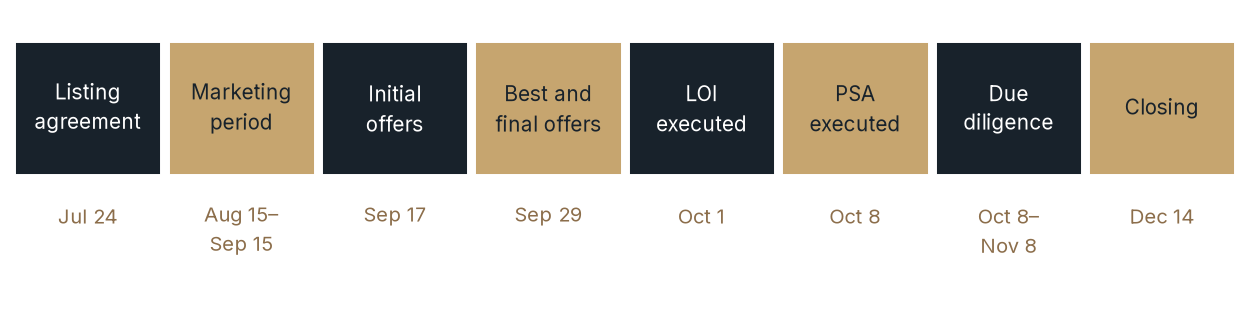
Chart Summary and Key Values
The sale-process milestones shown are listing agreement July 24; marketing August 15–September 15; initial offers September 17; best and final offers September 29; LOI executed October 1; purchase and sale agreement executed October 8; due diligence October 8–November 8; and closing December 14. These are historical project milestones, not a promised future sale timeline.
Sale process milestones in 2021, from listing agreement to closing. Graphic: Ascendant Development.
The process moved in clear stages. After about three weeks of preparation, Newmark marketed the property for a month. Two days after marketing ended, initial offers came in; the strongest bidders were invited to submit best and final offers 12 days later, and the finalists were interviewed the next day. Interviews let the seller weigh more than price, including each buyer's ability to close and its track record of completing deals on the terms it offered.
The winning buyer signed a letter of intent on October 1, and the purchase and sale agreement was negotiated and signed within a week. The buyer then had a month of due diligence to inspect the property, review leases and confirm its financing, and the sale closed on December 14, 2021. From listing to closing took about five months, and the sale closed about 28 months after equity closed (858 days), compared with a 36-month hold in the pro forma. The sale price was $56,000,000, or about $188,552 per unit.
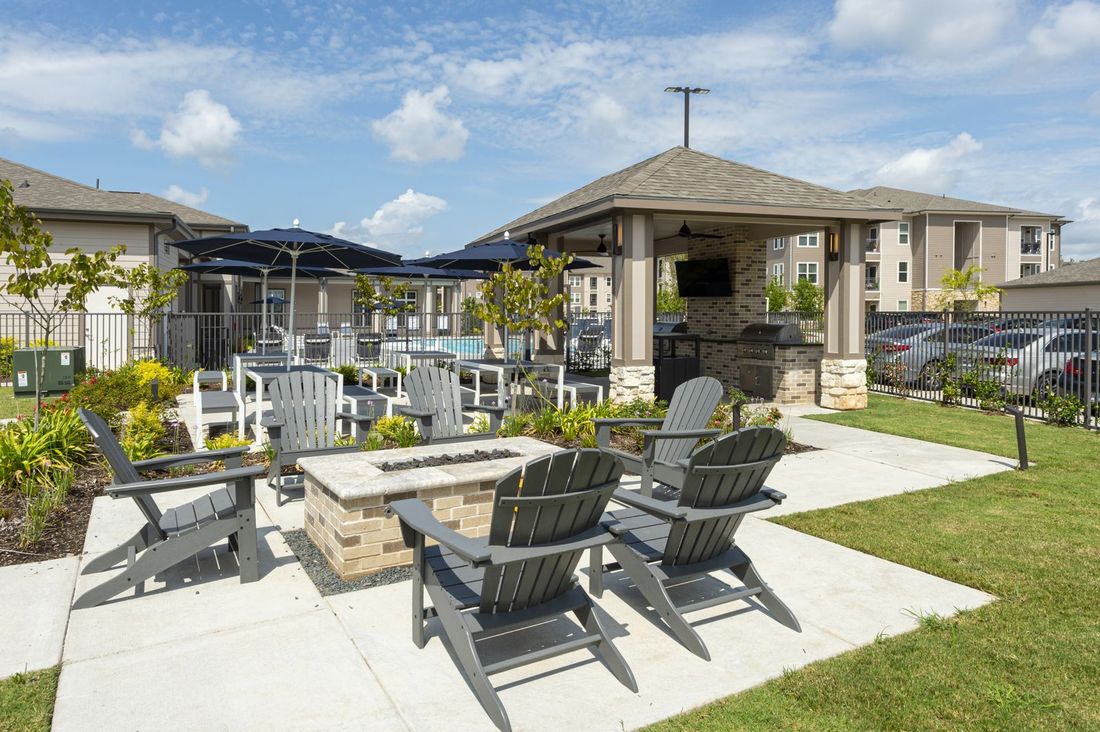
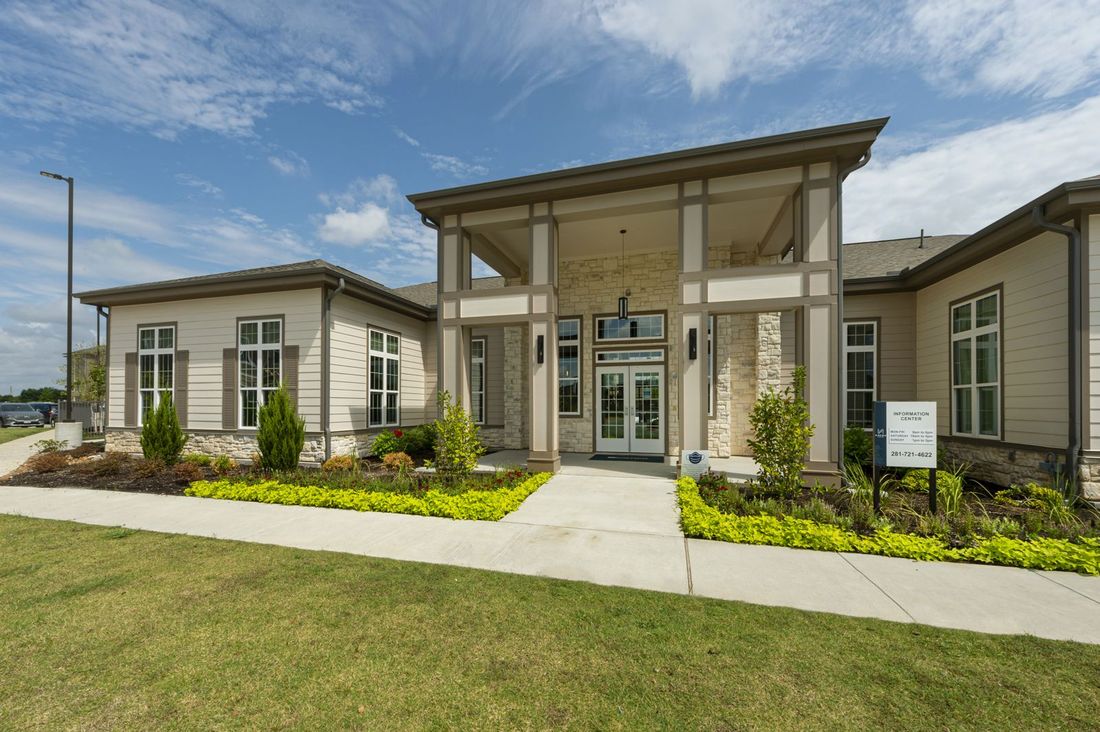
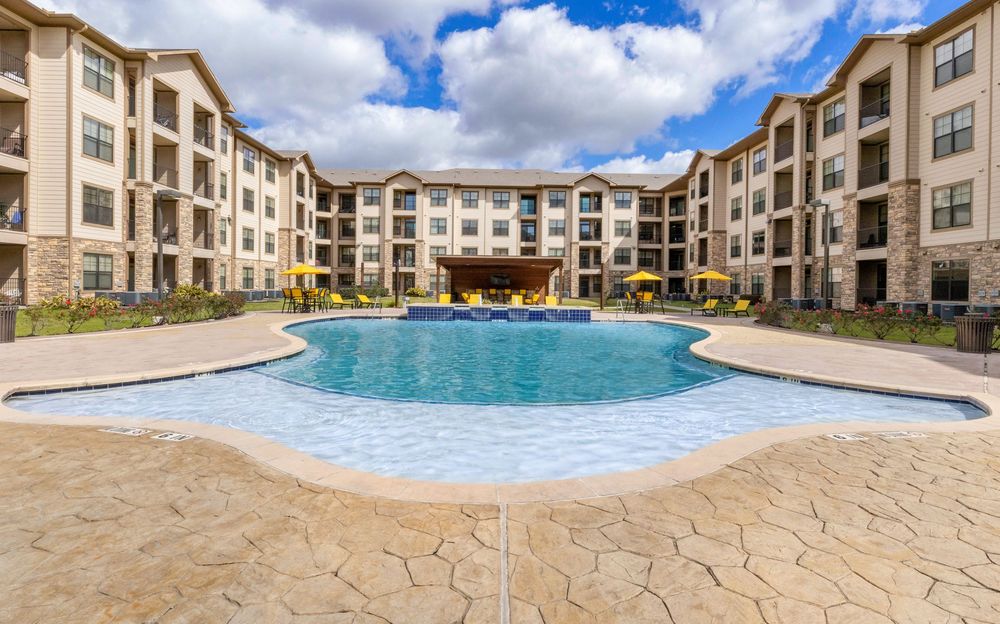
Haven at Bellaire, Richmond, TX · garden: the courtyard fire pits (left) and the clubhouse entrance (right).
How long it took
From site identification on May 15, 2018, to closing on December 14, 2021, the project took 1,309 days, or about 3.6 years. Investors' capital was committed from August 9, 2019, to December 14, 2021: 858 days, or about 2.3 years. The difference, about 15 months, reflects the pre-development work the sponsor completed before investor equity was called: finding the site, completing due diligence, designing the community and securing the permit set and construction pricing.
Project in review
The last step in any development is to compare the result with the original plan. The tables below show the pro forma used when the project was capitalized next to the actual results.
Capitalization. The total budget held, finishing about $364,000 under the pro forma:
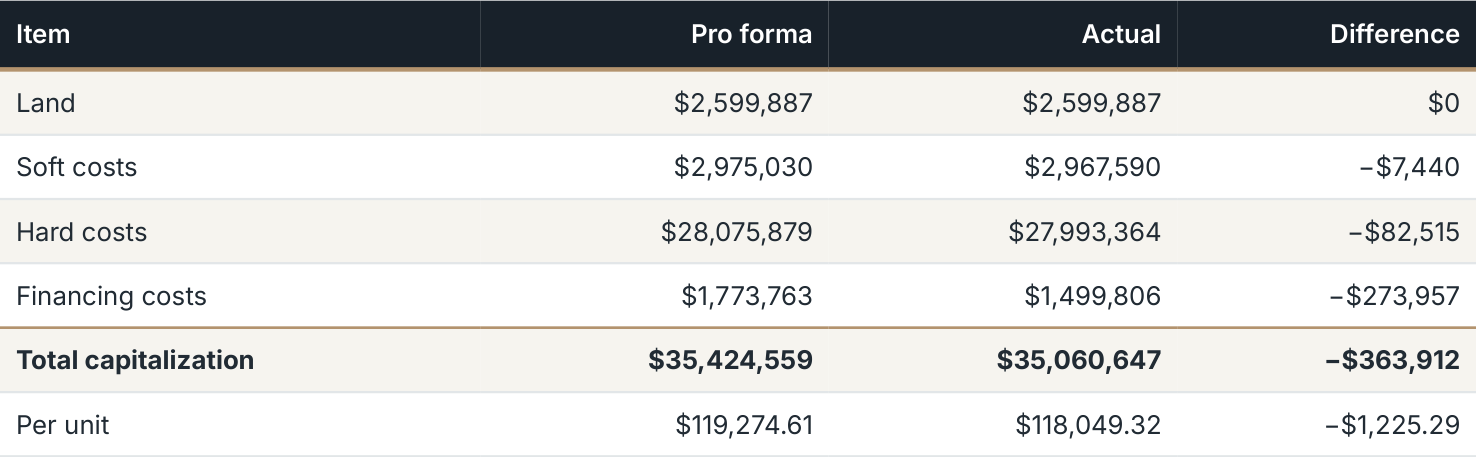
Table Summary and Key Values
| Item | Pro forma | Actual | Difference |
|---|---|---|---|
| Land | $2,599,887 | $2,599,887 | $0 |
| Soft costs | $2,975,030 | $2,967,590 | −$7,440 |
| Hard costs | $28,075,879 | $27,993,364 | −$82,515 |
| Financing costs | $1,773,763 | $1,499,806 | −$273,957 |
| Total capitalization | $35,424,559 | $35,060,647 | −$363,912 |
| Per unit | $119,274.61 | $118,049.32 | −$1,225.29 |
Most of the savings came from financing costs, which were about $274,000 lower than budgeted. Lower financing costs are consistent with buildings finishing early and the community leasing up quickly, which would result in less use of the interest reserve. Hard costs, the largest item, came in about $83,000 under budget, consistent with a guaranteed maximum price contract.
Operations, value and timing
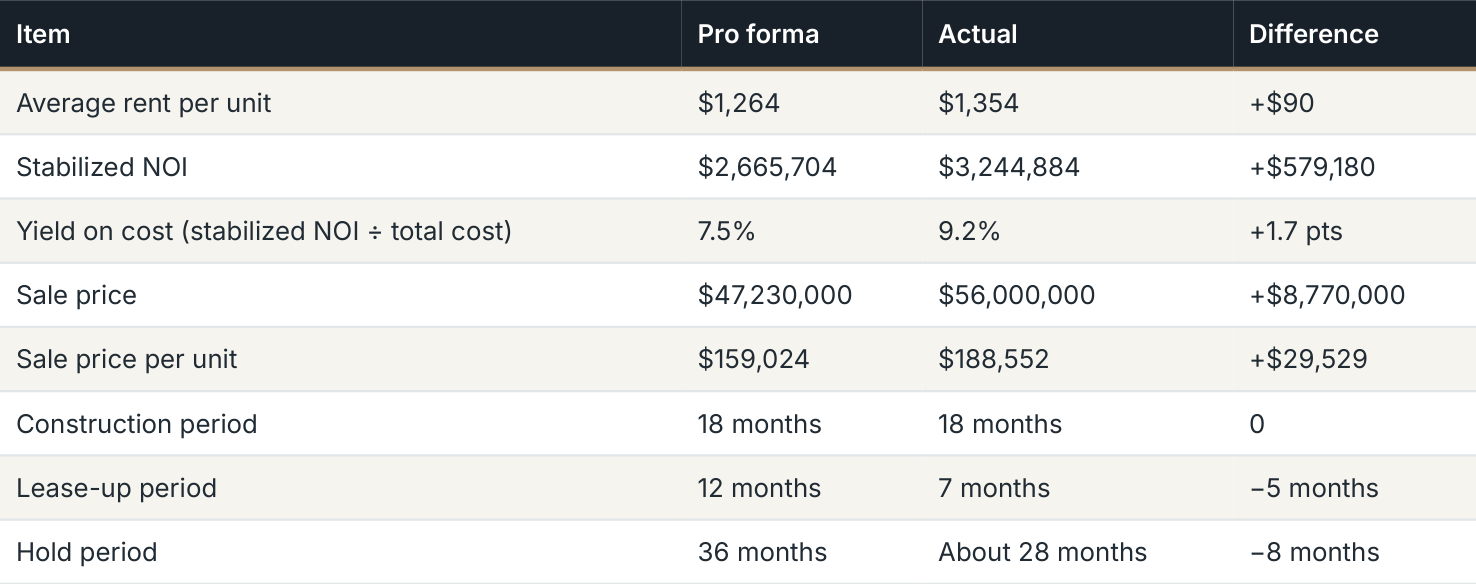
Table Summary and Key Values
| Item | Pro forma | Actual | Difference |
|---|---|---|---|
| Average rent per unit | $1,264 | $1,354 | +$90 |
| Stabilized NOI | $2,665,704 | $3,244,884 | +$579,180 |
| Yield on cost (stabilized NOI ÷ total cost) | 7.5% | 9.2% | +1.7 pts |
| Sale price | $47,230,000 | $56,000,000 | +$8,770,000 |
| Sale price per unit | $159,024 | $188,552 | +$29,529 |
| Construction period | 18 months | 18 months | 0 |
| Lease-up period | 12 months | 7 months | −5 months |
| Hold period | 36 months | About 28 months | −8 months |
Rents beat the plan by about $90 per unit per month, and stabilized NOI was about 22% higher than projected. With a lower cost and higher income, the yield on cost rose from 7.5% to 9.2%. Because the project was built at cost, the difference between the $35.1M cost and the $56.0M sale price reflects value created through development.
The sale price implies a cap rate of about 5.8% on in-place stabilized NOI ($3,244,884 ÷ $56,000,000), above the 4.50% to 5.00% market range noted earlier. The gap is typical for Texas sales: property taxes are reassessed toward the sale price after a sale, so buyers underwrite NOI after a higher assumed tax bill. Measured on the buyer's adjusted NOI, the cap rate is lower than it appears on the seller's in-place NOI.
Returns. The project-level returns compare the plan with the result for all equity combined:

Table Summary and Key Values
| Measure | Projected (pro forma) | Actual | Difference |
|---|---|---|---|
| Project IRR | 29.6% | 56.6% | +27.0 pts |
| Project equity multiple | 2.2x | 2.9x | +0.7x |
At the project level, total equity of $11,324,559 invested on August 9, 2019, returned $32,489,866.64 at the December 14, 2021 closing, an equity multiple of 2.87x (2.9x rounded) and an IRR of 56.57%. After the distribution waterfall, the LP equity of $10,192,103 received $23,093,687.87, an equity multiple of 2.27x and an IRR of 41.62%. The LP returns are net of all fees, including the developer fee, the asset management fee and the promote. The difference between the project-level and LP returns reflects the sponsor's share of profits under the waterfall.
These are the results of one completed project. Past performance does not guarantee future results, and other projects can face cost increases, slower leasing or weaker pricing at sale.
What this example does not show
This example does not show what any future project will do. The project was completed and sold in a strong market for new Class A units. Investors evaluating any development should read its offering documents, including the risk factors, and ask how the sponsor's past projects performed against their original budgets.
The bottom line
One completed project traced from site to sale shows the full lifecycle of a development. Pre- development took about 15 months, construction 18 months, lease-up 7 months and the sale process about 5 months. The clearest lessons are in the comparison with the pro forma: a site bought off- market, a construction price fixed before equity closed, a budget that held and leasing that ran ahead of plan.
A selection of Ascendant communities
Haven at Westgreen, Katy, TX · garden Haven at Thorpe Lane, San Marcos, TX · mid- rise
Join the Multifamily Development Lifecycle Investor List
To talk through development investing with the Ascendant team, visit https:// www.ascendantdevco.com/invest-with-us or call Ascendant Development at 713.600.9393.
Join the Multifamily Development Lifecycle Investor List
Sign up for Multifamily Development Lifecycle investor updates →
Scan the code to join the Multifamily Development Lifecycle Investor List.
S O U R C E S
1. U.S. Bureau of Labor Statistics, Houston Area Employment, July 2018. https://www.bls.gov/regions/southwest/news-release/2018/ areaemployment_houston_20180827.htm
2. U.S. Census Bureau, QuickFacts: Fort Bend County, Texas. https://www.census.gov/quickfacts/fact/table/fortbendcountytexas/ POP010210
3. Texas State Library and Archives Commission, Texas County Population Estimates, 2010–2017. https://www.tsl.texas.gov/ref/abouttx/ popcnty2010-11.html
4. U.S. Census Bureau, Small Area Income and Poverty Estimates, median household income, Fort Bend County, Texas, 2018 and 2019 (FRED series MHITX48157A052NCEN). https://fred.stlouisfed.org/series/MHITX48157A052NCEN
5. CBRE Research, North America Cap Rate Survey, Second Half 2019, U.S. Multifamily Suburban key rates (Houston, Class A stabilized).
6. U.S. Census Bureau, Average Length of Time from Start to Completion of New Privately Owned Residential Buildings. https:// www.census.gov/construction/nrc/pdf/avg_starttocomp.pdf
I M P O R TA N T D I S C L O S U R E S
This article is for educational purposes only and is not an offer to sell or a solicitation of an offer to buy any security. Any offering by Ascendant Development or its affiliates is made only to verified accredited investors under Rule 506(c) of Regulation D through definitive offering documents, which should be read in full, including the risk factors. Real estate development involves risk, including the possible loss of principal, and is illiquid. Nothing here is tax, legal or investment advice; consult your own advisors. Forward-looking statements are not guarantees. Results shown are for one selected completed project and are not representative of all Ascendant projects. Photographs show completed or existing Ascendant projects. They are shown to illustrate the firm's work and do not represent any specific current offering.
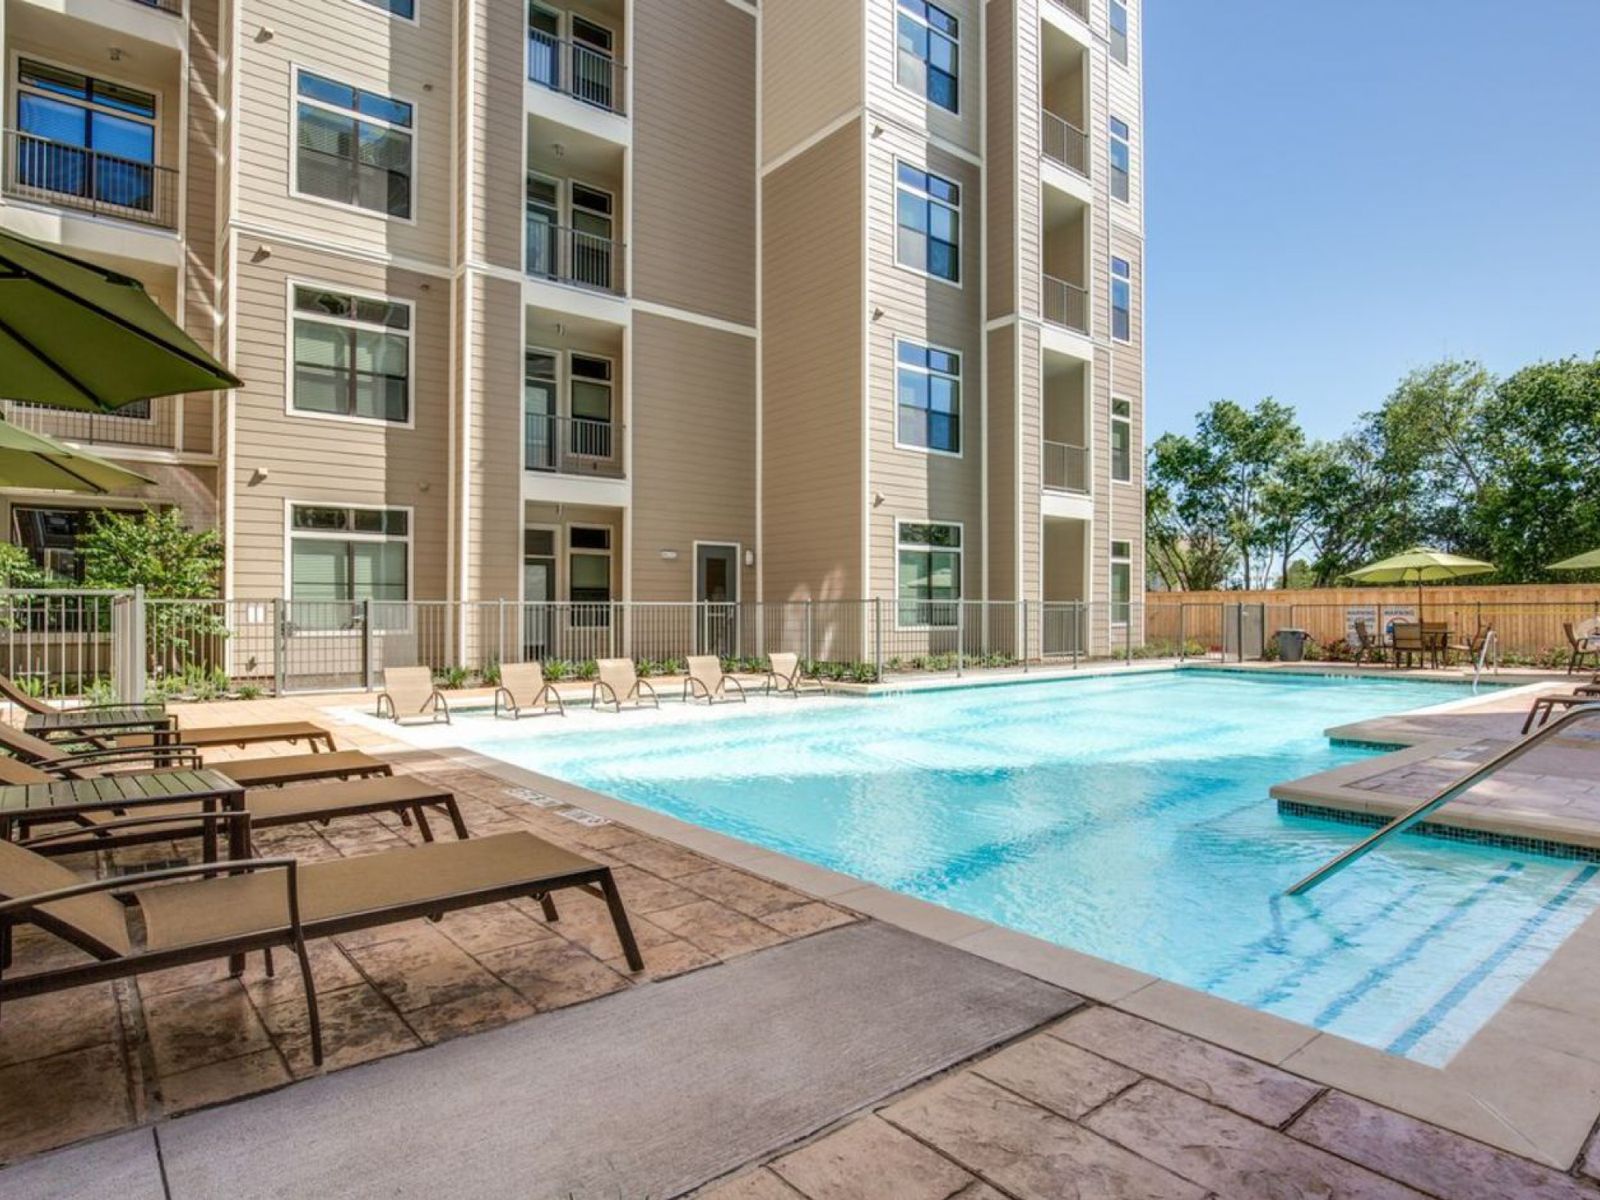
Haven at Main, Houston, Texas.
- Source 1 on report page 17
- Source 2 on report page 17
- Source 3 on report page 17
- Source 4 on report page 17
- Source 5 on report page 17
- Source 6 on report page 17
- Source 7 on report page 17
- Source 8 on report page 17
For educational purposes only. Not an offer to sell or a solicitation of an offer to buy any security. Any offering will be made only to verified accredited investors under Rule 506(c) of Regulation D through definitive offering documents. Past performance does not guarantee future results.