
Key takeaways from the report
Dallas-Fort Worth spent 2023 through 2025 absorbing one of the largest apartment supply waves of any U.S. metro.
For a development sponsor, the question is less about today's rents and more about the market a project will deliver into.
It is not an offer to sell, or a solicitation of an offer to buy, any security, and it contains no deal terms or return projections.
Executive summary
Dallas-Fort Worth spent 2023 through 2025 absorbing one of the largest apartment supply waves of any U.S. metro. DFW completed more than 29,000 units in 2023, 14% above its annual average since 2017,1 and the wave peaked in 2024 at a record 44,218 units.2 That wave is now draining. New construction starts have fallen sharply, quarterly deliveries are at multi-year lows, and renter demand has caught up. In Q2 2026, DFW absorbed roughly twice as many units as it delivered (12,180 vs. 6,238).3
For a development sponsor, the question is less about today's rents and more about the market a project will deliver into. A multifamily development that breaks ground in 2026 or 2027 typically opens in 2028 or later, after much of today's pipeline has been leased up and when relatively few competing projects will be opening. It also looks back at DFW's last supply cycle, when rents rebounded after the construction pipeline shut off, and covers the data behind that view, the real risks that can upend it, and how disciplined development sponsors manage those risks.
What this report is and isn't. This is an educational market overview. It is not an offer to sell, or a solicitation of an offer to buy, any security, and it contains no deal terms or return projections. See the full disclosures on the final page.
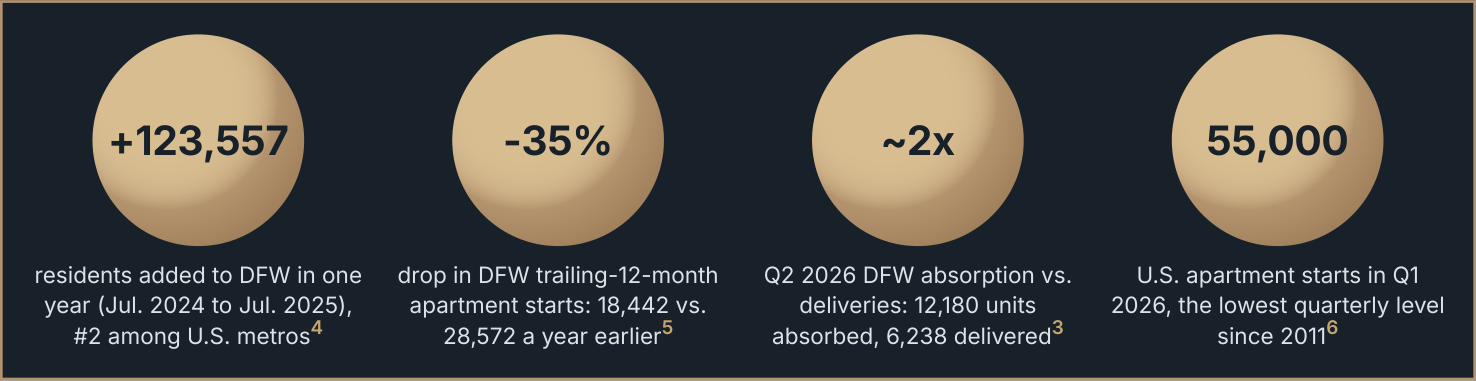
Chart Summary and Key Values
DFW added 123,557 residents from July 2024 to July 2025, second among U.S. metros (source 4). DFW trailing-twelve-month apartment starts fell 35%, to 18,442 from 28,572 a year earlier (source 5). Q2 2026 absorption was about twice deliveries: 12,180 units absorbed versus 6,238 delivered (source 3). U.S. apartment starts were 55,000 in Q1 2026, the lowest quarterly level since 2011 (source 6).
1. DFW growth: people and paychecks
BOTTOM LINE DFW is adding people and jobs faster than almost any other U.S. metro, and Grand Prairie sits in the middle of it.
Population: the nation's #2 growth engine
The Dallas-Fort Worth-Arlington metro added 123,557 residents
123,557
between July 2024 and July 2025, reaching 8,477,157. That is the second-largest numeric gain in the country, just behind Houston
residents added to the DFW metro, July 2024 to July 2025 (Census)4
(+126,720).4 The growth came from three sources: natural increase (about 50,800), international migration (about 55,400) and domestic migration (about 18,200).7 Since April 2020, the metro has grown 11.0%. It gained about 270,000 residents through net domestic migration over that period, nearly 40% more than any other U.S. metro.8
Jobs: still growing, at a moderate pace
DFW added 54,600 nonfarm jobs (+1.3%) in the year ending June 2026,
+14.6%
according to the BLS. That was the second-largest numeric gain among large U.S. metros, behind New York.10 The Dallas metropolitan division
Dallas metro division job growth since Feb. 2020 (Dallas Fed)9
has grown employment 14.6% since February 2020, compared with 11.4% for Texas and 4.5% for the nation. Hiring picked up to an annualized 2.0% from May to August 2026.9 The Dallas Fed lowered its 2026 Texas forecast to 1.2% job growth in September, below the state's long-run average of about 2%.11 Job growth is positive but not booming, which is why underwriting should be stress-tested against slower growth.
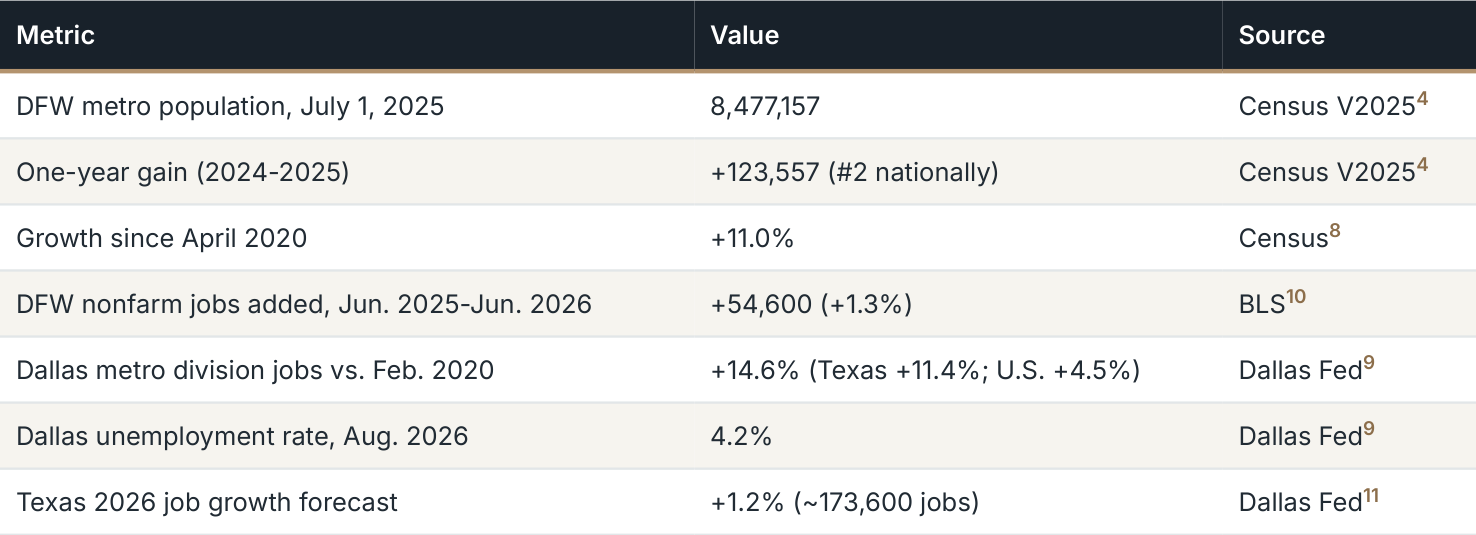
Table Summary and Key Values
| Metric | Value | Source |
|---|---|---|
| DFW metro population, July 1, 2025 | 8,477,157 | Census V20254 |
| One-year gain (2024-2025) | +123,557 (#2 nationally) | Census V20254 |
| Growth since April 2020 | +11.0% | Census8 |
| DFW nonfarm jobs added, Jun. 2025-Jun. 2026 | +54,600 (+1.3%) | BLS10 |
| Dallas metro division jobs vs. Feb. 2020 | +14.6% (Texas +11.4%; U.S. +4.5%) | Dallas Fed9 |
| Dallas unemployment rate, Aug. 2026 | 4.2% | Dallas Fed9 |
| Texas 2026 job growth forecast | +1.2% (~173,600 jobs) | Dallas Fed11 |
Grand Prairie: centrally located and still growing
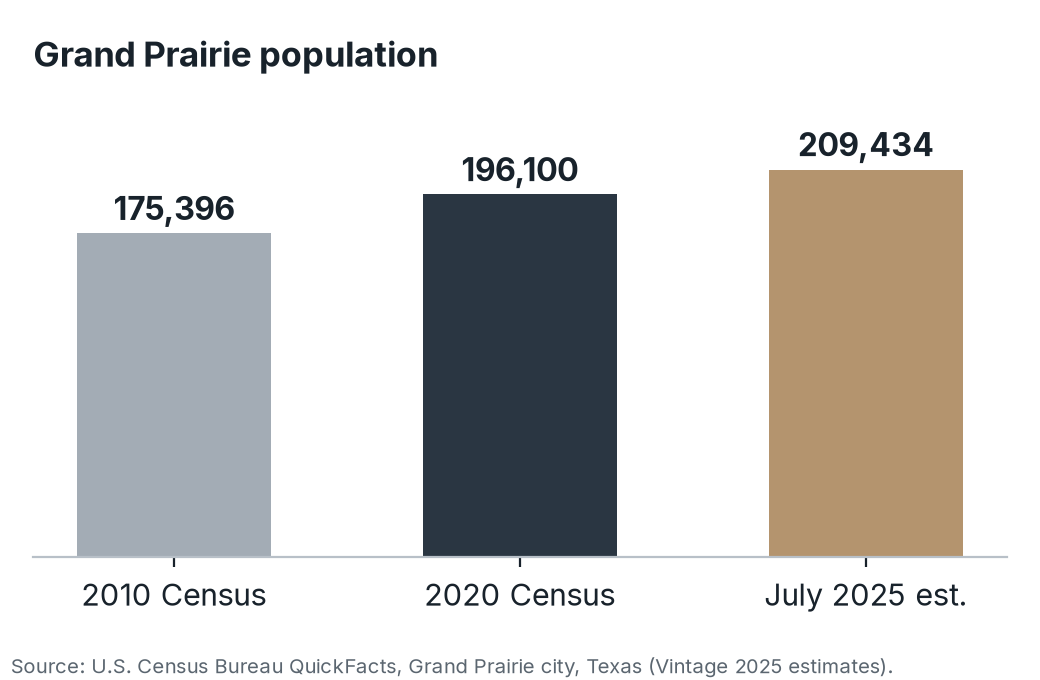
Chart Summary and Key Values
Grand Prairie population: 175,396 in the 2010 Census, 196,100 in the 2020 Census and an estimated 209,434 in July 2025. The July 2025 value is a Census estimate, not a new decennial count.
Grand Prairie has added more than 34,000 residents since 2010.
Grand Prairie's population reached an estimated 209,434 in July 2025. That is up 6.8% since 2020 and up from 175,396 in 2010.12 The city sits between Dallas and Fort Worth. Its northern border is 5 to 10 minutes south of DFW International Airport, and it is crossed by I-30, I-20, SH-161 (President George Bush Turnpike) and SH-360. According to the city, the median household income is $74,275 and the median age is 33.1, a profile that fits the core renter demographic.13
2. Demand drivers near Grand Prairie
BOTTOM LINE Grand Prairie's renter demand rests on a diverse base of defense, logistics, manufacturing and entertainment employers.
Apartment demand follows jobs. Grand Prairie has an unusually diverse
$9.8B
base of employers, spanning aerospace and defense, advanced manufacturing, logistics and entertainment, and it sits within a short
U.S. Army PAC-3 MSE contract won by Lockheed Martin Missiles and Fire Control, headquartered in Grand Prairie14
drive of several of DFW's largest employment centers.
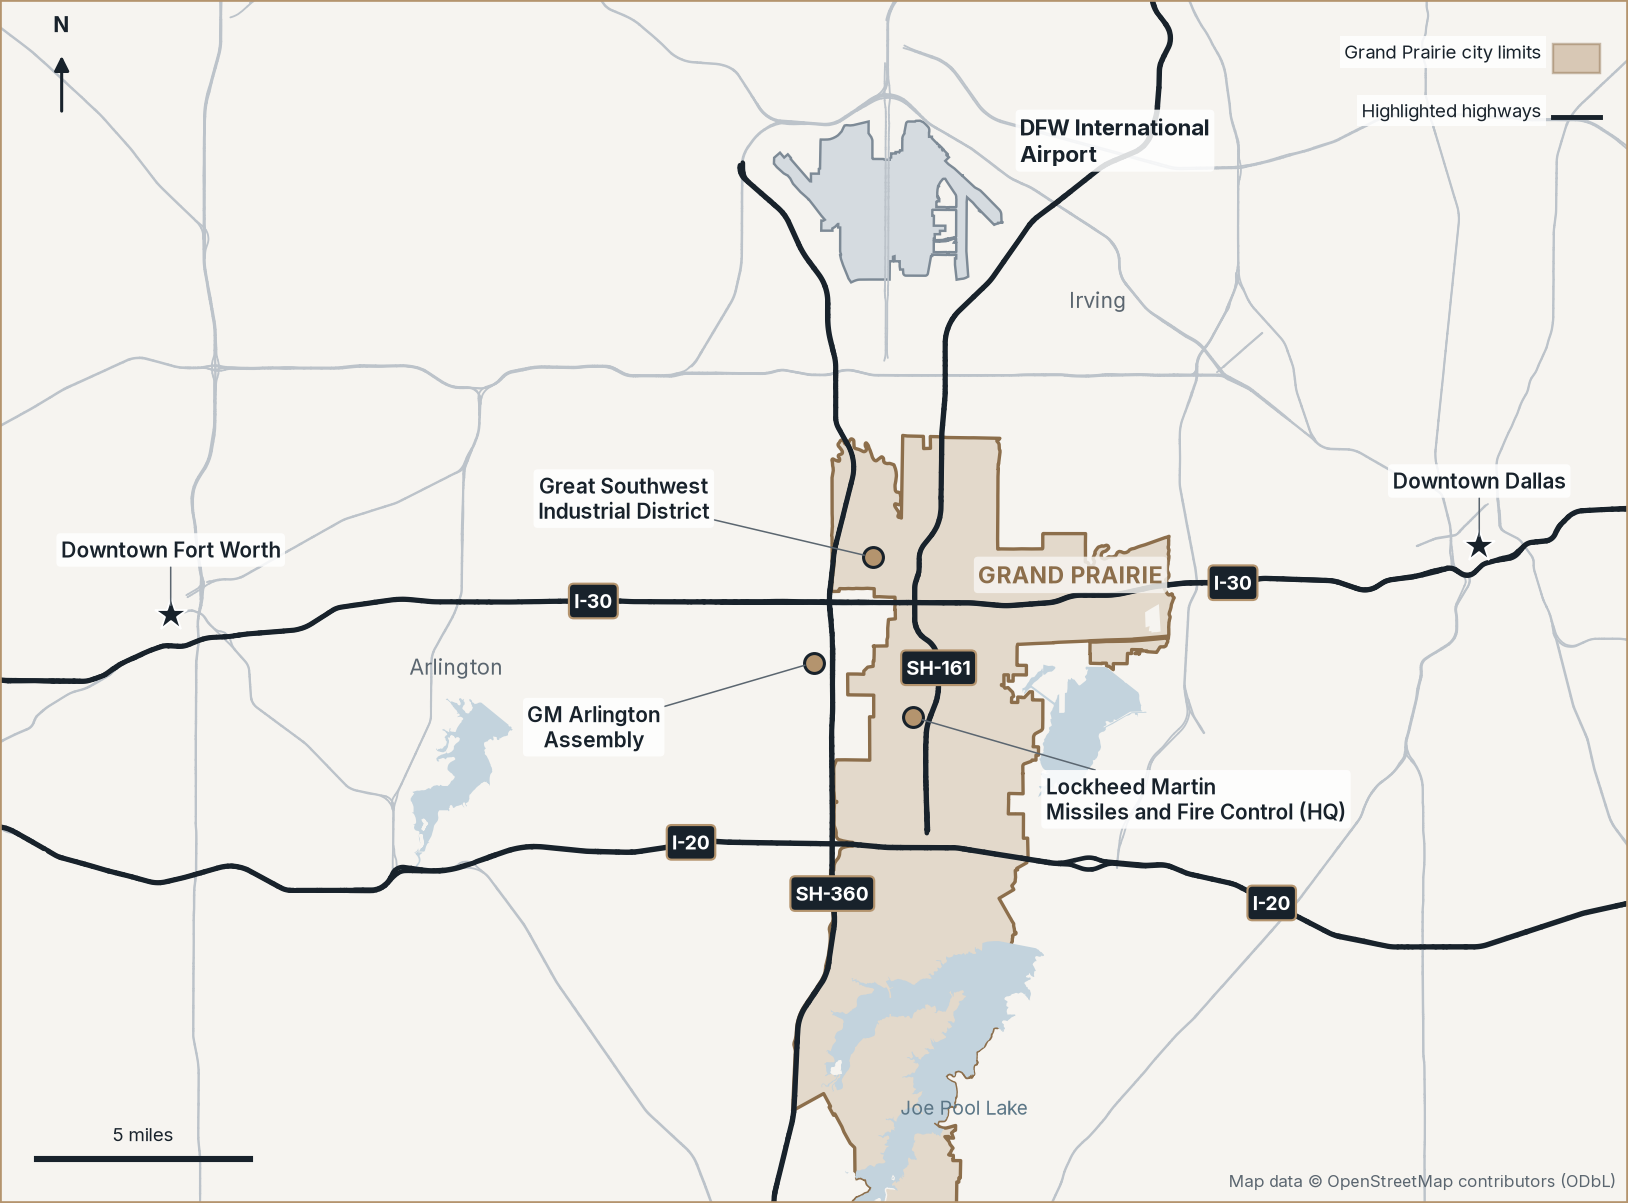
Chart Summary and Key Values
The map locates Grand Prairie between downtown Dallas and downtown Fort Worth, south of DFW International Airport. It marks I-30, I-20, SH-360, the Great Southwest Industrial District, GM Arlington Assembly, Lockheed Martin Missiles and Fire Control and Joe Pool Lake. The displayed scale is five miles.
Grand Prairie sits between Dallas and Fort Worth, just south of DFW Airport. Map data: © OpenStreetMap contributors (ODbL).15
Aerospace & defense
Lockheed Martin Missiles and Fire Control has its headquarters in Grand Prairie and is the city's largest employer, with about 5,000 jobs.13,16
In 2025, Lockheed's Missiles and Fire Control unit won a $9.8 billion U.S. Army contract to raise PAC-3 MSE annual production capacity from 620 to 1,970 missiles. It is the largest contract in the unit's history. The Grand Prairie facility won another $77 million in contracts in February 2026.14
Grand Prairie is also home to a broader aerospace cluster. The city's 2023 top-employer list includes Bell Textron (700), Airbus Helicopters (600) and Safran Helicopters (530).13
Logistics & advanced manufacturing
Much of the roughly 80-million-square-foot Great Southwest Industrial District is in Grand Prairie.13 Prologis is the city's largest taxpayer.13
Bear Creek Logistics Park: a planned 1.45-million-square-foot, five-building campus on 109 acres at Rock Island Rd. and President George Bush Turnpike. Construction was expected to start in Q2 2026, with delivery targeted for early 2028.17
Other major employers in the city's 2023 list include Poly-America (2,000), Flex-N-Gate (1,200), Siemens (1,200), Lear (1,105), the GM logistics center (500), SAIA and Arnold Transportation.13
Next door in Arlington, GM Arlington Assembly employs about 5,200 people and builds more than 1,300 vehicles a day.18
Entertainment, hospitality & infrastructure
EpicCentral (172 acres along SH-161) is adding a planned $90 million, roughly 225-room full-service hotel with a 15,000-square-foot convention center. Construction is scheduled for summer 2027 and the opening for summer 2029.19
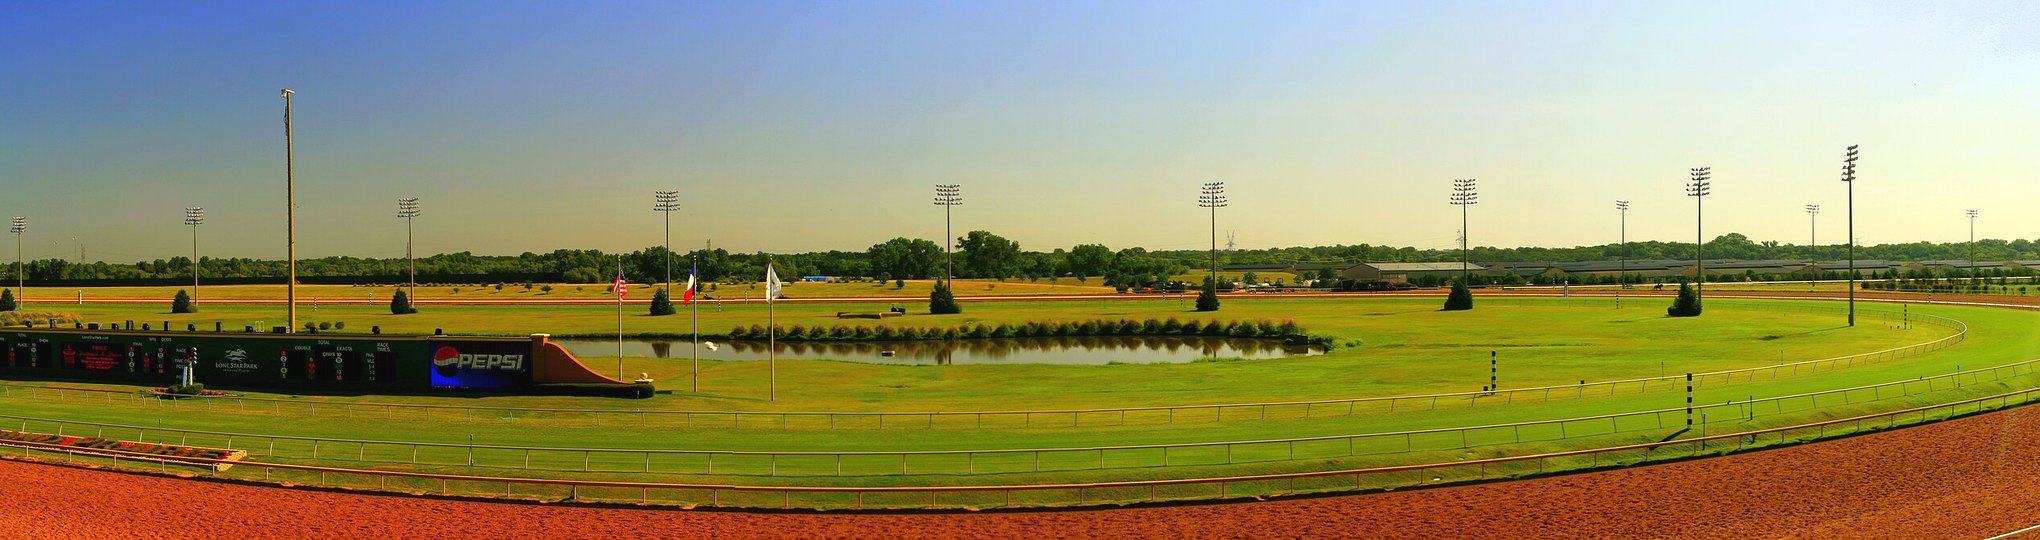
Grand Prairie Stadium is the home of Major League Cricket's Texas Super Kings. It hosted 15 matches over nine days during the 2026 season.20 Lone Star Park employs about 950 people.13
DFW Airport is expanding Terminal F into a 31-gate, roughly $4 billion project, with the first phase targeted for 2027. It is part of more than $12 billion in airport investments that are planned or underway.21

3. The supply pipeline is shrinking
BOTTOM LINE DFW apartment starts fell about 35% in a year, so far fewer new units will be competing for renters in 2028 and beyond.
This is the core of the development thesis. The supply wave of 2023 to
-35%
2025, which peaked at a record 44,218 completions in 2024,2 came from projects that started in 2021 and 2022, when money was cheap.
DFW trailing-12-month apartment starts, year over year (CoStar via MMG)5
Since then, higher interest rates and construction costs have stopped many new projects from getting off the ground.
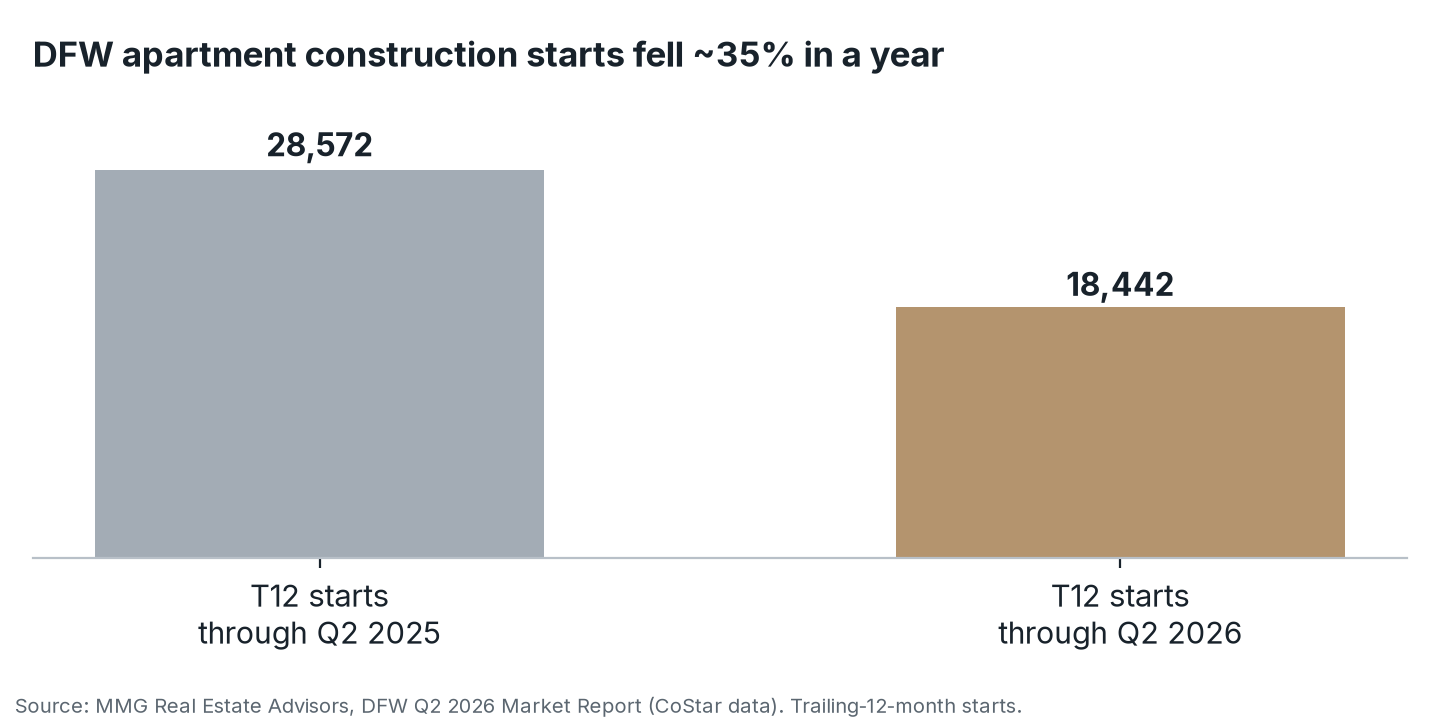
Chart Summary and Key Values
Dallas–Fort Worth apartment construction starts fell from 28,572 in the trailing 12 months through Q2 2025 to 18,442 through Q2 2026, approximately 35% lower. The chart attributes these figures to MMG Real Estate Advisors using CoStar data.
Trailing-12-month DFW multifamily construction starts.
Starts: DFW's trailing-12-month starts fell to 18,442 units, down from 28,572 a year earlier, a decline of about 35%.5
Under construction: Estimates range from about 30,200 to 43,300 units, depending on the data provider's methodology. Every source shows a steep decline. CoStar data shows 30,545 units, down 27% year over year and 3.3% of inventory.5 Cushman & Wakefield counts about 30,200 units, down 21.3%.22 Northmarq counts about 43,300 units, 43% below the 2023 peak by unit count.23 Measured as a share of inventory, Matthews puts the pipeline at 4.32%, down from an 8.54% peak in Q1 2023, or roughly half the peak share.3
Deliveries: Q2 2026 completions of 6,238 units were down 24.4% year over year.3 Northmarq calls it the lowest quarterly total since early 2023.23 Transwestern expects about 24,133 units to deliver over the next year.24
Permits: The Dallas metro issued 15,924 multifamily permits in the 12 months through August 2026, about 2,300 fewer than a year earlier.25
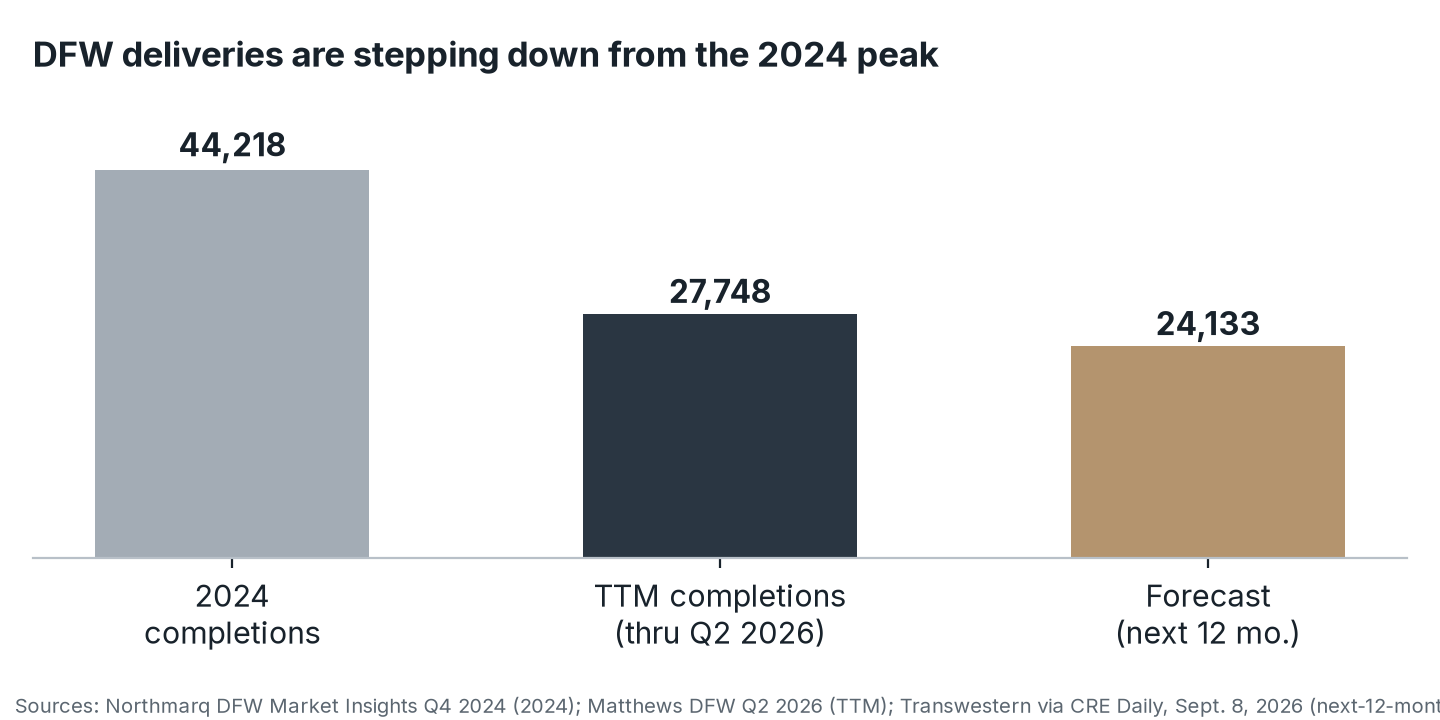
Chart Summary and Key Values
Dallas–Fort Worth apartment completions: 44,218 units in 2024, 27,748 in the trailing 12 months through Q2 2026, and a forecast of 24,133 for the next 12 months. The forecast is not an actual count, and the source providers and measurement periods differ as identified below the figure.
DFW apartment completions and the forecast for the next 12 months.
The national picture
U.S. apartment starts fell to about 55,000 units in Q1 2026. That is 73% below the early-2022 peak and the lowest quarterly level since 2011. Units under construction nationally (about 579,000) are down more than 50% from the early-2023 peak.6 Yardi Matrix expects new U.S. supply to bottom out in 2027 at about 444,000 units.26
4. Absorption, occupancy and rents
BOTTOM LINE DFW renters absorbed roughly twice as many units as were delivered in Q2 2026, and rents are stabilizing.
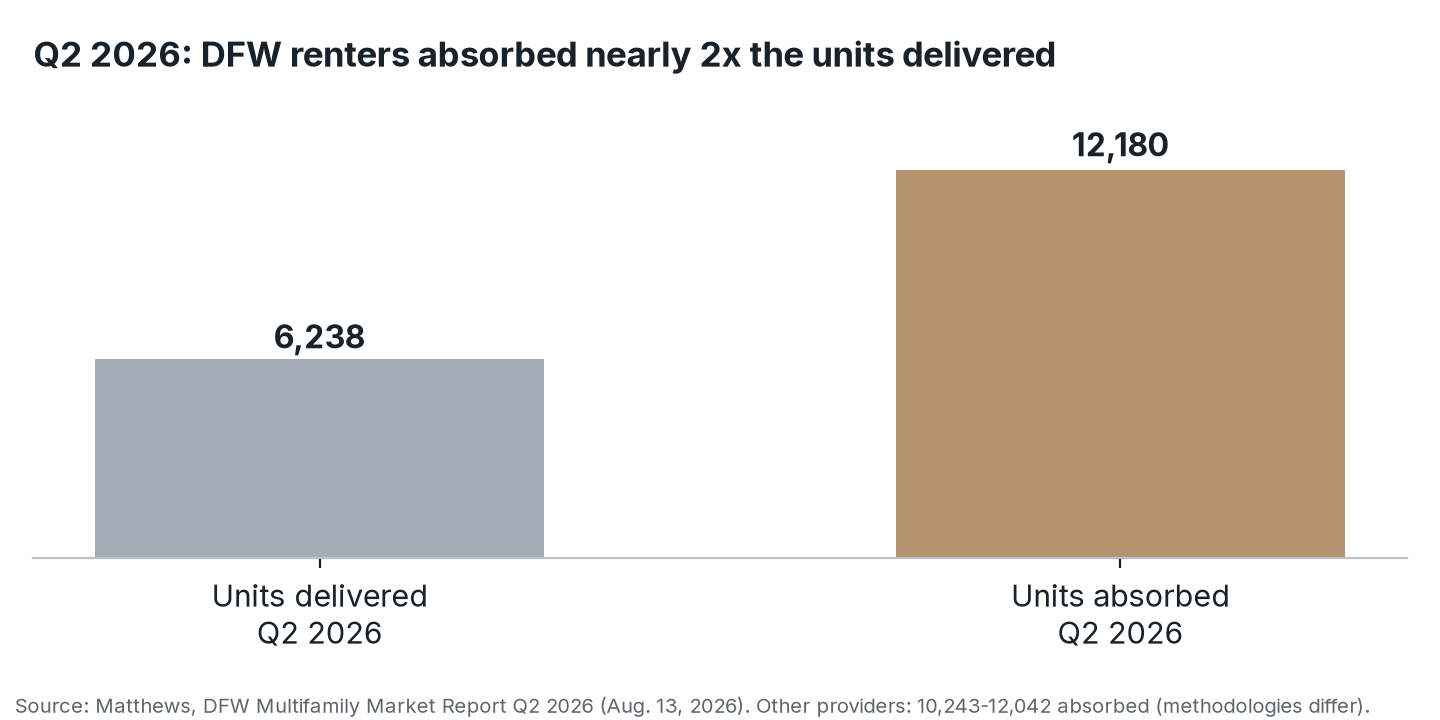
Chart Summary and Key Values
In Q2 2026, Dallas–Fort Worth recorded 6,238 apartment units delivered and 12,180 absorbed, nearly twice as many absorbed as delivered. The chart attributes the figures to Matthews; its source note warns that other providers report somewhat different absorption totals.
Quarterly DFW deliveries vs. net absorption, Q2 2026.
Demand has caught up. Cushman & Wakefield calls Q2 2026 absorption
~2x
(about 10,800 units) the strongest quarter since Q3 2021.22 Over the trailing four quarters, absorption (26,219 units) nearly matched
Q2 2026 absorption vs. deliveries: 12,180 units absorbed, 6,238 delivered (Matthews)3
completions (28,232).5 Data providers measure occupancy and rent differently. For example, CoStar-based figures include properties still in lease-up. So the table below shows each provider's figure side by side rather than mixing them.
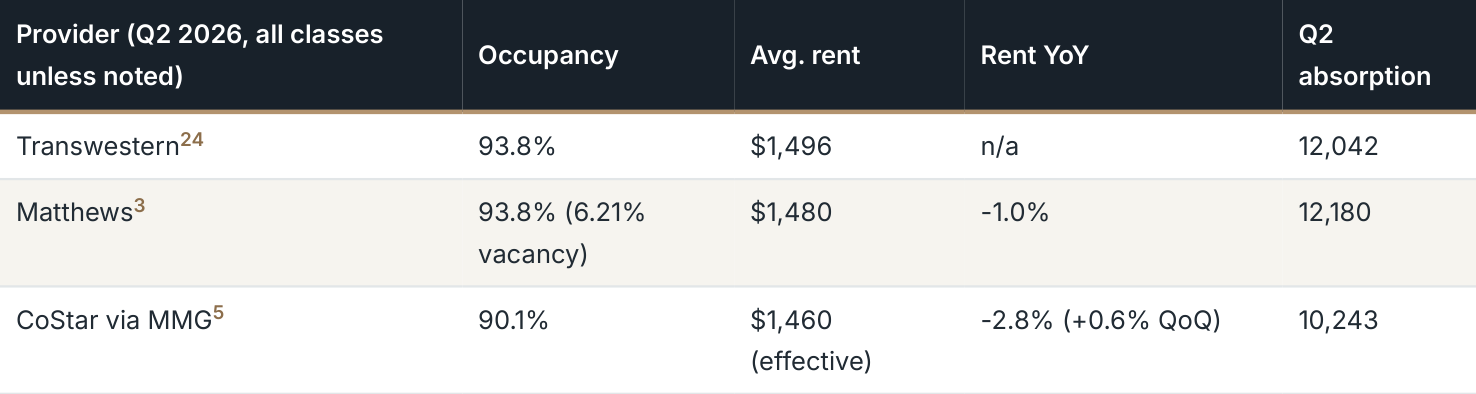
Table Summary and Key Values
| Provider (Q2 2026, all classes unless noted) | Occupancy | Avg. rent | Rent YoY | Q2 absorption |
|---|---|---|---|---|
| Transwestern24 | 93.8% | $1,496 | n/a | 12,042 |
| Matthews3 | 93.8% (6.21% vacancy) | $1,480 | -1.0% | 12,180 |
| CoStar via MMG5 | 90.1% | $1,460 (effective) | -2.8% (+0.6% QoQ) | 10,243 |

Table Summary and Key Values
| Provider (Q2 2026, all classes unless noted) | Occupancy | Avg. rent | Rent YoY | Q2 absorption |
|---|---|---|---|---|
| Northmarq23 | Vacancy declined | Class A +1.3% QoQ | Class A positive 3 straight qtrs. | ~12,000 |
How to read it: Rents are still slightly below year-ago levels, but the trend has turned. CoStar data shows the first quarter-over-quarter rent gain in four quarters.5 Northmarq reports that Class A rents, the segment new development competes in, have grown year over year for three straight quarters, and it expects metro-wide rents to return to year-over-year growth by year-end.23 Concessions such as free rent and fee waivers are still common in lease-up.27
Grand Prairie submarket snapshot
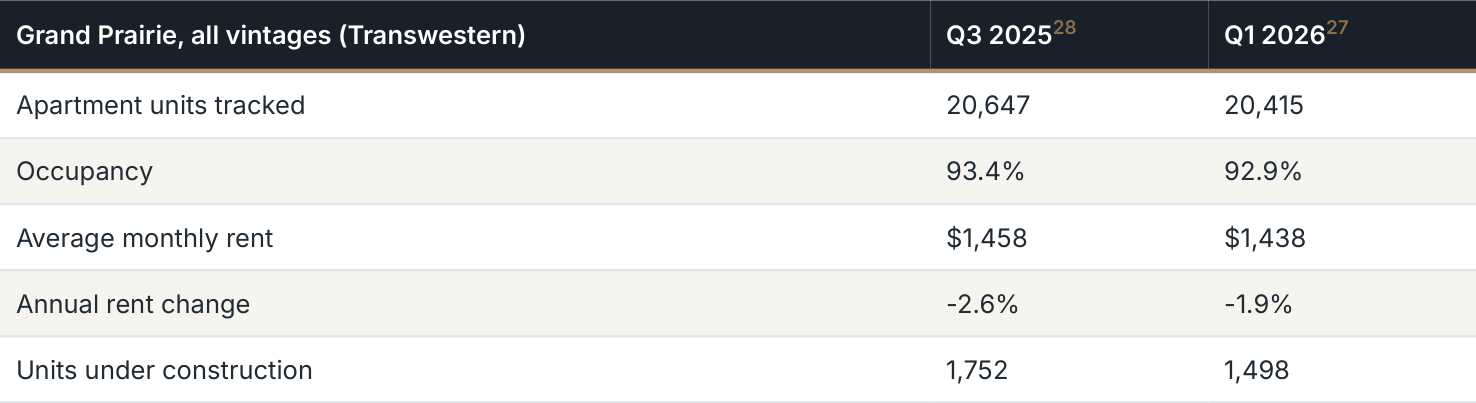
Table Summary and Key Values
| Grand Prairie, all vintages (Transwestern) | Q3 202528 | Q1 202627 |
|---|---|---|
| Apartment units tracked | 20,647 | 20,415 |
| Occupancy | 93.4% | 92.9% |
| Average monthly rent | $1,458 | $1,438 |
| Annual rent change | -2.6% | -1.9% |
| Units under construction | 1,752 | 1,498 |
Grand Prairie is working through its own local supply. Yardi Matrix pipeline data, compiled by MMG, lists several recent and upcoming Grand Prairie deliveries. In lease-up: The Westlyn (300 units), Casona (305) and Jefferson Harlow (352). Under construction: Jefferson Ashford (268, expected Oct. 2026) and Jefferson Great Southwest (439, expected Feb. 2027). As of August 2026, the same dataset showed no further planned Grand Prairie projects.29 Rents in the submarket are softer while these projects lease up, but the local pipeline is thinning. Note that Transwestern's sample changes from quarter to quarter, so treat these figures as directional.
5. History lesson: what happened to DFW rents after the last
supply wave
BOTTOM LINE After DFW's last supply wave, rents rebounded materially once construction slowed; that is a historical pattern, not a forecast.
Today's modest rent softness is the result of a supply wave, not a
~8%
collapse in demand. That raises a fair question: what has happened in the past once a wave of new construction ran its course and the pipeline
peak trend rent growth (Q2 2016) after DFW's last supply wave, vs. a 3.6% long-term average (Texas A&M)30
shut off? DFW's last full cycle offers a useful, well-documented example. It is history, not a forecast.
The glut: 2008-2009
DFW rent growth topped out at about 4% year over year in 2007. Then a wave of completions hit just as the recession arrived: 12,148 units delivered in 2008 and another 18,961 through November 2009. Year-end 2009 occupancy fell to about 88.8%, and rents fell 3.5% over 12 months, according to M/PF Research.31
The pipeline shuts off: 2009-2010
Texas multifamily construction bottomed out in late 2009.32 DFW completions dropped from about 17,200 units in 2009 to about 7,900 in 2010. As demand returned, the metro absorbed about 16,500 units in the first nine months of 2010, vacancy fell to 7.9%, and effective rents were already up 1.5% through the third quarter.33
The rebound: 2011-2016
Strong leasing pushed nominal rents well above their prerecession highs in all major Texas metros by early 2012, according to the Dallas Fed.32 By Q2 2015, DFW occupancy stood at 95.4%, with rents up 5.5% year over year (MPF Research).34 The Texas A&M Real Estate Center describes DFW's post-recession rent recovery as V-shaped, with the trend in rent growth peaking at about 8% in Q2 2016, more than double the market's long-term average of 3.6%.30
A more recent echo. After the 2018-2019 construction wave, DFW leasing set records and new supply could not keep up. In 2021, RealPage counted almost 50,000 units of net leasing, nearly double the previous record set in 2019. Vacancy fell to 2.8% and average rents rose more than 17%.35 Pandemic-era demand made 2021 exceptional, so it should not be treated as a typical rebound.
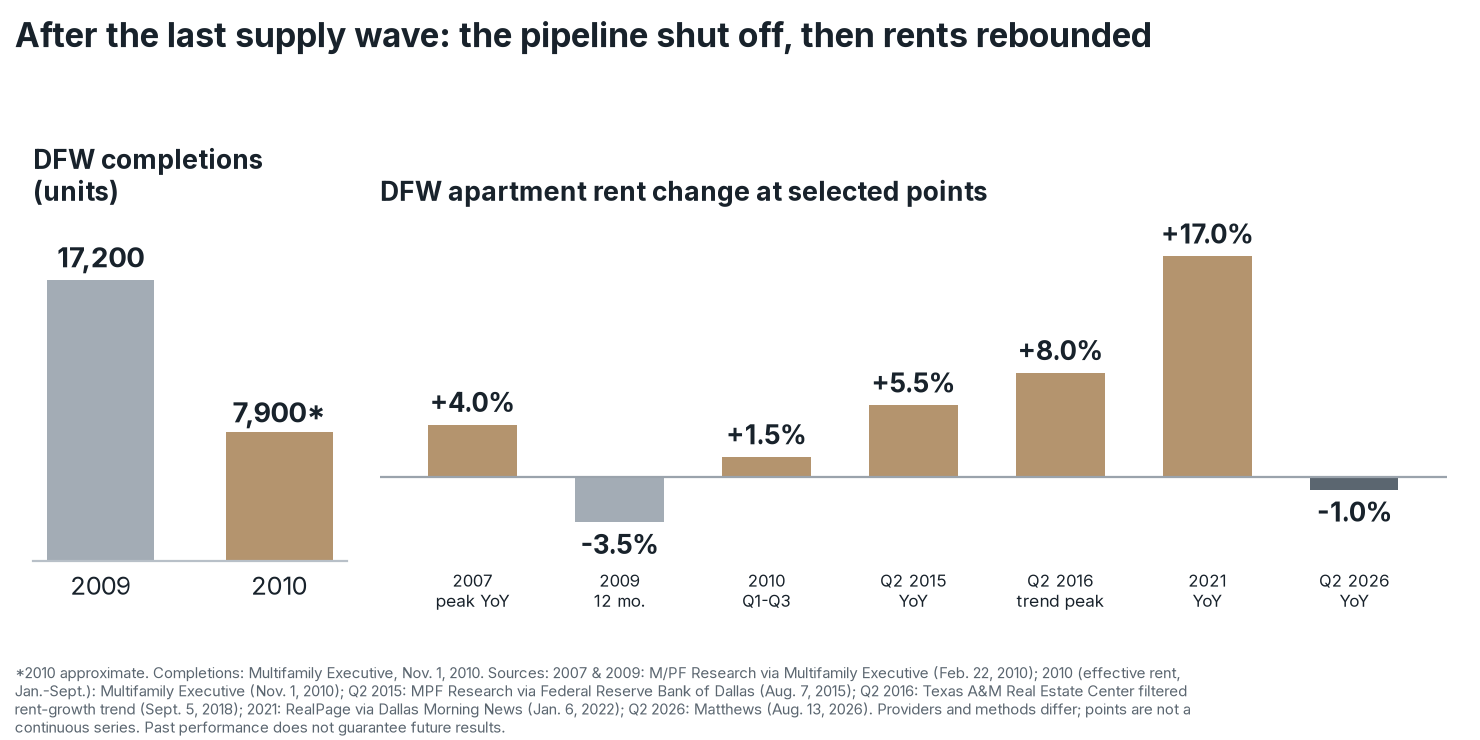
Chart Summary and Key Values
After the previous supply wave, DFW completions declined from 17,200 units in 2009 to approximately 7,900 in 2010, the latter a preliminary figure. Selected rent-change observations shown are +4.0% in 2007, −3.5% in 2009, +1.5% in 2010, +5.5% in Q2 2015, +8.0% in Q2 2016, +17.0% in 2021 and −1.0% in Q2 2026. Measurement periods and providers differ, as the source note explains; this historical pattern is not a forecast.
Selected published DFW data points. Sources and methods differ by period; the bars are not a continuous series.
The pattern, and its limits. In past DFW cycles, rents weakened while a supply wave was delivered, then rose materially once new starts fell and demand absorbed the vacant units. That is a historical pattern, not a prediction or a promise. Each cycle has had different drivers (the 2010s recovery coincided with tight mortgage credit; 2021 with pandemic migration), and the next one may not repeat it. Past performance does not guarantee future results.
6. Why starting now can mean delivering into a tighter market
BOTTOM LINE A project that breaks ground in mid-2026 would likely deliver in early-to-mid 2028, after much of today's pipeline has been absorbed.
Development is a timing business. Equity committed today is not exposed to today's lease-up market. It is exposed to the market when the project opens, typically about 18 to 24 months after groundbreaking, followed
by lease-up. A project that breaks ground in mid-2026 would deliver in roughly early-to-mid 2028. The data points to an unusually favorable setup for that window:
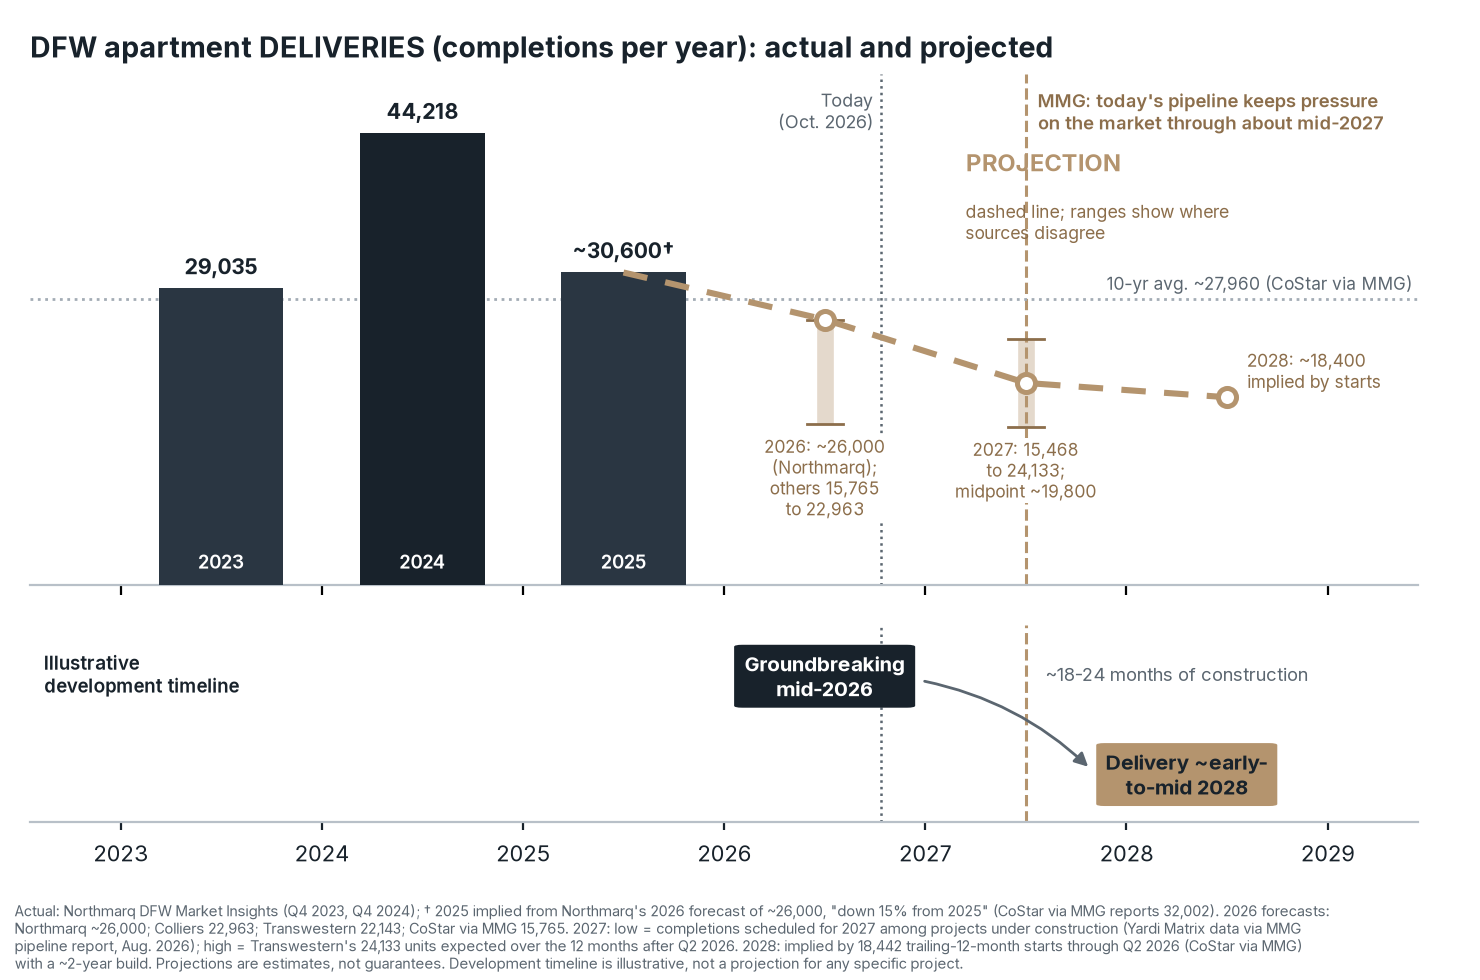
Chart Summary and Key Values
The DFW delivery timeline shows 29,035 apartment completions in 2023, 44,218 in 2024 and approximately 30,600 in 2025. Later bands distinguish published projections, differing provider ranges and an implied 2028 level rather than presenting them as actuals. Its illustrative development schedule starts in mid-2026, allows 18–24 months for construction and delivers in early to mid-2028.
Deliveries = apartment units completed per year. Actual: Northmarq.1,2 Forecasts and projections: Northmarq,23 Colliers,36 Transwestern,24,27 CoStar via MMG5,37 and Yardi Matrix data via MMG.29 Pressure marker: MMG.5 Projections are estimates, not
guarantees; the development timeline is illustrative, not a projection for any specific project.
1. The competition is not being built. With starts down about 35% year over year in DFW5 and national starts at a 15-year low,6 fewer new communities will be competing for renters in 2028 and 2029.
2. Today's pipeline will mostly be absorbed by then. MMG expects the current under-construction pipeline to keep pressure on the market through about mid-2027.5 Projects started now would open after that period. Published forecasts put DFW deliveries at about 15,800 to 26,000 units in 202623,27,36,37 and roughly 15,500 to 24,100 in 2027,24,29 and current construction starts imply about 18,400 in 2028,5 all below the 10- year average of about 28,000 a year.37 That is a substantial decline, though not a drop to zero.
3. Demand keeps compounding. DFW keeps adding more than 100,000 residents a year4 and tens of thousands of jobs.10 Meanwhile, 30-year mortgage rates of about 7.40%38 keep many would-be buyers renting longer, a dynamic Yardi Matrix cites as an extra source of apartment demand.26
4. A developer's view: development builds in equity that acquisitions can't. An acquisition, by definition,
happens at fair market value, so any value above the purchase price has to be created after closing, through renovations, better management or higher rents. A disciplined developer starts a project only when the cost to build it is below what the finished, stabilized property is expected to be worth at fair market value. When that holds, the gap between cost and value is equity built in from day one, which is why we
believe development is inherently the stronger way to create value. It is not guaranteed: it depends on building on budget and on schedule, leasing at underwritten rents and values holding through the exit.

4.0, via Wikimedia Commons (cropped)
7. Development risks and how disciplined sponsors manage
them
BOTTOM LINE Cost, schedule, rate, lease-up and exit risks are real, and how a sponsor structures and manages them matters as much as the market.
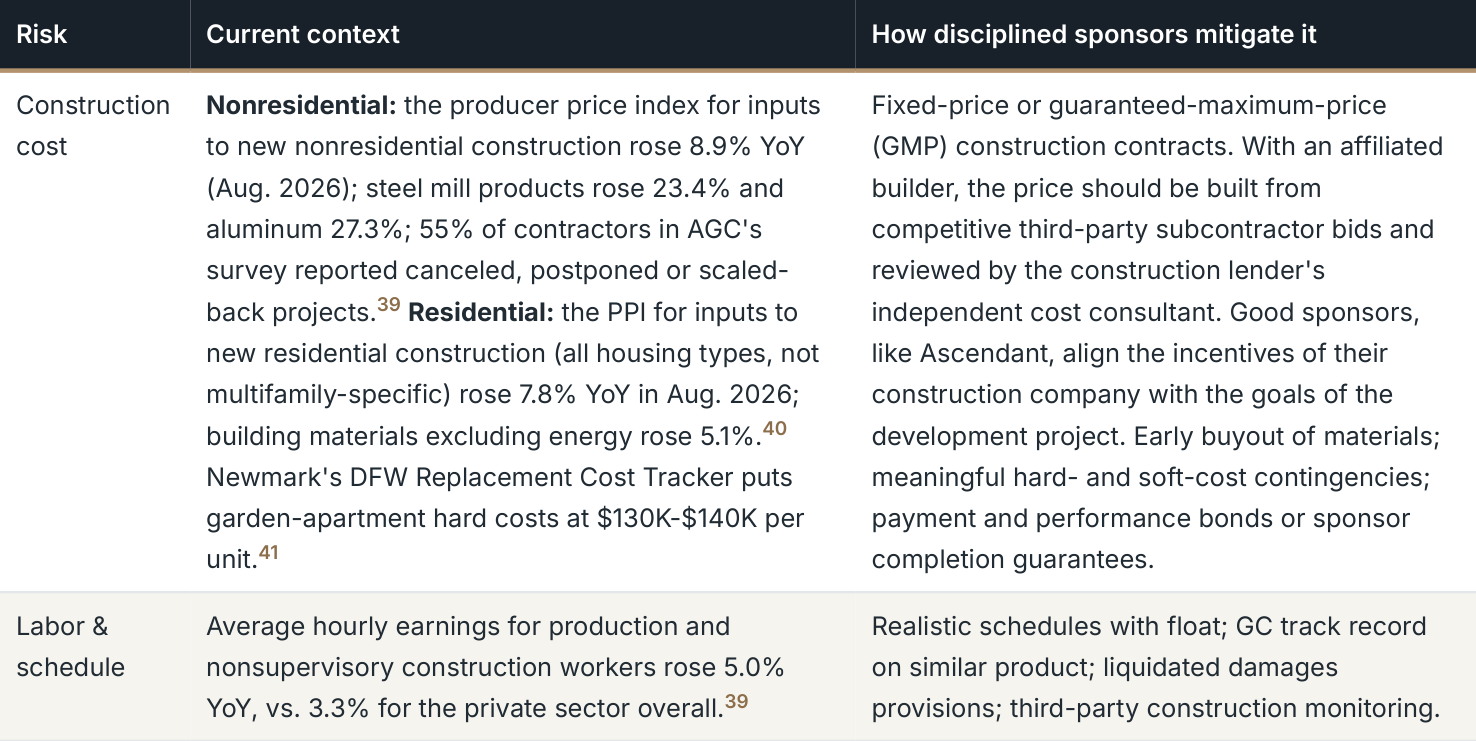
Table Summary and Key Values
| Risk | Current context | How disciplined sponsors mitigate it |
|---|---|---|
| Construction cost | Nonresidential: the producer price index for inputs to new nonresidential construction rose 8.9% YoY (Aug. 2026); steel mill products rose 23.4% and aluminum 27.3%; 55% of contractors in AGC's survey reported canceled, postponed or scaled- back projects.39 Residential: the PPI for inputs to new residential construction (all housing types, not multifamily-specific) rose 7.8% YoY in Aug. 2026; building materials excluding energy rose 5.1%.40 Newmark's DFW Replacement Cost Tracker puts garden-apartment hard costs at $130K-$140K per unit.41 | Fixed-price or guaranteed-maximum-price (GMP) construction contracts. With an affiliated builder, the price should be built from competitive third-party subcontractor bids and reviewed by the construction lender's independent cost consultant. Good sponsors, like Ascendant, align the incentives of their construction company with the goals of the development project. Early buyout of materials; meaningful hard- and soft-cost contingencies; payment and performance bonds or sponsor completion guarantees. |
| Labor & schedule | Average hourly earnings for production and nonsupervisory construction workers rose 5.0% YoY, vs. 3.3% for the private sector overall.39 | Realistic schedules with float; GC track record on similar product; liquidated damages provisions; third-party construction monitoring. |
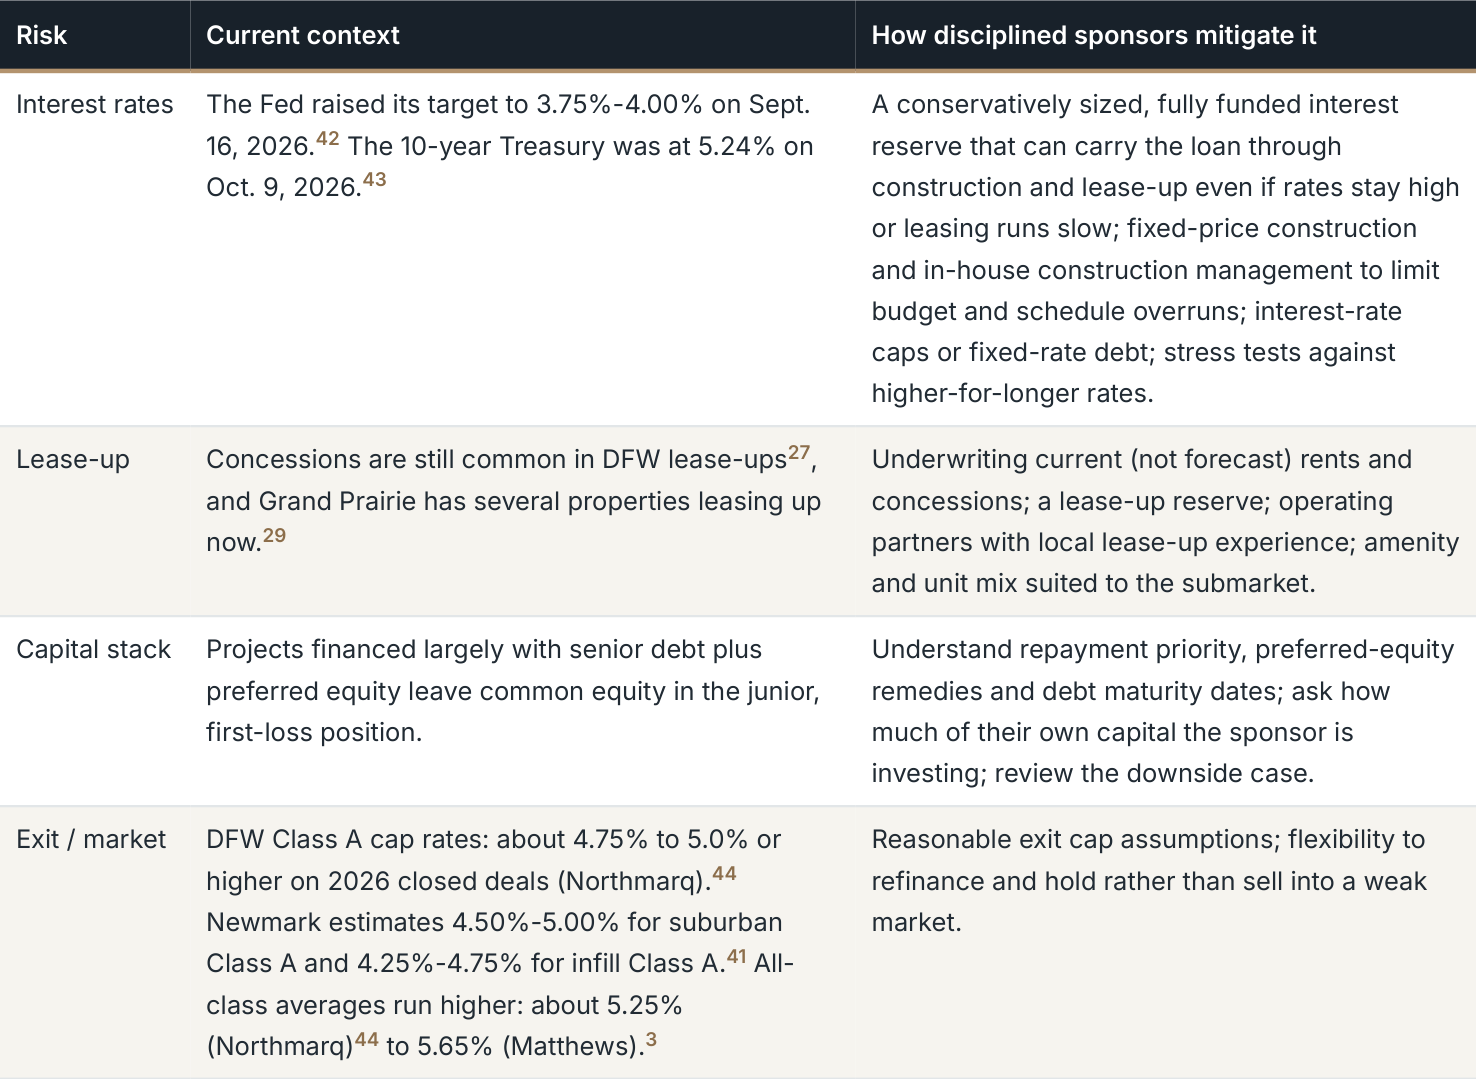
Table Summary and Key Values
| Risk | Current context | How disciplined sponsors mitigate it |
|---|---|---|
| Interest rates | The Fed raised its target to 3.75%-4.00% on Sept. 16, 2026.42 The 10-year Treasury was at 5.24% on Oct. 9, 2026.43 | A conservatively sized, fully funded interest reserve that can carry the loan through construction and lease-up even if rates stay high or leasing runs slow; fixed-price construction and in-house construction management to limit budget and schedule overruns; interest-rate caps or fixed-rate debt; stress tests against higher-for-longer rates. |
| Lease-up | Concessions are still common in DFW lease-ups27, and Grand Prairie has several properties leasing up now.29 | Underwriting current (not forecast) rents and concessions; a lease-up reserve; operating partners with local lease-up experience; amenity and unit mix suited to the submarket. |
| Capital stack | Projects financed largely with senior debt plus preferred equity leave common equity in the junior, first-loss position. | Understand repayment priority, preferred-equity remedies and debt maturity dates; ask how much of their own capital the sponsor is investing; review the downside case. |
| Exit / market | DFW Class A cap rates: about 4.75% to 5.0% or higher on 2026 closed deals (Northmarq).44 Newmark estimates 4.50%-5.00% for suburban Class A and 4.25%-4.75% for infill Class A.41 All- class averages run higher: about 5.25% (Northmarq)44 to 5.65% (Matthews).3 | Reasonable exit cap assumptions; flexibility to refinance and hold rather than sell into a weak market. |
8. Tax considerations of new development for LPs
BOTTOM LINE New development can generate meaningful depreciation for LPs, but the benefit depends on each investor's tax situation.
General education only, not tax advice. Tax outcomes depend on each investor's situation. Consult your own CPA or tax advisor.
Depreciation: Residential rental buildings are generally depreciated straight-line over 27.5 years. Land is not depreciable.45 In a partnership, depreciation generally flows through to LPs on Schedule K-1 and can offset taxable income from the property.
Bonus depreciation: The One, Big, Beautiful Bill made a permanent 100% additional first-year (bonus) depreciation deduction for eligible property acquired after January 19, 2025.46 The building itself is not eligible. A cost segregation study can identify shorter-lived components, such as certain fixtures, finishes and site improvements, that may qualify. IRS guidance also includes elections for components of self- constructed property.46
New construction vs. acquisition: In new development, the full cost basis of the improvements is depreciable from the day the property is placed in service. Depreciation deductions are usually taken once units are delivered, not during construction.
Passive activity rules: Rental activities are generally passive. Passive losses generally offset only passive income unless you qualify as a real estate professional, and unused losses carry forward.47
Recapture: Depreciation can be recaptured and taxed when the property is sold. Planning for the exit is part of the analysis.45
About Ascendant Development
Ascendant Development is a vertically integrated real estate development and construction firm headquartered in Houston, Texas. According to the company, Ascendant and its principals have been involved in garden, mid-rise and high-rise projects totaling more than 5,000 Class A multifamily units and more than $1 billion in total investment.
Stay ahead of the next cycle
Join the Ascendant Development investor list for quarterly DFW and Texas multifamily market updates, new editions of this report and early notice when we open offerings to verified accredited investors. To walk through the data or our development approach, visit https://www.ascendantdevco.com/invest- with-us or call Ascendant Development at 713.600.9393.
Join the DFW Multifamily Outlook Investor List Sign up for DFW Multifamily Outlook investor updates →
Scan the code to join the DFW Multifamily Outlook Investor List.
Important disclosures
This report is provided for general informational and educational purposes only. It is not an offer to sell, or a solicitation of an offer to buy, any security, and it may not be relied upon in connection with any investment decision. Any offer will be made only to verified accredited investors through definitive offering documents (including a private placement memorandum, operating agreement and subscription agreement), which will contain important information about risks, fees and conflicts of interest.
Any offering referenced by the sponsor is expected to be made under Rule 506(c) of Regulation D. Investments are available only to accredited investors, as defined in Rule 501(a), whose status has been verified through reasonable steps. Securities offered under Regulation D are not registered with the SEC or any state securities regulator, and no regulator has approved or reviewed this material.
Real estate development investments are speculative, illiquid and involve a high degree of risk, including the possible loss of an investor's entire investment. Common equity is typically subordinate to senior debt and preferred equity. Past performance and market trends do not guarantee future results. Statements about future market conditions are forward-looking, based on third-party data and forecasts believed to be reliable but not independently verified, and actual results may differ materially.
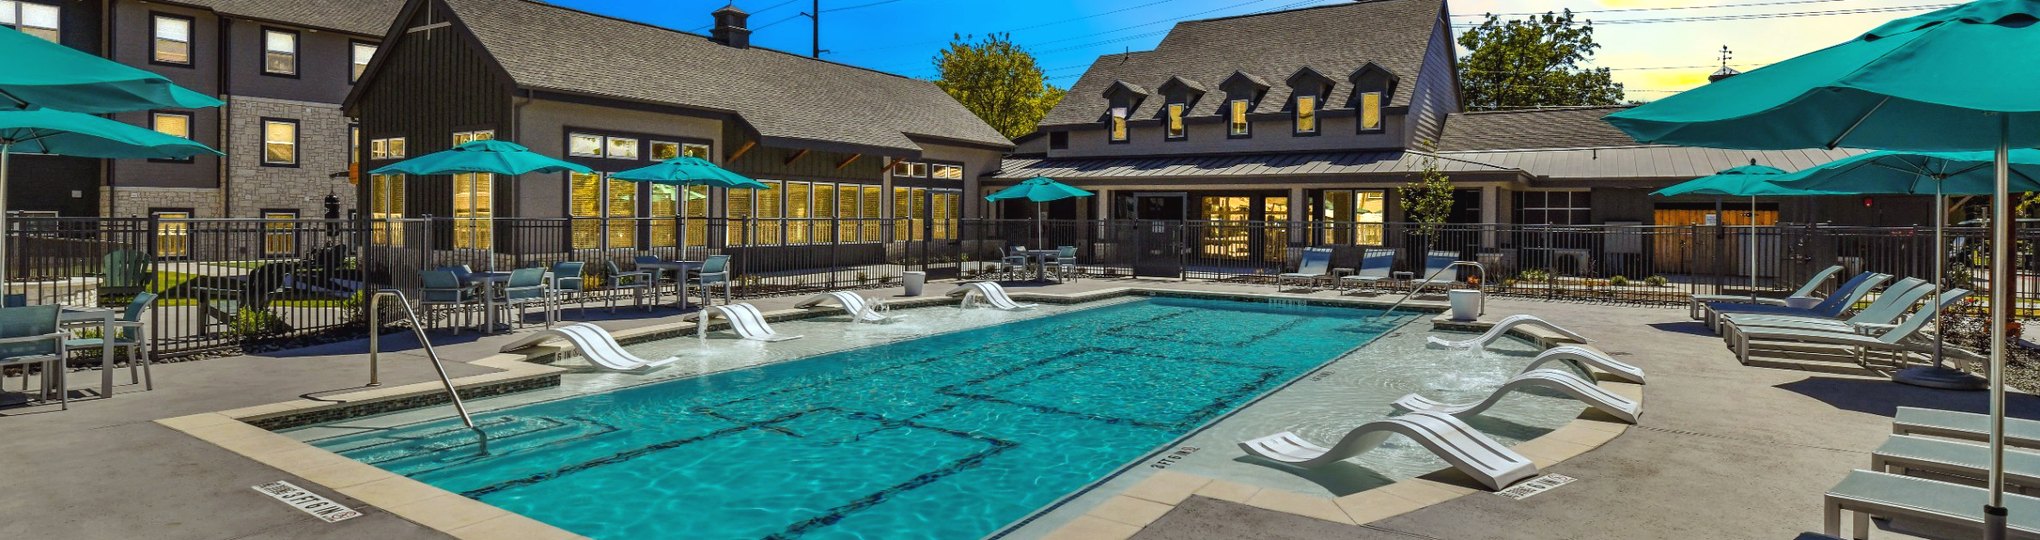
References to Ascendant Development's history, people, projects and practices are provided for general informational purposes only. They do not describe the terms, risks, projected performance or suitability of any investment. Photographs show prior or existing Ascendant
projects and do not depict, or represent the results of, any current or future offering. Information about any investment will be provided only to verified accredited investors through offering documents, which control in the event of any inconsistency.
Historical market data, including the discussion of prior DFW rent cycles, is presented for context only. Past market patterns and past performance do not guarantee future results, and future rent growth may be lower than, or different from, historical experience.
Nothing in this report is legal, tax or investment advice. Tax laws are complex and subject to change, and their application depends on individual circumstances. Consult your own legal, tax and financial advisors before making any investment decision.
Sources
- Northmarq, Dallas-Fort Worth Multifamily Market Insights, Q4 2023 (2023 completions; units under construction). View source
- Northmarq, Dallas-Fort Worth Multifamily Market Insights, Q4 2024 (2024 completions; units under construction). View source
- Matthews Real Estate Investment Services, "Dallas-Fort Worth, TX Multifamily Market Report Q2 2026," Aug. 13, 2026. View source
- U.S. Census Bureau, "Slow Growth Impacts Nation's Largest Counties Hardest" (Vintage 2025 metro estimates), Table 10, released Mar. 26, 2026. View source
- MMG Real Estate Advisors, "Dallas-Fort Worth Q2 2026 Market Report" (CoStar data). View source
- CoStar Group / Apartments.com, "Multifamily Construction Activity Update for Q1 2026," May 12, 2026. View source
- Fort Worth Star-Telegram, "Here's how many people Dallas-Fort Worth gained in 2025" (components of change, Census V2025), Mar. 2026. View source
- U.S. Census Bureau, "Population Gains in Metro Areas Driven Largely by Growth in the Exurbs This Decade," May 2026. View source
- Federal Reserve Bank of Dallas, Dallas Economic Indicators (August 2026 data), Sept. 2026. View source
- U.S. Bureau of Labor Statistics, The Economics Daily, "Employment up in 10 large metro areas, down in 2, over year ended June 2026," Aug. 10, 2026. View source
- Federal Reserve Bank of Dallas, Texas Employment Forecast, Sept. 18, 2026. View source
- U.S. Census Bureau, QuickFacts: Grand Prairie city, Texas (V2025 estimates). View source
- City of Grand Prairie, "About Grand Prairie, Texas" (Top Employers 2023; industrial district; demographics). View source
- Fort Worth Report, "$77M boost: Lockheed Martin defense contracts fire up missile production in Grand Prairie," Feb. 24, 2026. View source
- OpenStreetMap contributors, map data (ODbL), extracted Oct. 10, 2026. Lockheed Martin MFC plotted at 1701 W. Marshall Dr., Grand Prairie (TDLR facility record); GM Arlington Assembly at its OpenStreetMap site outline. View source
- Grand Prairie Economic Development, "Aerospace & Defense". View source
- Logistics Property Company, "Logistics Property Company Closes on Land for Bear Creek Logistics Park," Feb. 26, 2026. View source
- KRLD/Audacy, "GM to move Escalade production out of Texas - but Arlington jobs stay strong," Jul. 17, 2025. View source
- City of Grand Prairie, "First Full Service, Four-Star Hotel Coming to EpicCentral," Sept. 2, 2026. View source
- Visit Grand Prairie, "Major League Cricket Stadium" (2026 season). View source
- DFW International Airport, "DFW Airport and American Airlines Announce Acceleration and Expansion of Plans for Terminal F," May 1, 2025. View source
- Cushman & Wakefield, DFW Multifamily MarketBeat Q2 2026. View source
- Northmarq, "Dallas-Fort Worth Multifamily Market Insights, Q2 2026". View source
- CRE Daily, "Dallas-Fort Worth Multifamily Absorption Climbs in Q2" (Transwestern Q2 2026 data), Sept. 8, 2026. View source
- RealPage Analytics, "Market Permits August 2026," Sept. 28, 2026. View source
- Multifamily Dive, "Multifamily new supply set to bottom out in 2027" (Yardi Matrix Q3 Supply Forecast), Aug. 25, 2026. View source
- Transwestern, Dallas-Fort Worth Multifamily Market Q1 2026 factsheet (Market Indicators Table, Grand Prairie submarket). View source
- Transwestern, Dallas-Fort Worth Multifamily Market Q3 2025 factsheet (Grand Prairie submarket). View source
- MMG Real Estate Advisors, "Dallas-Fort Worth Q3 2026 Pipeline Report" (Yardi Matrix data; pipeline as of Aug. 2026). View source
- Texas A&M Real Estate Center (Anari & Hunt), "Steady as She Goes," Sept. 5, 2018. View source
- Multifamily Executive, "Lonestar Limbo" (M/PF Research data), Feb. 22, 2010. View source
- Federal Reserve Bank of Dallas, Southwest Economy, Fourth Quarter 2014 (Texas housing and apartment markets). View source
- Multifamily Executive, "Metroplex Flexes Recovery" (Reis and author research), Nov. 1, 2010. View source
- Federal Reserve Bank of Dallas, L. Assanie, "DFW Economy: Outperforming the State" (MPF Research apartment data), Aug. 7, 2015. View source
- The Dallas Morning News, "D-FW apartment rents more than 17% higher in 2021" (RealPage data), Jan. 6, 2022. View source
- Colliers, Q4 2025 Multifamily Report, Dallas-Fort Worth (2026 delivery and under-construction forecast). View source
- MMG Real Estate Advisors, "2026 Dallas-Fort Worth Forecast" (CoStar data; 2025 and forecast 2026 completions; 10-year average). View source
- Freddie Mac, Primary Mortgage Market Survey (week of Oct. 8, 2026). View source
- Associated General Contractors of America, "Construction Input Costs Climb 8.9% Between August 2025 and August 2026," Sept. 10, 2026. View source
- NAHB Eye on Housing (J. Wade), "Energy Prices Rise Again in August" (BLS Producer Price Index, inputs to new residential construction), Sept. 10, 2026. View source
- Newmark, Dallas-Fort Worth Multifamily Market Report 2Q26 (Newmark's Current Estimate of DFW Cap Rates, updated March 2026; Replacement Cost Tracker; market outlook). View source
- Board of Governors of the Federal Reserve System, FOMC Statement, Sept. 16, 2026. View source
- Advisor Perspectives, "Treasury Yields Snapshot: October 9, 2026". View source
- Northmarq, "Demand nearly doubles new supply," Dallas-Fort Worth Multifamily Market Insights Q2 2026 (PDF; Investment Trends and Looking Ahead). View source
- Internal Revenue Service, Publication 527 (2025), Residential Rental Property. View source
- Internal Revenue Service, IR-2026-06, "Treasury, IRS issue guidance on the additional first year depreciation deduction amended as part of the One, Big, Beautiful Bill," Jan. 14, 2026. View source
- Internal Revenue Service, Publication 925 (2025), Passive Activity and At- Risk Rules. View source
For educational purposes only. Not an offer to sell or a solicitation of an offer to buy any security. Any offering will be made only to verified accredited investors under Rule 506(c) of Regulation D through definitive offering documents. Past performance does not guarantee future results.